| Param | Original file | Final file |
|---|---|---|
| Filename | modeM0/AS1A10_102T12_9000004284_29890cztM0_level2.evt | modeM0/AS1A10_102T12_9000004284_29890cztM0_level2_quad_clean.evt |
| Size (bytes) | 657,054,720 | 69,644,160 |
| Size | 626.6 MB | 66.4 MB |
| Events in quadrant A | 3,654,226 | 431,276 |
| Events in quadrant B | 5,329,678 | 431,191 |
| Events in quadrant C | 6,387,725 | 401,915 |
| Events in quadrant D | 4,109,299 | 411,555 |
| Mode M9 | |||
|---|---|---|---|
| Quadrant | BADHDUFLAG | Total packets | Discarded packets |
| A | 0 | 18 | 0 |
| B | 0 | 19 | 0 |
| C | 0 | 19 | 0 |
| D | 0 | 19 | 0 |
| Mode M0 | |||
|---|---|---|---|
| Quadrant | BADHDUFLAG | Total packets | Discarded packets |
| A | 0 | 14960 | 2 |
| B | 0 | 19734 | 2 |
| C | 0 | 23478 | 2 |
| D | 0 | 16571 | 2 |
| Mode SS | |||
|---|---|---|---|
| Quadrant | BADHDUFLAG | Total packets | Discarded packets |
| A | 0 | 126 | 0 |
| B | 0 | 126 | 0 |
| C | 0 | 126 | 0 |
| D | 0 | 126 | 0 |
| Quadrant | Total seconds | Saturated seconds | Saturation percentage |
|---|---|---|---|
| A | 6199 | 111 | 1.790611% |
| B | 6199 | 185 | 2.984352% |
| C | 6198 | 601 | 9.696676% |
| D | 6198 | 120 | 1.936108% |
Noise dominated data is calculated using 1-second bins in cleaned event files. If a bin has >2000 counts, and if more than 50% of those come from <1% of pixels, then it is considered to be noise-dominated and hence unusable.
| Quadrant | # 1 sec bins | Bins with >0 counts | Bins with >2000 counts | High rate bins dominated by noise | Noise dominated (total time) | Noise dominated (detector-on time) | Marked lightcurve |
|---|---|---|---|---|---|---|---|
| A | 7519 | 6200 | 2 | 2 | 0.03% | 0.03% |  |
| B | 7519 | 6200 | 6 | 6 | 0.08% | 0.10% |  |
| C | 7518 | 6199 | 128 | 128 | 1.70% | 2.06% |  |
| D | 7518 | 6199 | 41 | 41 | 0.55% | 0.66% |  |
Top three noisy pixels from each quadrant. If the there are fewer than three noisy pixels in the level2.evt file, extra rows are filled as -1
| Pixel properties | Quadrant properties | ||||||
|---|---|---|---|---|---|---|---|
| Quadrant | DetID | PixID | Counts | Sigma | Mean | Median | Sigma |
| A | 8 | 192 | 26147 | 137.59 | 938 | 924 | 183.3 |
| A | 1 | 113 | 13228 | 67.12 | 938 | 924 | 183.3 |
| A | 13 | 254 | 10995 | 54.94 | 938 | 924 | 183.3 |
| B | 6 | 159 | 1679203 | 9735.41 | 918 | 900 | 172.4 |
| B | 0 | 229 | 48294 | 274.92 | 918 | 900 | 172.4 |
| B | 12 | 111 | 20172 | 111.79 | 918 | 900 | 172.4 |
| C | 3 | 233 | 2254256 | 11220.5 | 872 | 882 | 200.8 |
| C | 10 | 22 | 581277 | 2890.03 | 872 | 882 | 200.8 |
| C | 14 | 238 | 142471 | 705.03 | 872 | 882 | 200.8 |
| D | 8 | 195 | 389661 | 1863.28 | 905 | 887 | 208.7 |
| D | 2 | 250 | 70944 | 335.76 | 905 | 887 | 208.7 |
| D | 7 | 80 | 69585 | 329.25 | 905 | 887 | 208.7 |
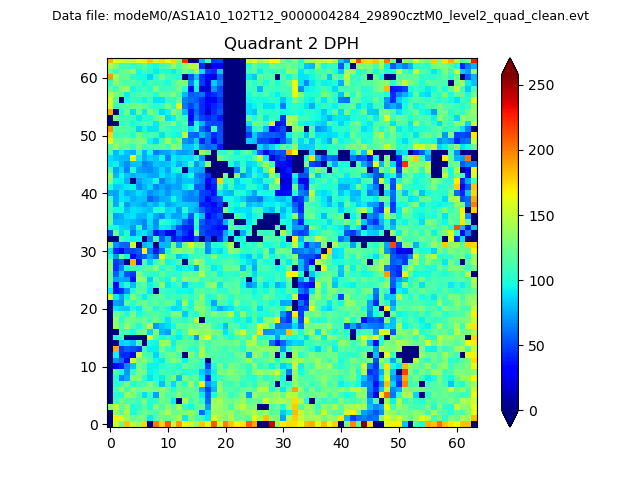
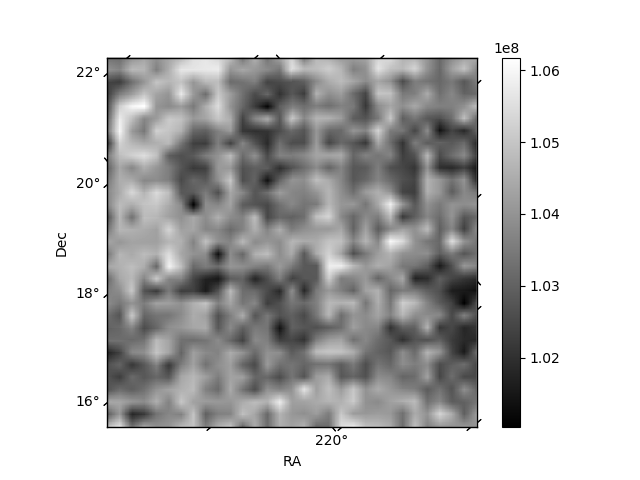
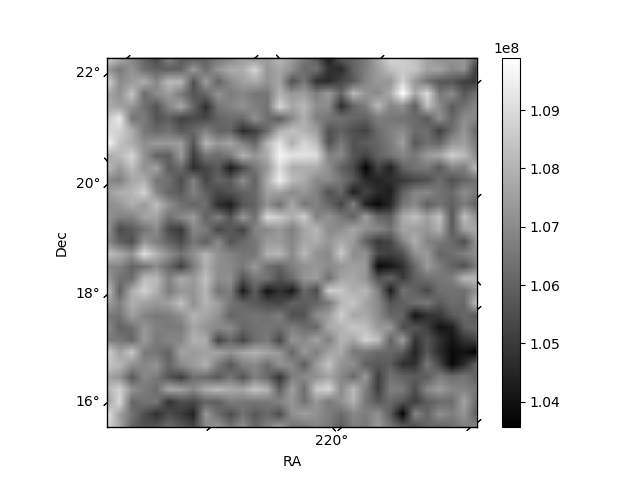
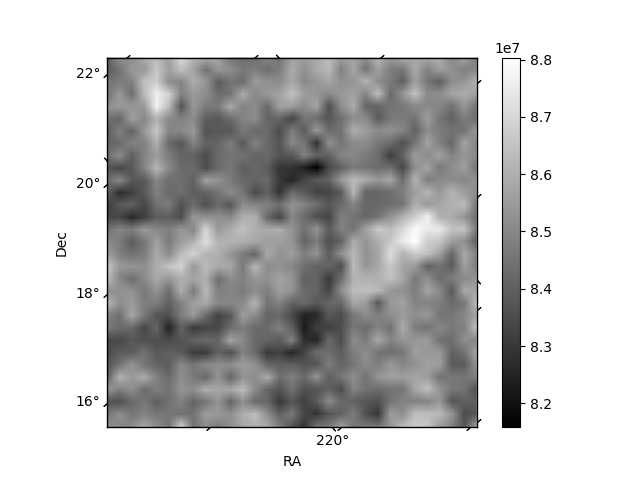
Histogram calculated using DETX and DETY for each event in the final _common_clean file
| Quadrant A | 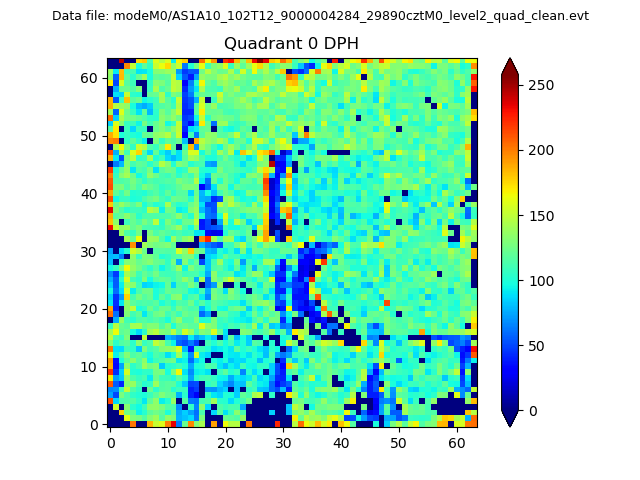 |
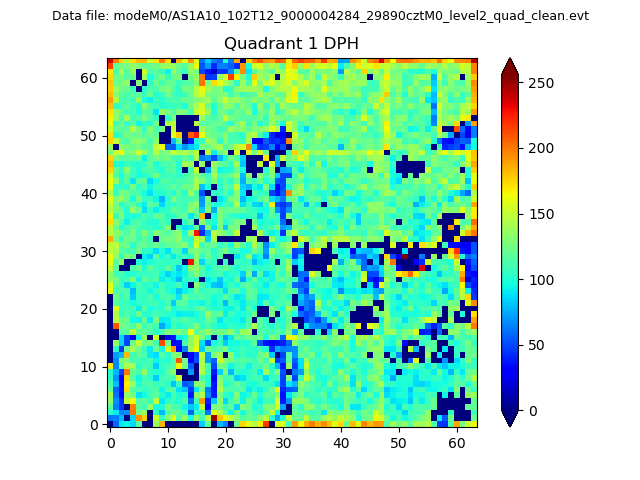 |
Quadrant B |
|---|---|---|---|
| Quadrant D | 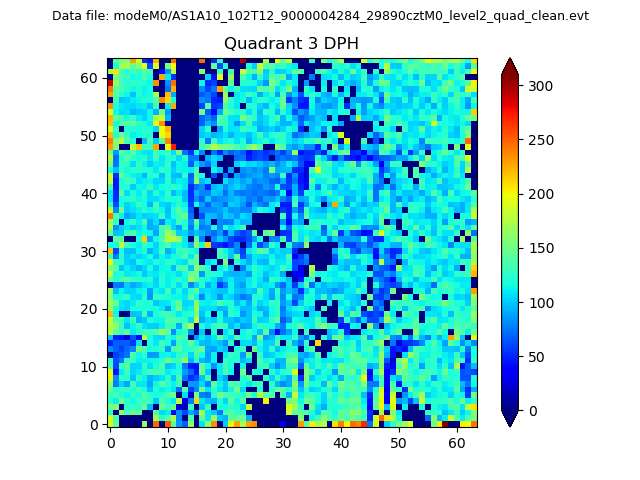 |
 |
Quadrant C |
| Plot type | Count rate plots | Images |
|---|---|---|
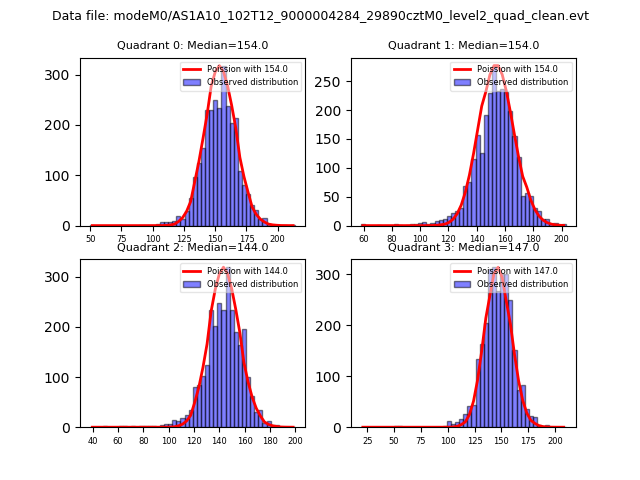
| Comparison with Poisson distribution Blue bars denote a histogram of data divided into 1 sec bins. Red curve is a Poisson curve with rate = median count rate of data. |
 |
 |
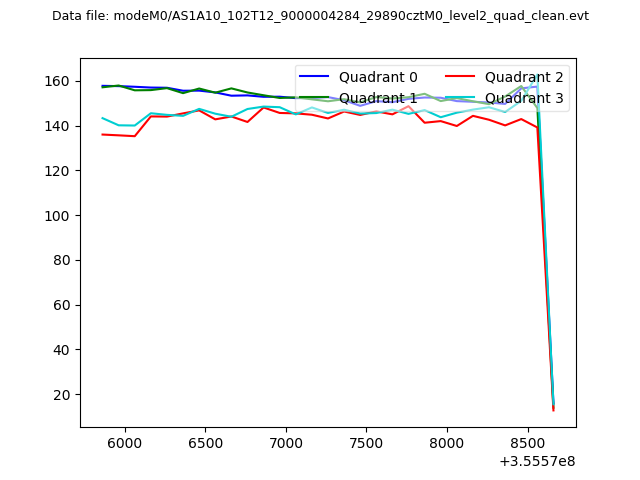
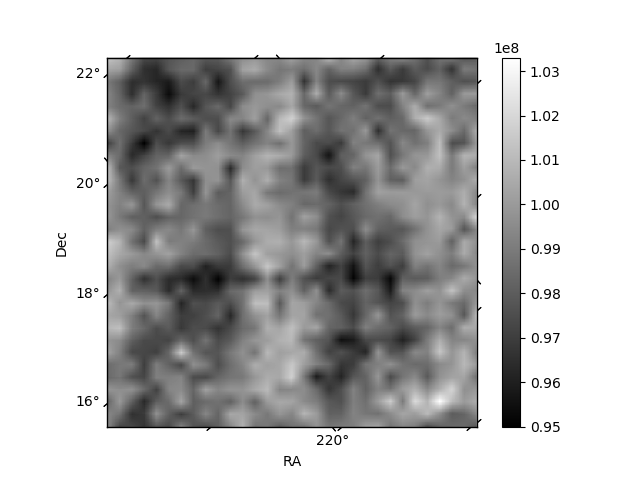
| Quadrant-wise count rates Data is divided into 100 sec bins |
 |
|
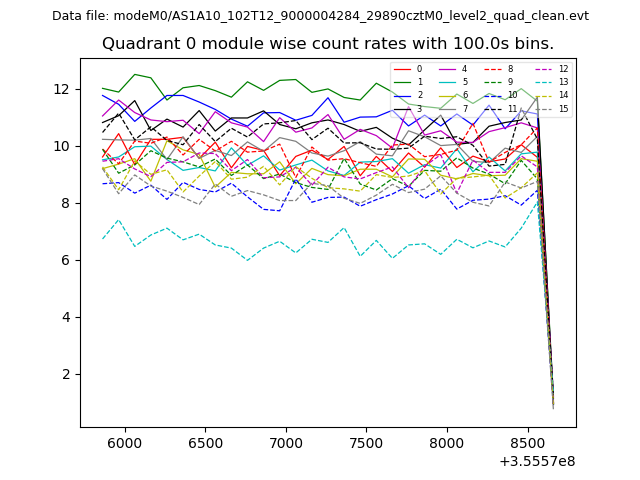
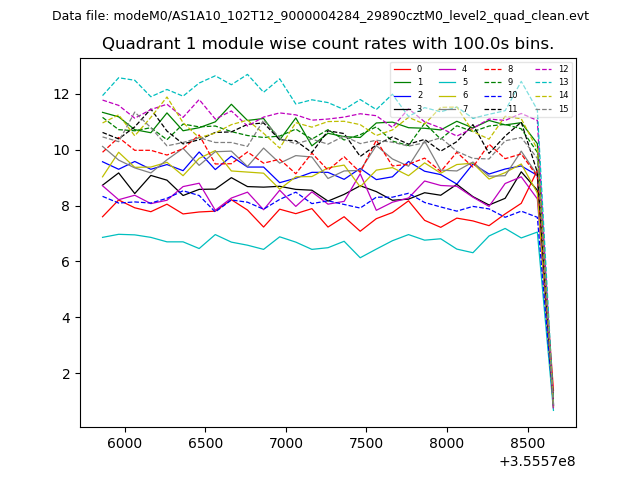
| Module-wise count rates for Quadrant A Data is divided into 100 sec bins |
 |
 |
| Module-wise count rates for Quadrant B Data is divided into 100 sec bins |
 |
 |
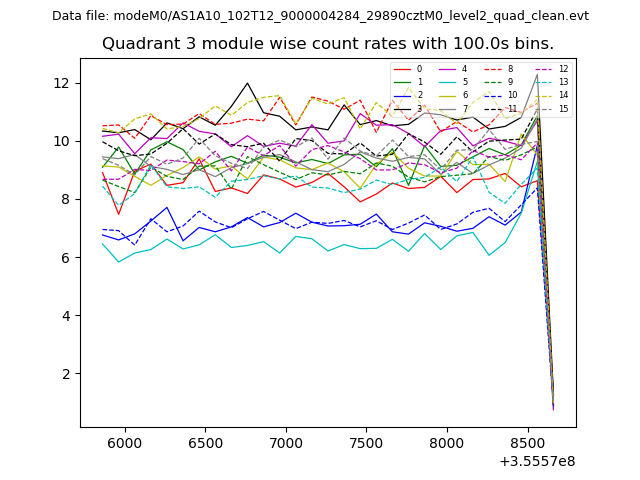
| Module-wise count rates for Quadrant C Data is divided into 100 sec bins |
 |
 |
| Module-wise count rates for Quadrant D Data is divided into 100 sec bins |
 |
 |
| Parameter | Plot |
|---|---|
| CZT HV Monitor |  |
| D_VDD | 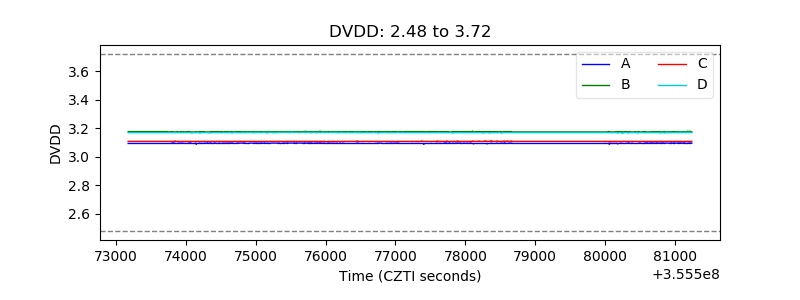 |
| Temperature 1 | 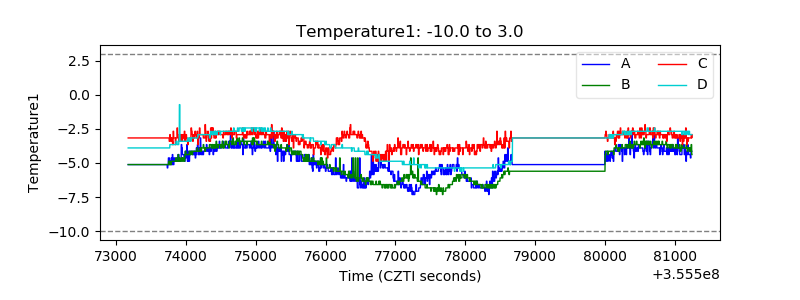 |
| Veto HV Monitor | 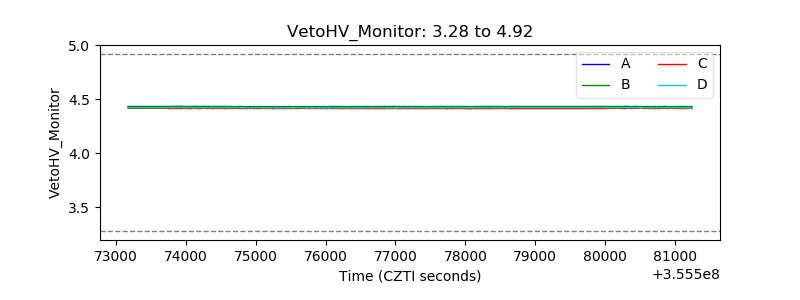 |
| Veto LLD | 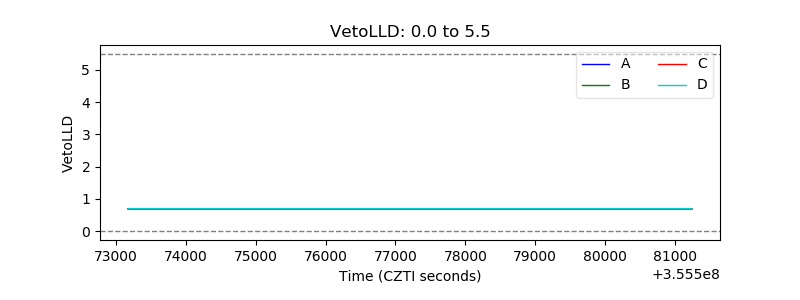 |
| Alpha Counter | 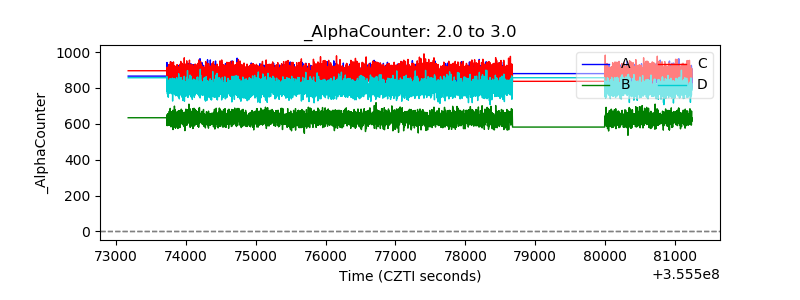 |
| _CPM_Rate | 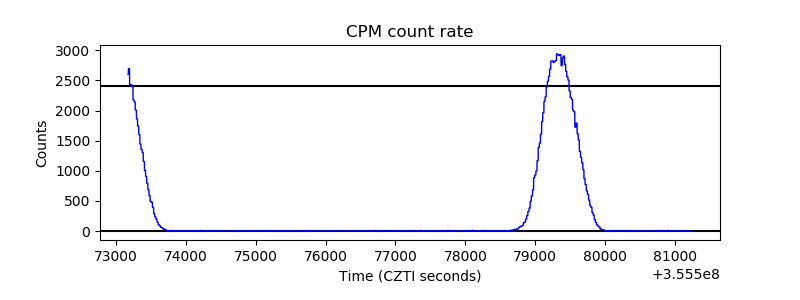 |
| CZT Counter | 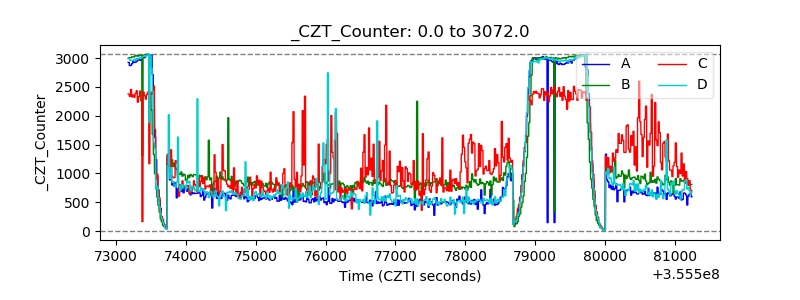 |
| +2.5 Volts monitor |  |
| +5 Volts monitor |  |
| _ROLL_ROT |  |
| _Roll_DEC | 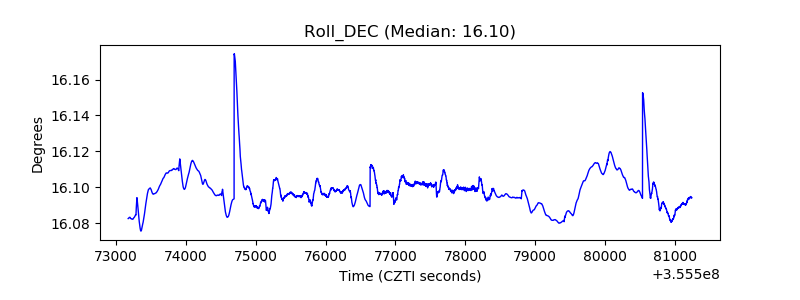 |
| _Roll_RA | 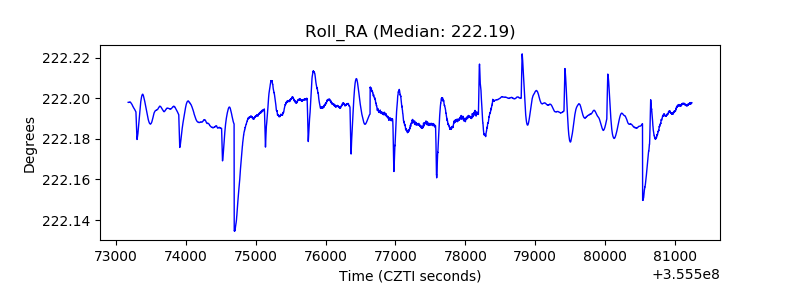 |
| Veto Counter | 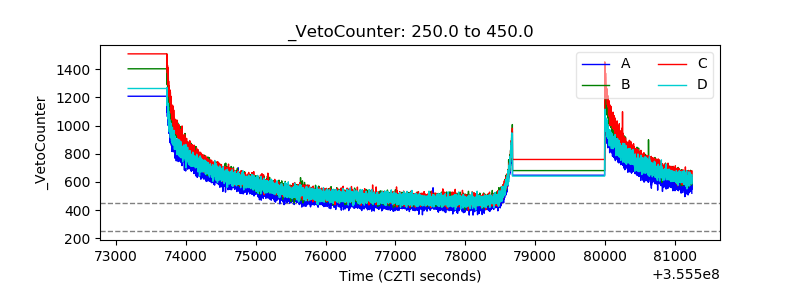 |