| Param | Original file | Final file |
|---|---|---|
| Filename | modeM0/AS1A10_102T12_9000004284_29891cztM0_level2.evt | modeM0/AS1A10_102T12_9000004284_29891cztM0_level2_quad_clean.evt |
| Size (bytes) | 640,517,760 | 78,721,920 |
| Size | 610.8 MB | 75.1 MB |
| Events in quadrant A | 3,661,594 | 500,612 |
| Events in quadrant B | 5,297,506 | 499,511 |
| Events in quadrant C | 5,983,096 | 475,285 |
| Events in quadrant D | 4,040,345 | 478,200 |
| Mode M9 | |||
|---|---|---|---|
| Quadrant | BADHDUFLAG | Total packets | Discarded packets |
| A | 0 | 19 | 0 |
| B | 0 | 20 | 0 |
| C | 0 | 20 | 0 |
| D | 0 | 20 | 0 |
| Mode M0 | |||
|---|---|---|---|
| Quadrant | BADHDUFLAG | Total packets | Discarded packets |
| A | 0 | 15028 | 2 |
| B | 0 | 19453 | 2 |
| C | 0 | 22414 | 2 |
| D | 0 | 16273 | 2 |
| Mode SS | |||
|---|---|---|---|
| Quadrant | BADHDUFLAG | Total packets | Discarded packets |
| A | 0 | 126 | 0 |
| B | 0 | 126 | 0 |
| C | 0 | 126 | 0 |
| D | 0 | 126 | 0 |
| Quadrant | Total seconds | Saturated seconds | Saturation percentage |
|---|---|---|---|
| A | 6160 | 108 | 1.753247% |
| B | 6160 | 177 | 2.873377% |
| C | 6160 | 505 | 8.198052% |
| D | 6160 | 70 | 1.136364% |
Noise dominated data is calculated using 1-second bins in cleaned event files. If a bin has >2000 counts, and if more than 50% of those come from <1% of pixels, then it is considered to be noise-dominated and hence unusable.
| Quadrant | # 1 sec bins | Bins with >0 counts | Bins with >2000 counts | High rate bins dominated by noise | Noise dominated (total time) | Noise dominated (detector-on time) | Marked lightcurve |
|---|---|---|---|---|---|---|---|
| A | 7535 | 6161 | 3 | 3 | 0.04% | 0.05% | 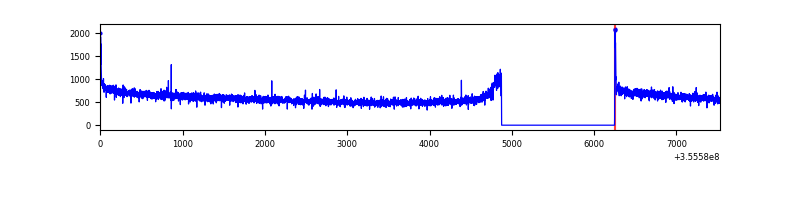 |
| B | 7535 | 6161 | 5 | 5 | 0.07% | 0.08% | 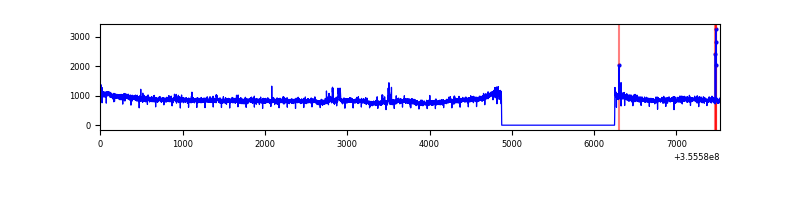 |
| C | 7535 | 6161 | 103 | 103 | 1.37% | 1.67% | 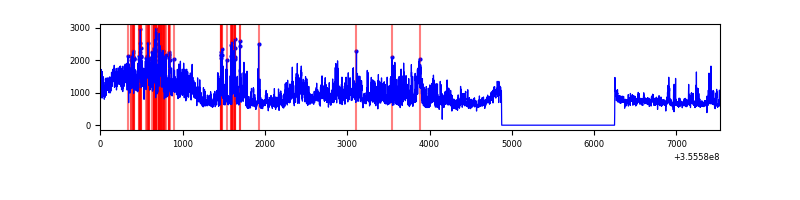 |
| D | 7535 | 6161 | 4 | 4 | 0.05% | 0.06% | 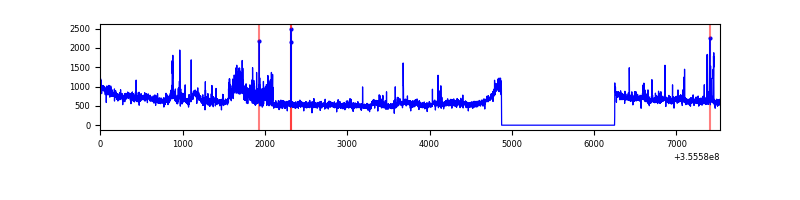 |
Top three noisy pixels from each quadrant. If the there are fewer than three noisy pixels in the level2.evt file, extra rows are filled as -1
| Pixel properties | Quadrant properties | ||||||
|---|---|---|---|---|---|---|---|
| Quadrant | DetID | PixID | Counts | Sigma | Mean | Median | Sigma |
| A | 1 | 113 | 67291 | 368.6 | 924 | 911 | 180.1 |
| A | 8 | 192 | 31247 | 168.45 | 924 | 911 | 180.1 |
| A | 13 | 254 | 10691 | 54.31 | 924 | 911 | 180.1 |
| B | 6 | 159 | 1658586 | 9767.14 | 912 | 893 | 169.7 |
| B | 0 | 229 | 60279 | 349.9 | 912 | 893 | 169.7 |
| B | 12 | 111 | 19895 | 111.96 | 912 | 893 | 169.7 |
| C | 3 | 233 | 1949798 | 9636.54 | 876 | 885 | 202.2 |
| C | 10 | 22 | 453607 | 2238.52 | 876 | 885 | 202.2 |
| C | 14 | 238 | 148830 | 731.52 | 876 | 885 | 202.2 |
| D | 8 | 195 | 323118 | 1535.43 | 902 | 881 | 209.9 |
| D | 13 | 104 | 185594 | 880.14 | 902 | 881 | 209.9 |
| D | 13 | 153 | 39254 | 182.84 | 902 | 881 | 209.9 |
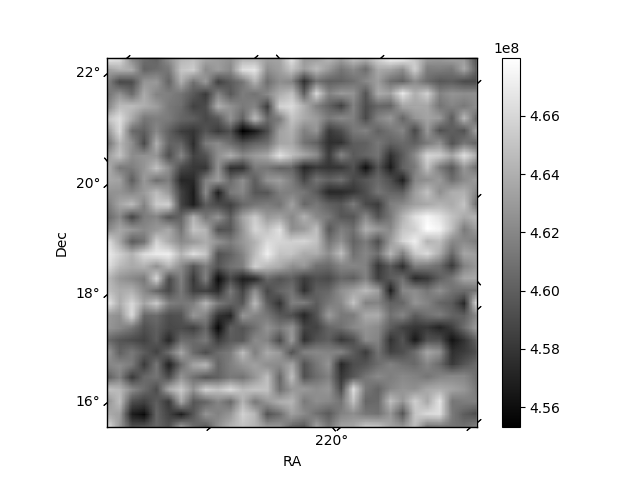
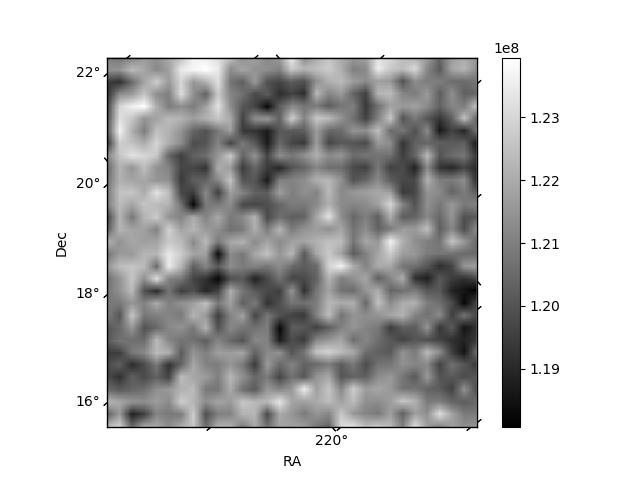
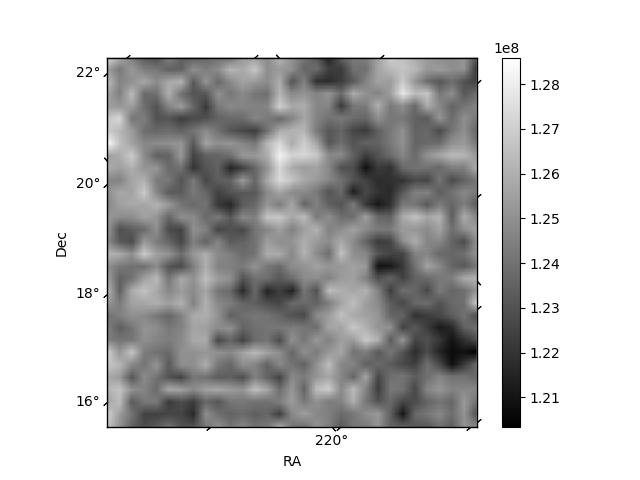
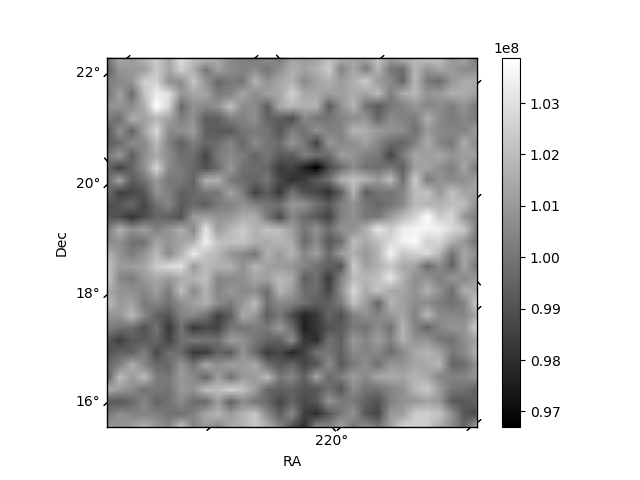
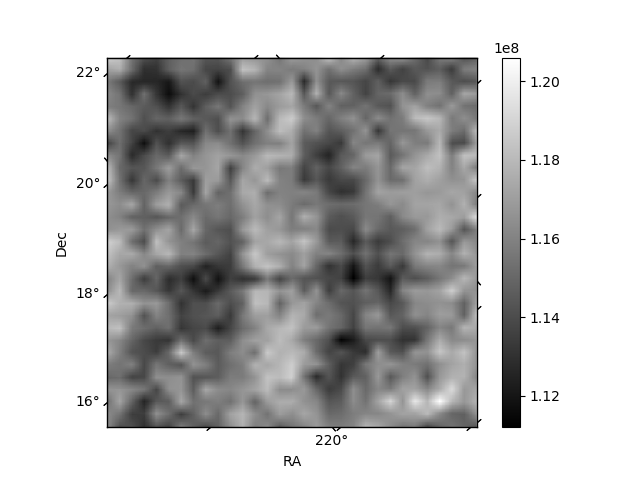
Histogram calculated using DETX and DETY for each event in the final _common_clean file
| Quadrant A | 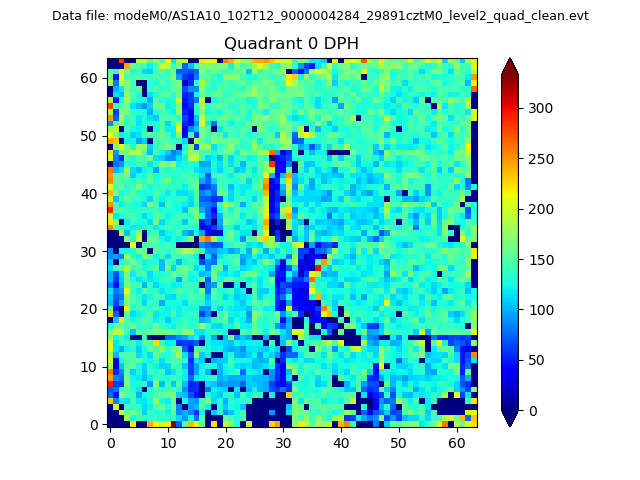 |
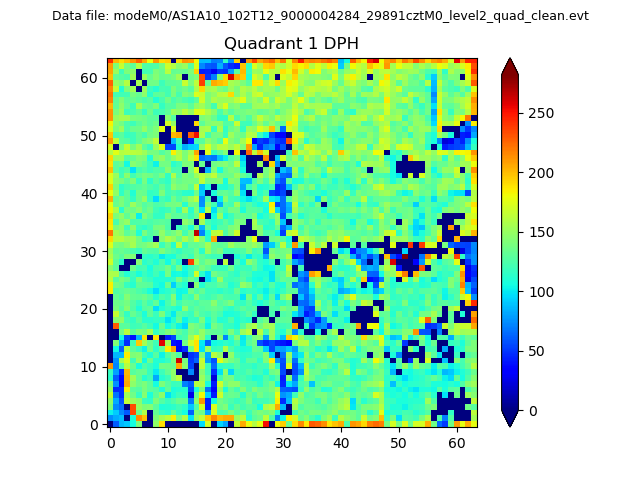 |
Quadrant B |
|---|---|---|---|
| Quadrant D | 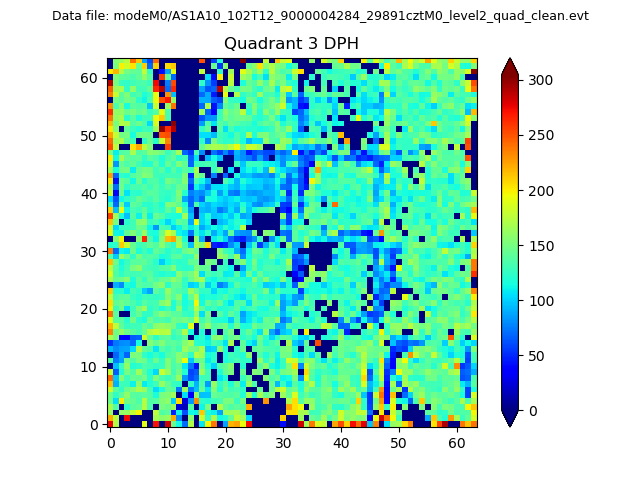 |
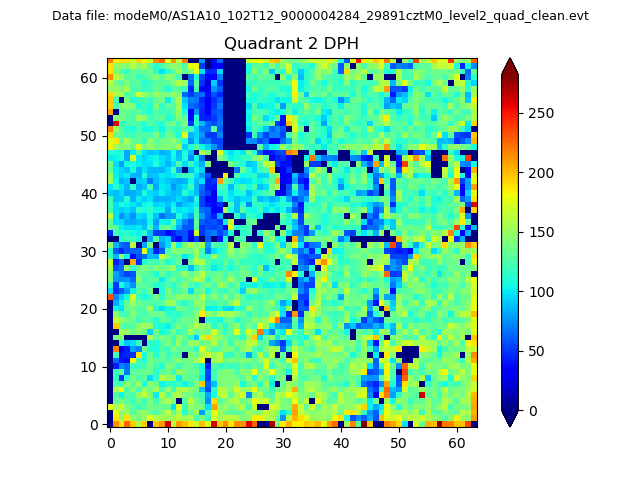 |
Quadrant C |
| Plot type | Count rate plots | Images |
|---|---|---|
| Comparison with Poisson distribution Blue bars denote a histogram of data divided into 1 sec bins. Red curve is a Poisson curve with rate = median count rate of data. |
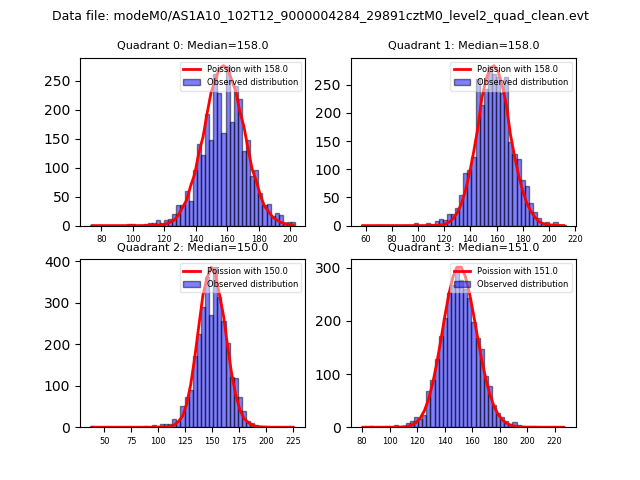 |
 |
| Quadrant-wise count rates Data is divided into 100 sec bins |
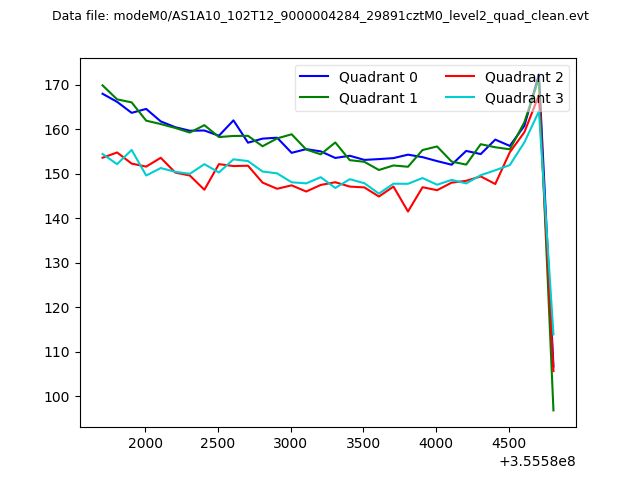 |
|
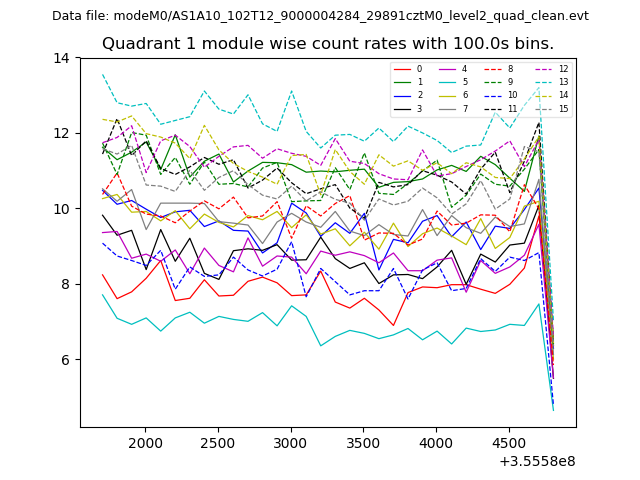
| Module-wise count rates for Quadrant A Data is divided into 100 sec bins |
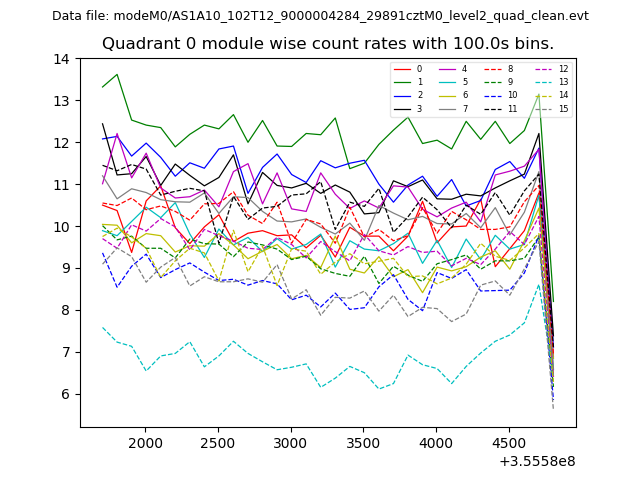 |
 |
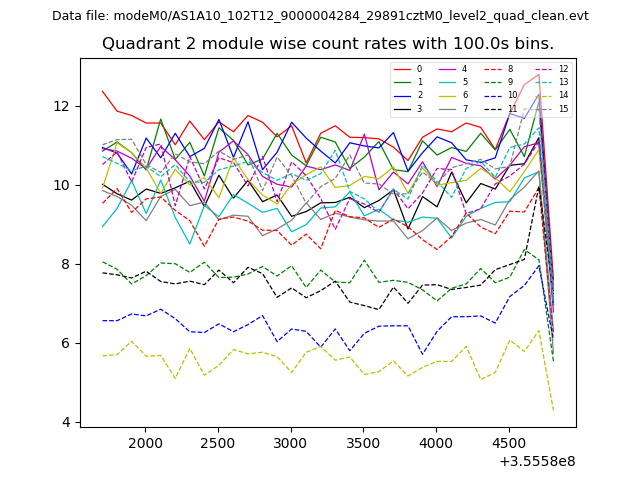
| Module-wise count rates for Quadrant B Data is divided into 100 sec bins |
 |
 |
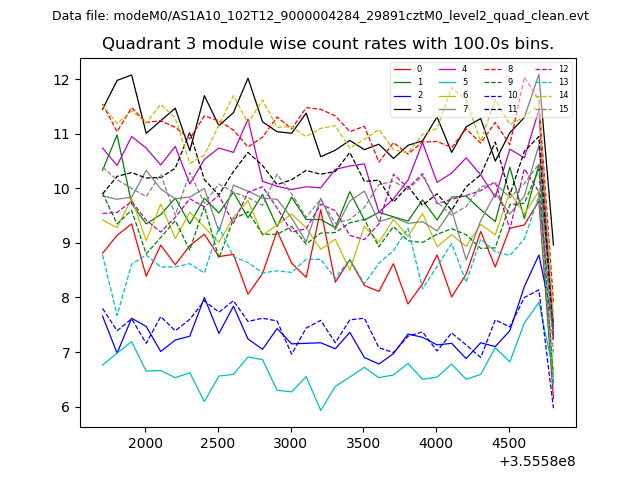
| Module-wise count rates for Quadrant C Data is divided into 100 sec bins |
 |
 |
| Module-wise count rates for Quadrant D Data is divided into 100 sec bins |
 |
 |
| Parameter | Plot |
|---|---|
| CZT HV Monitor |  |
| D_VDD |  |
| Temperature 1 | 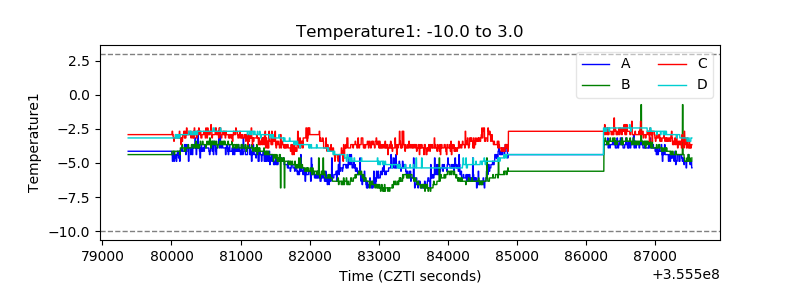 |
| Veto HV Monitor |  |
| Veto LLD | 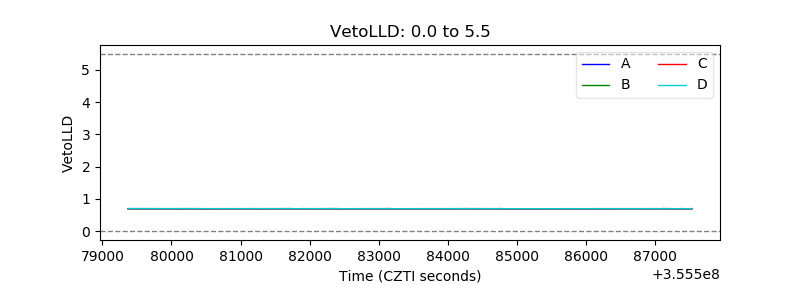 |
| Alpha Counter | 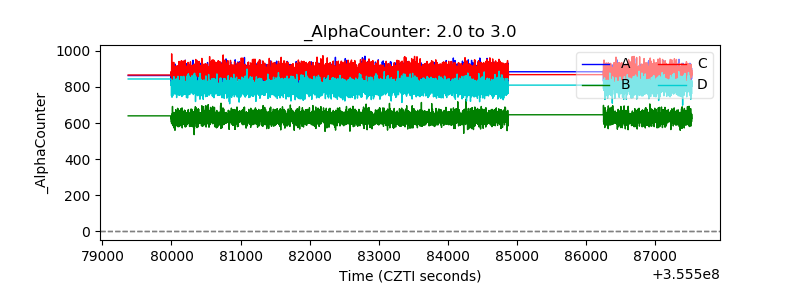 |
| _CPM_Rate | 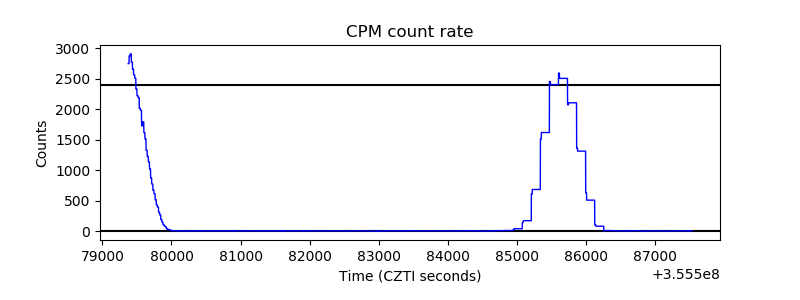 |
| CZT Counter | 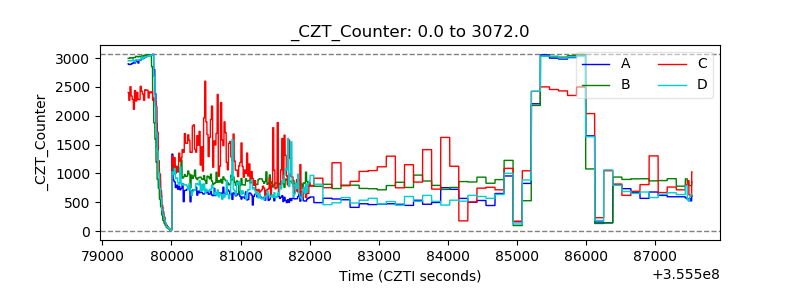 |
| +2.5 Volts monitor |  |
| +5 Volts monitor |  |
| _ROLL_ROT | 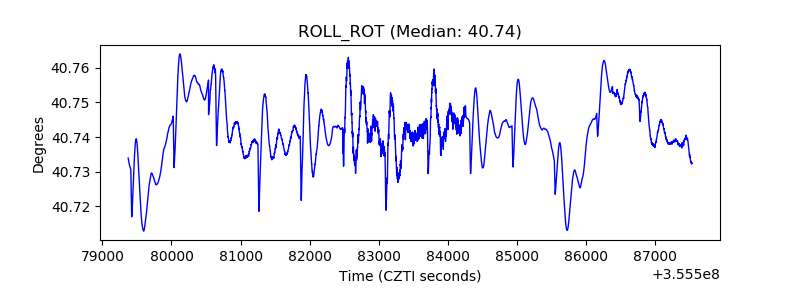 |
| _Roll_DEC | 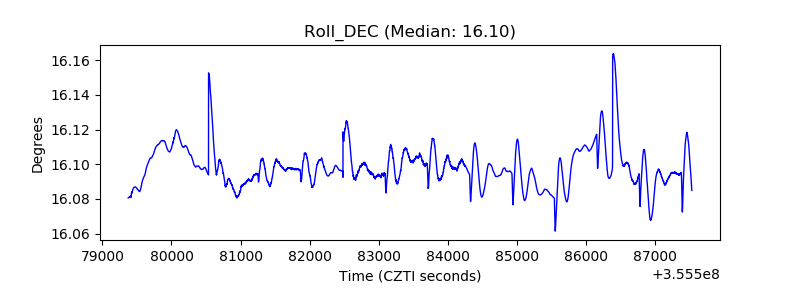 |
| _Roll_RA | 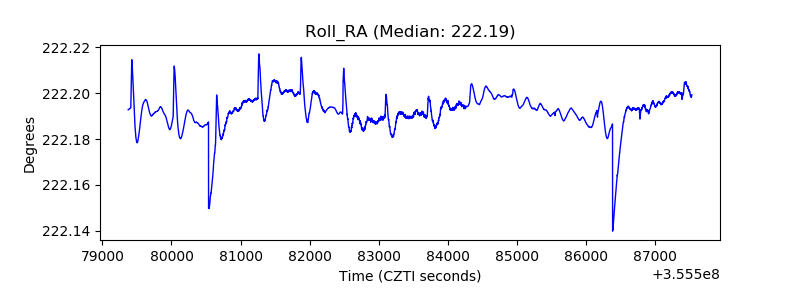 |
| Veto Counter | 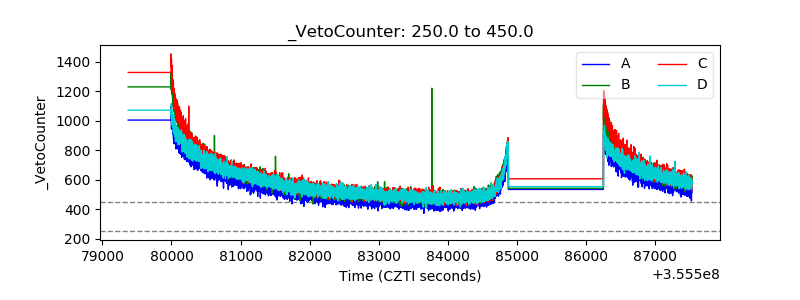 |