| Param | Original file | Final file |
|---|---|---|
| Filename | modeM0/AS1A10_102T12_9000004284_29892cztM0_level2.evt | modeM0/AS1A10_102T12_9000004284_29892cztM0_level2_quad_clean.evt |
| Size (bytes) | 592,652,160 | 96,001,920 |
| Size | 565.2 MB | 91.6 MB |
| Events in quadrant A | 3,535,329 | 626,678 |
| Events in quadrant B | 5,346,106 | 630,830 |
| Events in quadrant C | 4,460,141 | 612,511 |
| Events in quadrant D | 4,181,131 | 597,573 |
| Mode M9 | |||
|---|---|---|---|
| Quadrant | BADHDUFLAG | Total packets | Discarded packets |
| A | 0 | 13 | 0 |
| B | 0 | 13 | 0 |
| C | 0 | 13 | 0 |
| D | 0 | 13 | 0 |
| Mode M0 | |||
|---|---|---|---|
| Quadrant | BADHDUFLAG | Total packets | Discarded packets |
| A | 0 | 14521 | 2 |
| B | 0 | 19639 | 2 |
| C | 0 | 17814 | 2 |
| D | 0 | 16795 | 2 |
| Mode SS | |||
|---|---|---|---|
| Quadrant | BADHDUFLAG | Total packets | Discarded packets |
| A | 0 | 128 | 0 |
| B | 0 | 128 | 0 |
| C | 0 | 128 | 0 |
| D | 0 | 128 | 0 |
| Quadrant | Total seconds | Saturated seconds | Saturation percentage |
|---|---|---|---|
| A | 6300 | 113 | 1.793651% |
| B | 6301 | 206 | 3.269322% |
| C | 6301 | 243 | 3.856531% |
| D | 6301 | 159 | 2.523409% |
Noise dominated data is calculated using 1-second bins in cleaned event files. If a bin has >2000 counts, and if more than 50% of those come from <1% of pixels, then it is considered to be noise-dominated and hence unusable.
| Quadrant | # 1 sec bins | Bins with >0 counts | Bins with >2000 counts | High rate bins dominated by noise | Noise dominated (total time) | Noise dominated (detector-on time) | Marked lightcurve |
|---|---|---|---|---|---|---|---|
| A | 7595 | 6302 | 4 | 4 | 0.05% | 0.06% | 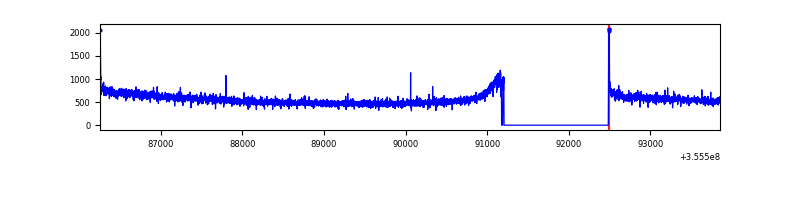 |
| B | 7596 | 6303 | 13 | 13 | 0.17% | 0.21% | 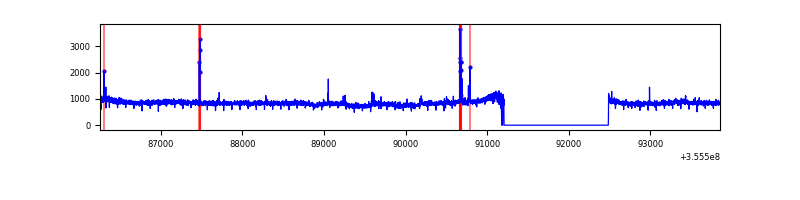 |
| C | 7596 | 6303 | 3 | 3 | 0.04% | 0.05% | 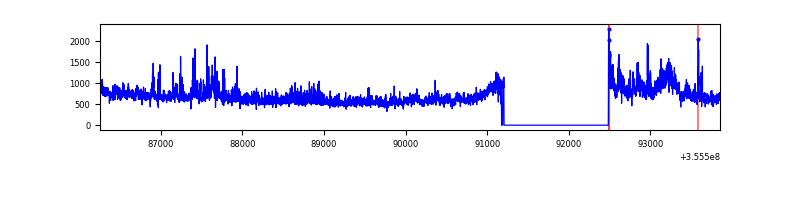 |
| D | 7596 | 6303 | 53 | 53 | 0.70% | 0.84% | 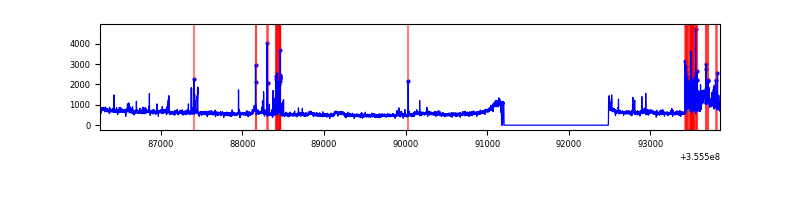 |
Top three noisy pixels from each quadrant. If the there are fewer than three noisy pixels in the level2.evt file, extra rows are filled as -1
| Pixel properties | Quadrant properties | ||||||
|---|---|---|---|---|---|---|---|
| Quadrant | DetID | PixID | Counts | Sigma | Mean | Median | Sigma |
| A | 8 | 192 | 26045 | 140.37 | 905 | 890 | 179.2 |
| A | 1 | 113 | 18627 | 98.98 | 905 | 890 | 179.2 |
| A | 13 | 254 | 10868 | 55.68 | 905 | 890 | 179.2 |
| B | 6 | 159 | 1746814 | 10391.7 | 895 | 874 | 168.0 |
| B | 0 | 229 | 83708 | 493.02 | 895 | 874 | 168.0 |
| B | 12 | 111 | 20151 | 114.74 | 895 | 874 | 168.0 |
| C | 3 | 233 | 690704 | 3406.7 | 879 | 887 | 202.5 |
| C | 10 | 22 | 186340 | 915.87 | 879 | 887 | 202.5 |
| C | 14 | 238 | 145846 | 715.89 | 879 | 887 | 202.5 |
| D | 8 | 195 | 339871 | 1636.22 | 887 | 867 | 207.2 |
| D | 7 | 80 | 235812 | 1133.97 | 887 | 867 | 207.2 |
| D | 1 | 52 | 72667 | 346.55 | 887 | 867 | 207.2 |
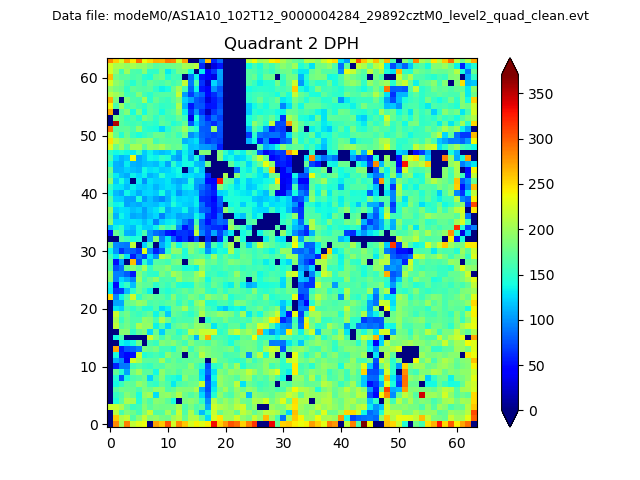
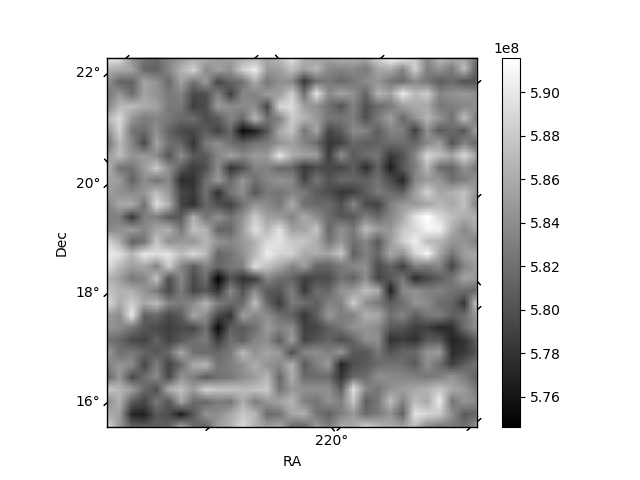
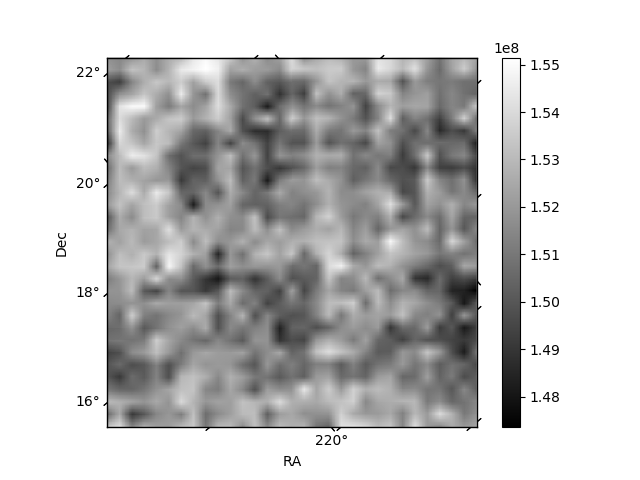
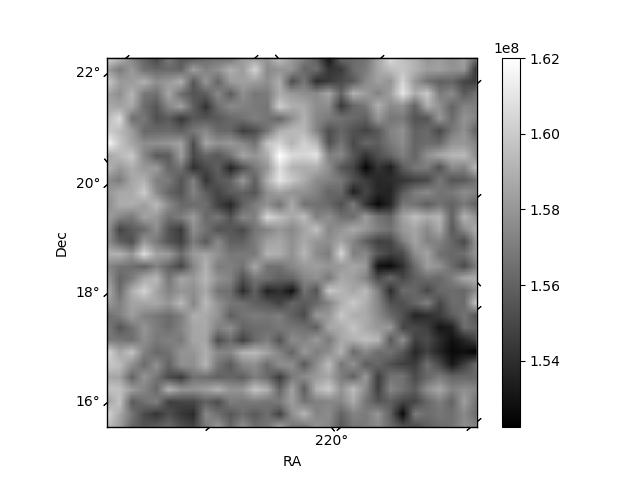
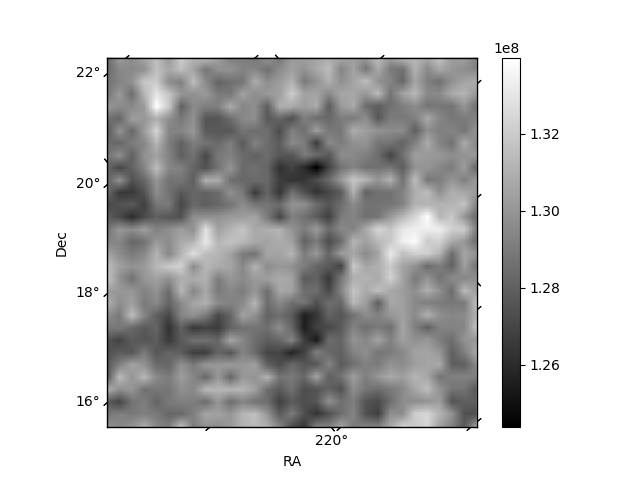
Histogram calculated using DETX and DETY for each event in the final _common_clean file
| Quadrant A | 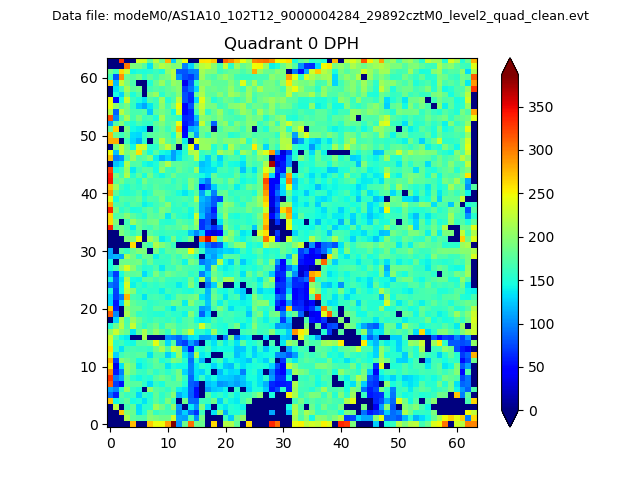 |
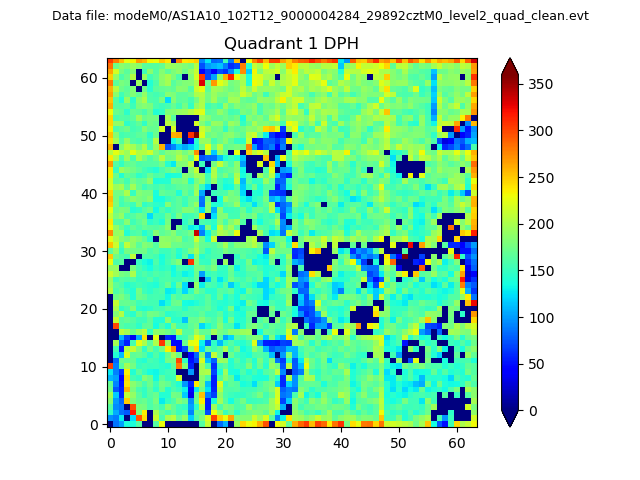 |
Quadrant B |
|---|---|---|---|
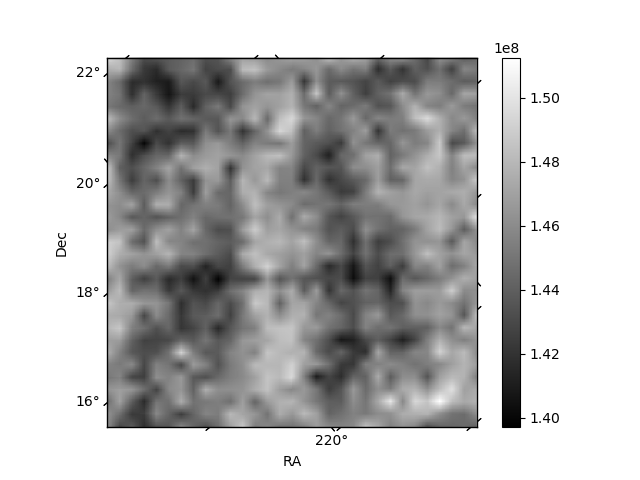
| Quadrant D | 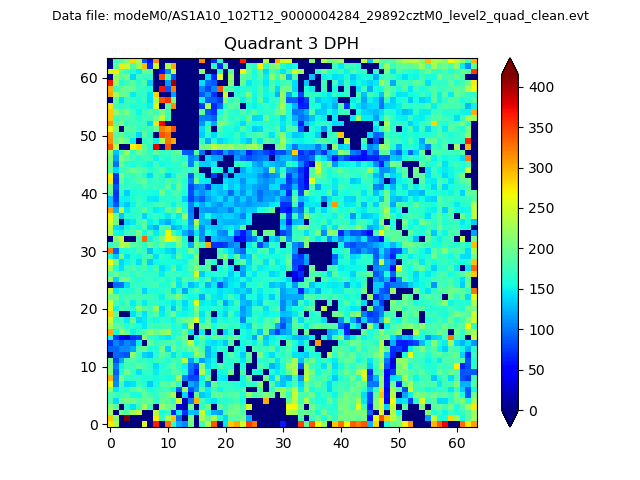 |
 |
Quadrant C |
| Plot type | Count rate plots | Images |
|---|---|---|
| Comparison with Poisson distribution Blue bars denote a histogram of data divided into 1 sec bins. Red curve is a Poisson curve with rate = median count rate of data. |
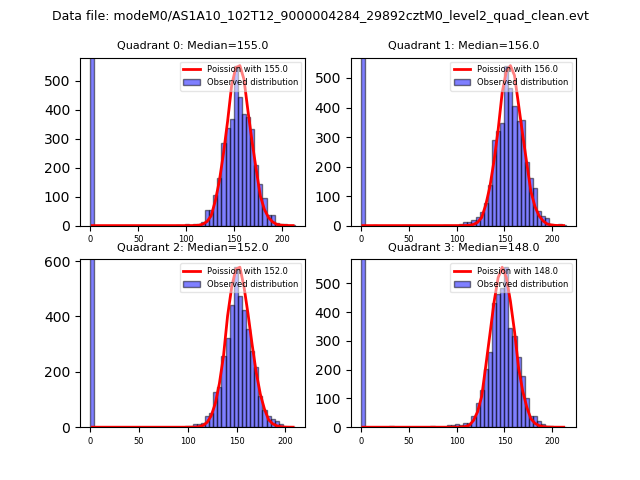 |
 |
| Quadrant-wise count rates Data is divided into 100 sec bins |
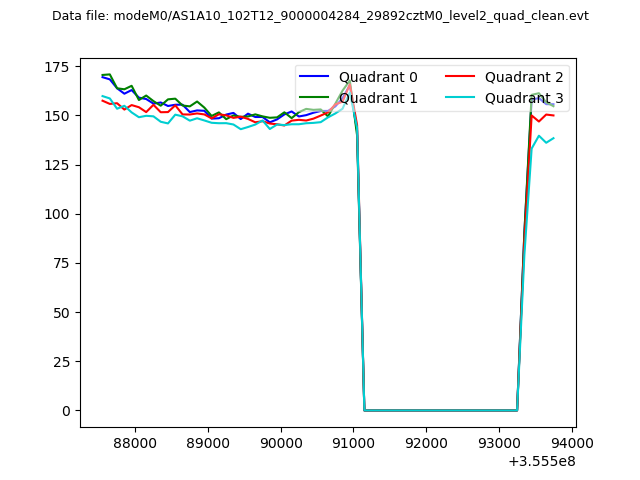 |
|
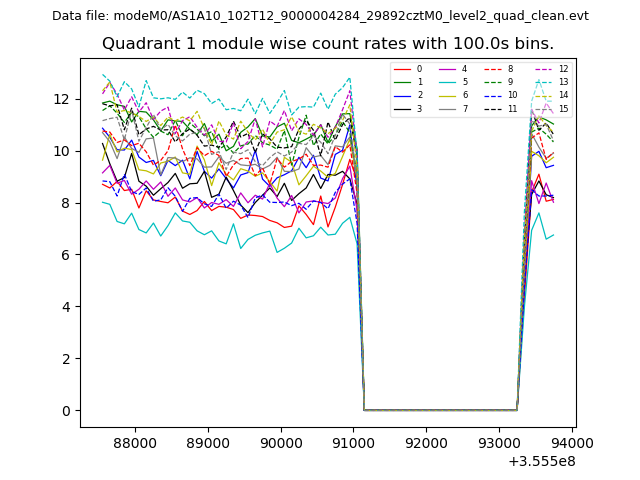
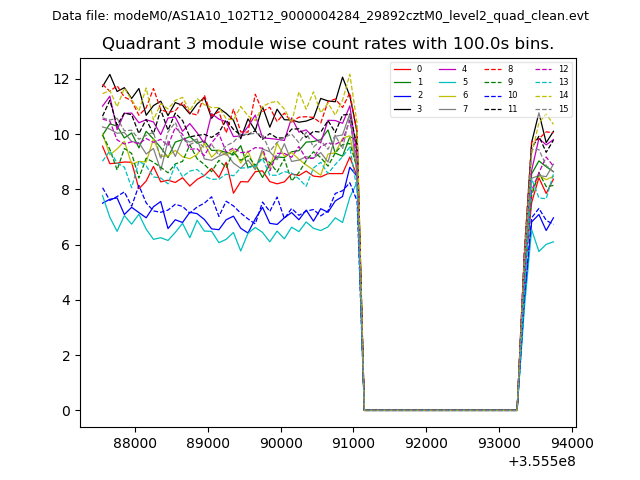
| Module-wise count rates for Quadrant A Data is divided into 100 sec bins |
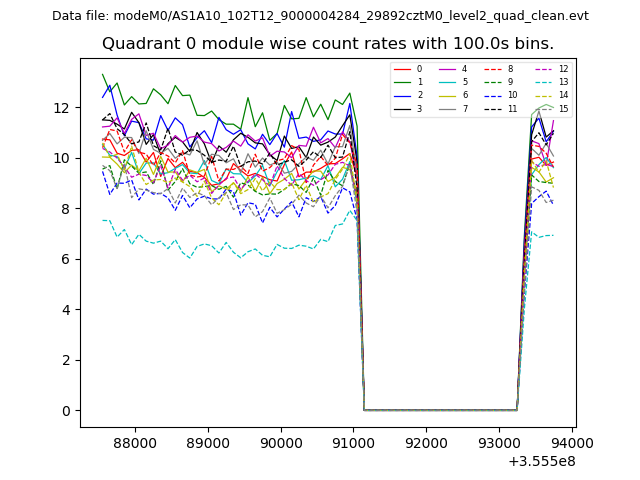 |
 |
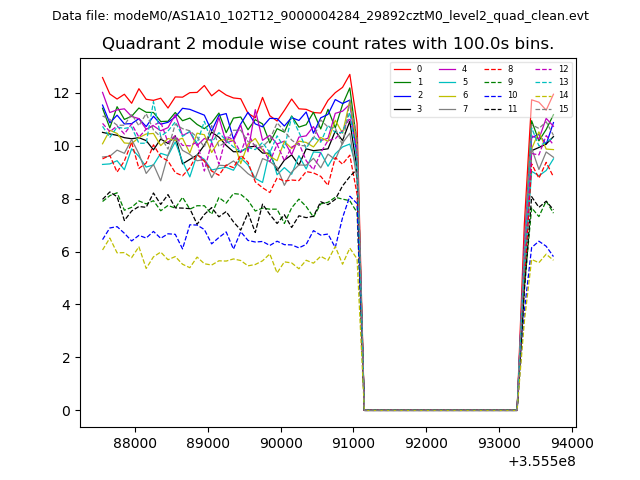
| Module-wise count rates for Quadrant B Data is divided into 100 sec bins |
 |
 |
| Module-wise count rates for Quadrant C Data is divided into 100 sec bins |
 |
 |
| Module-wise count rates for Quadrant D Data is divided into 100 sec bins |
 |
 |
| Parameter | Plot |
|---|---|
| CZT HV Monitor | 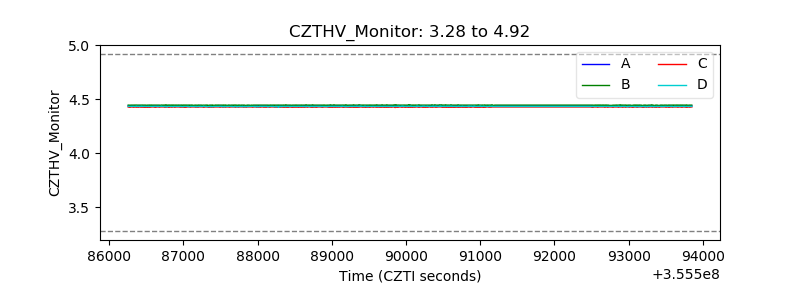 |
| D_VDD |  |
| Temperature 1 | 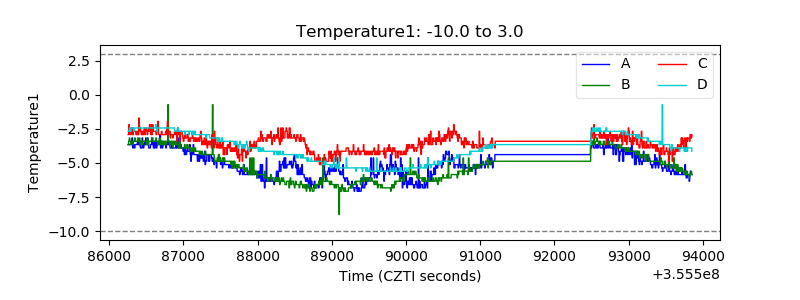 |
| Veto HV Monitor | 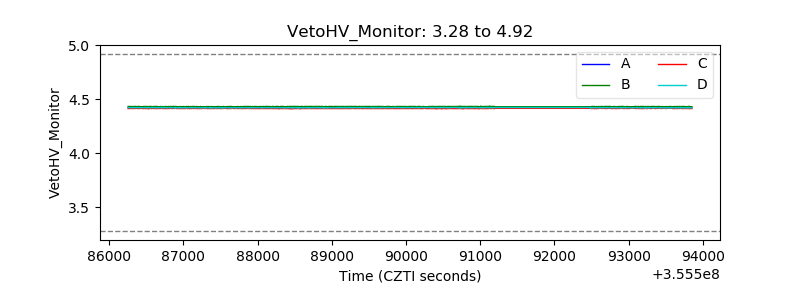 |
| Veto LLD | 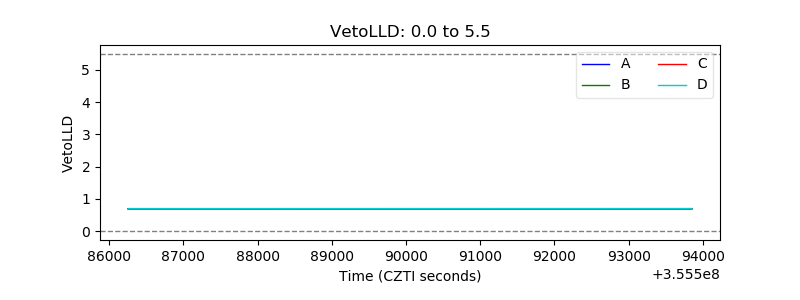 |
| Alpha Counter | 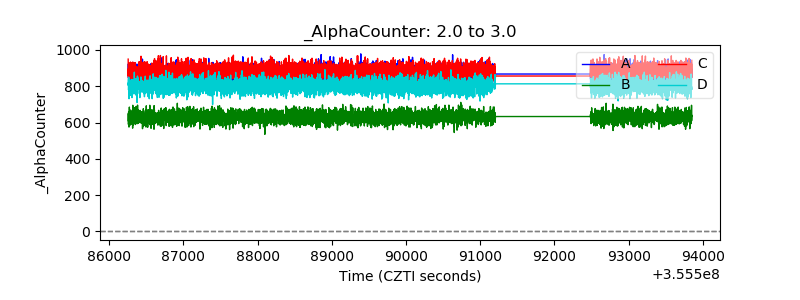 |
| _CPM_Rate |  |
| CZT Counter | 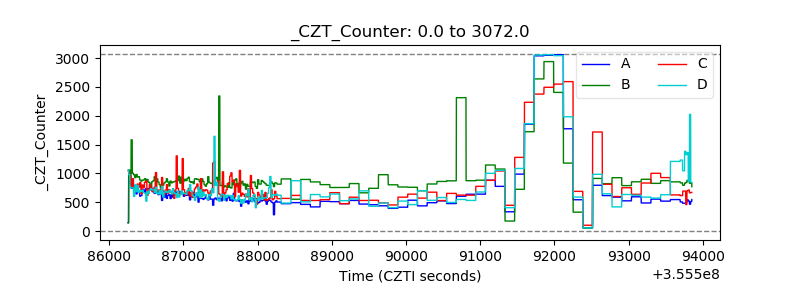 |
| +2.5 Volts monitor |  |
| +5 Volts monitor |  |
| _ROLL_ROT | 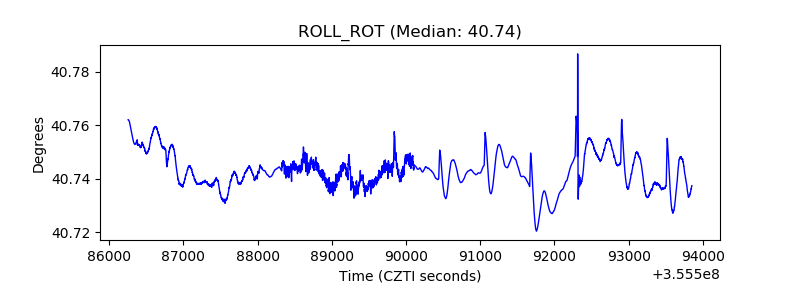 |
| _Roll_DEC | 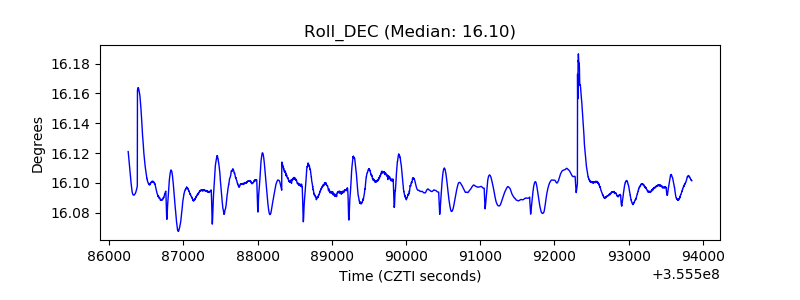 |
| _Roll_RA | 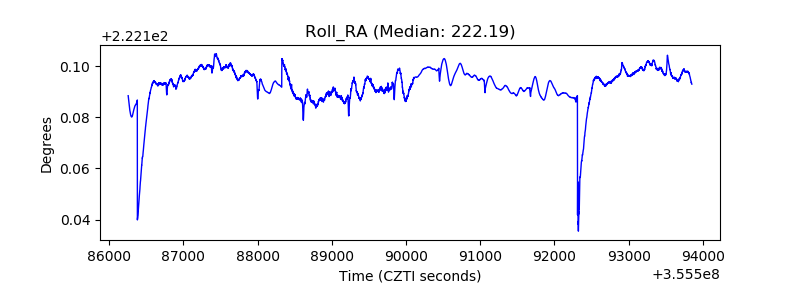 |
| Veto Counter | 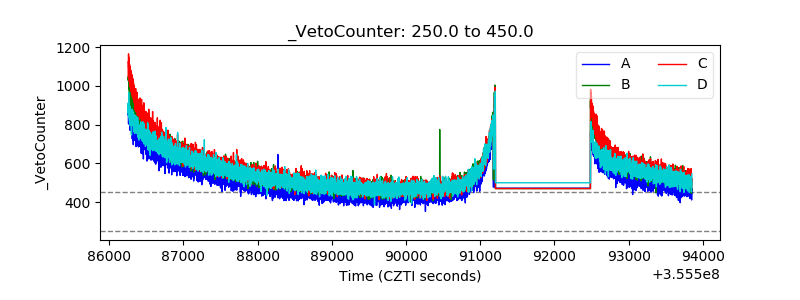 |