| Param | Original file | Final file |
|---|---|---|
| Filename | modeM0/AS1A10_102T12_9000004284_29894cztM0_level2.evt | modeM0/AS1A10_102T12_9000004284_29894cztM0_level2_quad_clean.evt |
| Size (bytes) | 709,090,560 | 101,453,760 |
| Size | 676.2 MB | 96.8 MB |
| Events in quadrant A | 3,535,483 | 672,941 |
| Events in quadrant B | 5,567,557 | 674,268 |
| Events in quadrant C | 5,499,120 | 638,036 |
| Events in quadrant D | 6,395,189 | 594,605 |
| Mode M9 | |||
|---|---|---|---|
| Quadrant | BADHDUFLAG | Total packets | Discarded packets |
| A | 0 | 18 | 0 |
| B | 0 | 18 | 0 |
| C | 0 | 18 | 0 |
| D | 0 | 18 | 0 |
| Mode M0 | |||
|---|---|---|---|
| Quadrant | BADHDUFLAG | Total packets | Discarded packets |
| A | 0 | 14838 | 2 |
| B | 0 | 21356 | 2 |
| C | 0 | 21382 | 2 |
| D | 0 | 23866 | 2 |
| Mode SS | |||
|---|---|---|---|
| Quadrant | BADHDUFLAG | Total packets | Discarded packets |
| A | 0 | 144 | 0 |
| B | 0 | 144 | 0 |
| C | 0 | 144 | 0 |
| D | 0 | 144 | 0 |
| Quadrant | Total seconds | Saturated seconds | Saturation percentage |
|---|---|---|---|
| A | 7073 | 72 | 1.017956% |
| B | 7073 | 120 | 1.696593% |
| C | 7074 | 824 | 11.648290% |
| D | 7073 | 953 | 13.473774% |
Noise dominated data is calculated using 1-second bins in cleaned event files. If a bin has >2000 counts, and if more than 50% of those come from <1% of pixels, then it is considered to be noise-dominated and hence unusable.
| Quadrant | # 1 sec bins | Bins with >0 counts | Bins with >2000 counts | High rate bins dominated by noise | Noise dominated (total time) | Noise dominated (detector-on time) | Marked lightcurve |
|---|---|---|---|---|---|---|---|
| A | 8823 | 7075 | 3 | 3 | 0.03% | 0.04% |  |
| B | 8823 | 7075 | 0 | 0 | 0.00% | 0.00% |  |
| C | 8824 | 7076 | 44 | 44 | 0.50% | 0.62% |  |
| D | 8823 | 7075 | 723 | 723 | 8.19% | 10.22% |  |
Top three noisy pixels from each quadrant. If the there are fewer than three noisy pixels in the level2.evt file, extra rows are filled as -1
| Pixel properties | Quadrant properties | ||||||
|---|---|---|---|---|---|---|---|
| Quadrant | DetID | PixID | Counts | Sigma | Mean | Median | Sigma |
| A | 8 | 192 | 32321 | 172.28 | 904 | 887 | 182.5 |
| A | 13 | 254 | 12625 | 64.33 | 904 | 887 | 182.5 |
| A | 3 | 137 | 9183 | 45.47 | 904 | 887 | 182.5 |
| B | 6 | 159 | 2047370 | 11828.2 | 895 | 872 | 173.0 |
| B | 12 | 111 | 21497 | 119.21 | 895 | 872 | 173.0 |
| B | 11 | 111 | 19717 | 108.92 | 895 | 872 | 173.0 |
| C | 3 | 233 | 1308496 | 6606.18 | 846 | 853 | 197.9 |
| C | 10 | 22 | 394706 | 1989.74 | 846 | 853 | 197.9 |
| C | 14 | 238 | 272352 | 1371.61 | 846 | 853 | 197.9 |
| D | 12 | 2 | 1816392 | 9125.69 | 835 | 814 | 199.0 |
| D | 7 | 238 | 507917 | 2548.87 | 835 | 814 | 199.0 |
| D | 7 | 80 | 397516 | 1993.95 | 835 | 814 | 199.0 |
Histogram calculated using DETX and DETY for each event in the final _common_clean file
| Quadrant A |  |
 |
Quadrant B |
|---|---|---|---|
| Quadrant D |  |
 |
Quadrant C |
| Plot type | Count rate plots | Images |
|---|---|---|
| Comparison with Poisson distribution Blue bars denote a histogram of data divided into 1 sec bins. Red curve is a Poisson curve with rate = median count rate of data. |
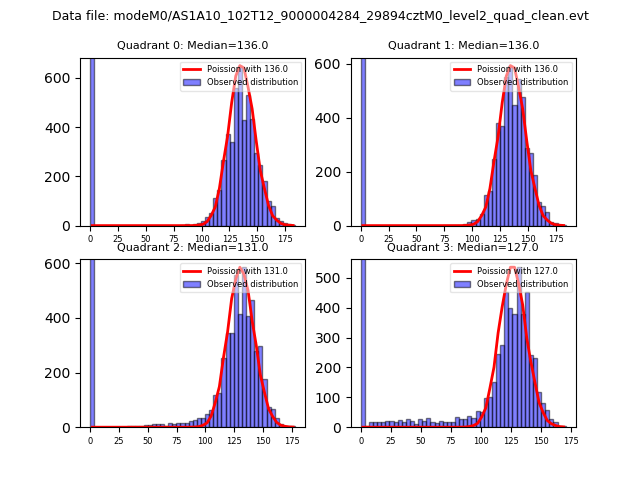 |
 |
| Quadrant-wise count rates Data is divided into 100 sec bins |
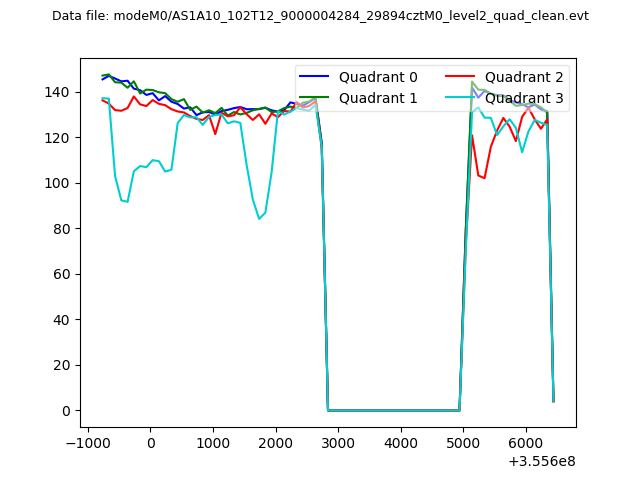 |
|
| Module-wise count rates for Quadrant A Data is divided into 100 sec bins |
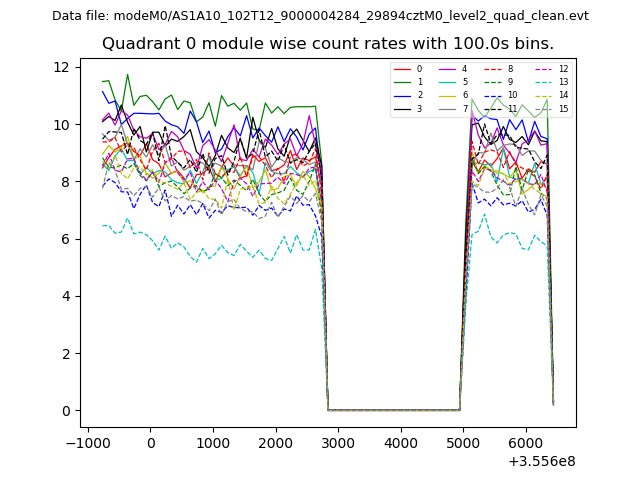 |
 |
| Module-wise count rates for Quadrant B Data is divided into 100 sec bins |
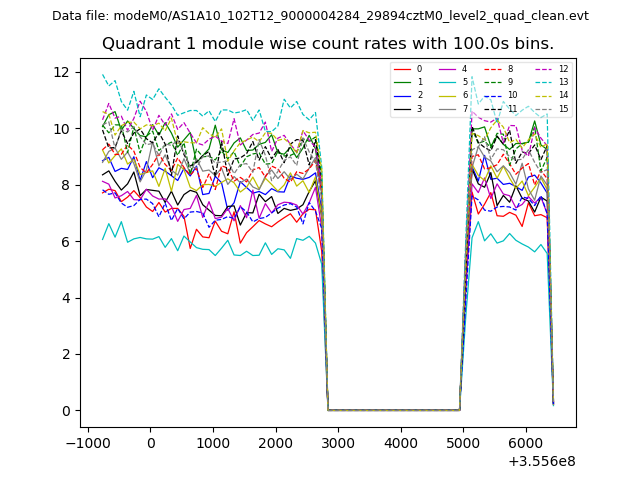 |
 |
| Module-wise count rates for Quadrant C Data is divided into 100 sec bins |
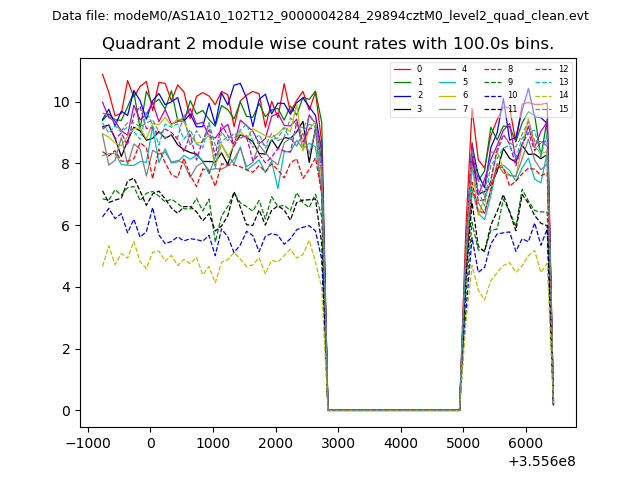 |
 |
| Module-wise count rates for Quadrant D Data is divided into 100 sec bins |
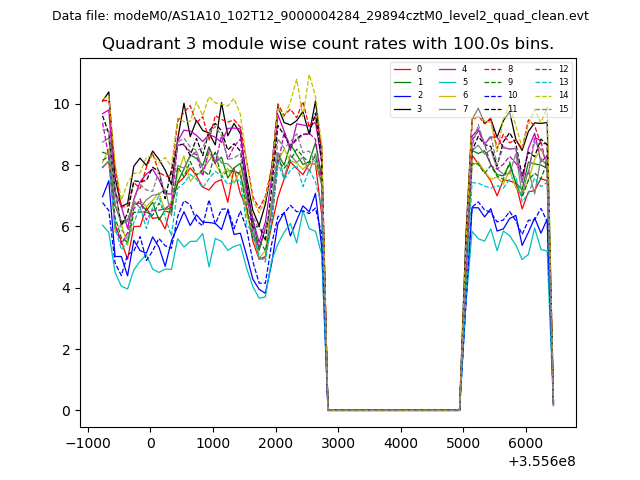 |
 |
| Parameter | Plot |
|---|---|
| CZT HV Monitor | 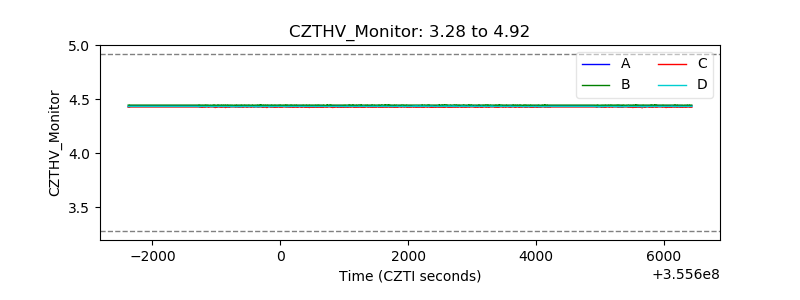 |
| D_VDD |  |
| Temperature 1 |  |
| Veto HV Monitor |  |
| Veto LLD |  |
| Alpha Counter | 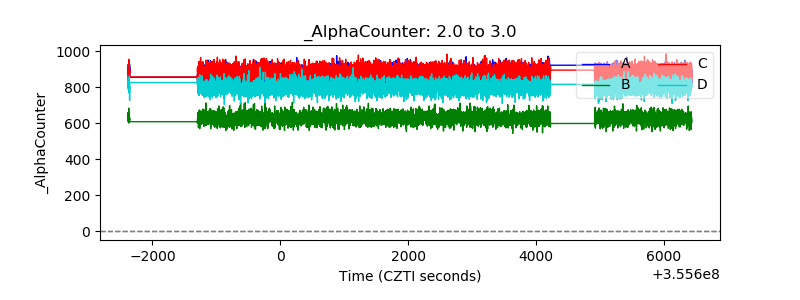 |
| _CPM_Rate | 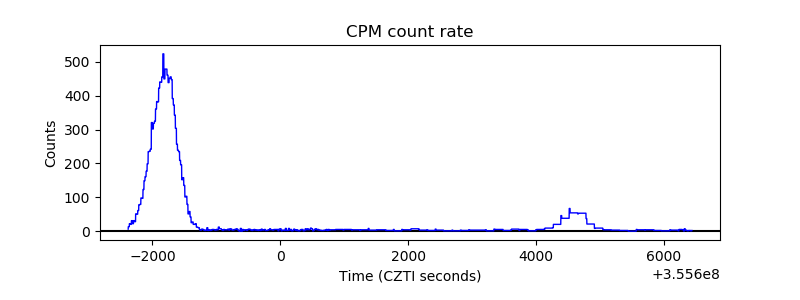 |
| CZT Counter |  |
| +2.5 Volts monitor |  |
| +5 Volts monitor |  |
| _ROLL_ROT | 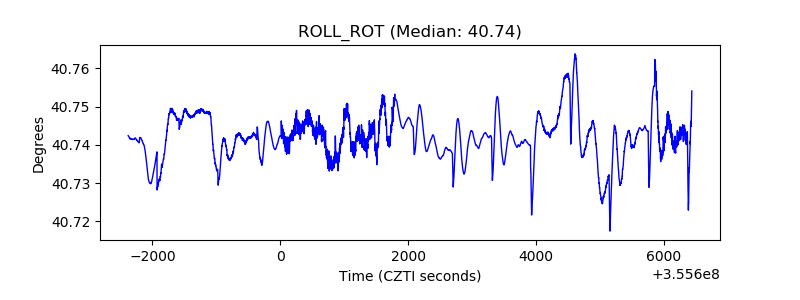 |
| _Roll_DEC | 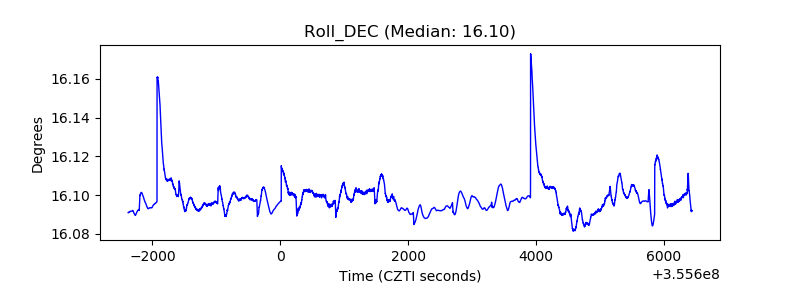 |
| _Roll_RA |  |
| Veto Counter | 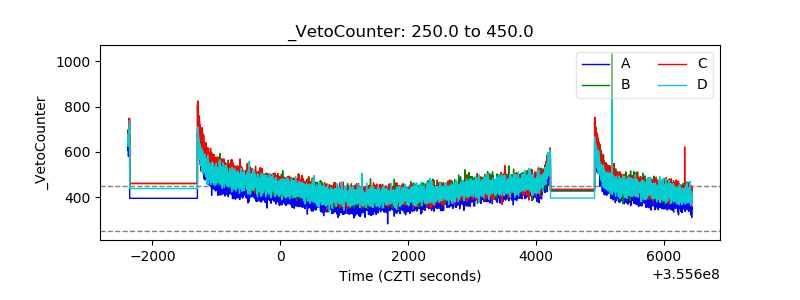 |