| Param | Original file | Final file |
|---|---|---|
| Filename | modeM0/AS1A10_053T02_9000004290_29918cztM0_level2.evt | modeM0/AS1A10_053T02_9000004290_29918cztM0_level2_quad_clean.evt |
| Size (bytes) | 3,270,277,440 | 416,522,880 |
| Size | 3.0 GB | 397.2 MB |
| Events in quadrant A | 15,004,231 | 2,790,755 |
| Events in quadrant B | 23,671,486 | 2,769,521 |
| Events in quadrant C | 19,622,178 | 2,655,130 |
| Events in quadrant D | 38,705,815 | 2,311,167 |
| Mode M0 | |||
|---|---|---|---|
| Quadrant | BADHDUFLAG | Total packets | Discarded packets |
| A | 0 | 63567 | 6 |
| B | 0 | 92472 | 6 |
| C | 0 | 78257 | 6 |
| D | 0 | 136078 | 6 |
| Mode SS | |||
|---|---|---|---|
| Quadrant | BADHDUFLAG | Total packets | Discarded packets |
| A | 0 | 616 | 0 |
| B | 0 | 616 | 0 |
| C | 0 | 616 | 0 |
| D | 0 | 616 | 0 |
| Mode M9 | |||
|---|---|---|---|
| Quadrant | BADHDUFLAG | Total packets | Discarded packets |
| A | 0 | 55 | 0 |
| B | 0 | 55 | 0 |
| C | 0 | 55 | 0 |
| D | 0 | 55 | 0 |
| Quadrant | Total seconds | Saturated seconds | Saturation percentage |
|---|---|---|---|
| A | 30382 | 271 | 0.891976% |
| B | 30382 | 420 | 1.382397% |
| C | 30382 | 894 | 2.942532% |
| D | 30382 | 7346 | 24.178790% |
Noise dominated data is calculated using 1-second bins in cleaned event files. If a bin has >2000 counts, and if more than 50% of those come from <1% of pixels, then it is considered to be noise-dominated and hence unusable.
| Quadrant | # 1 sec bins | Bins with >0 counts | Bins with >2000 counts | High rate bins dominated by noise | Noise dominated (total time) | Noise dominated (detector-on time) | Marked lightcurve |
|---|---|---|---|---|---|---|---|
| A | 35697 | 30388 | 21 | 21 | 0.06% | 0.07% | 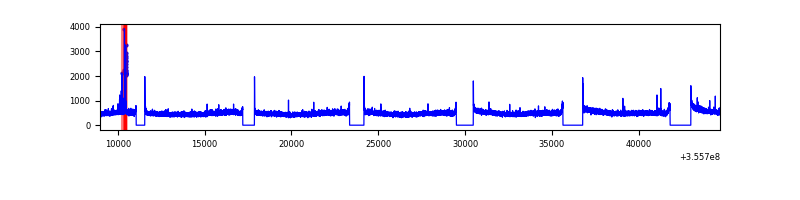 |
| B | 35697 | 30388 | 4 | 4 | 0.01% | 0.01% | 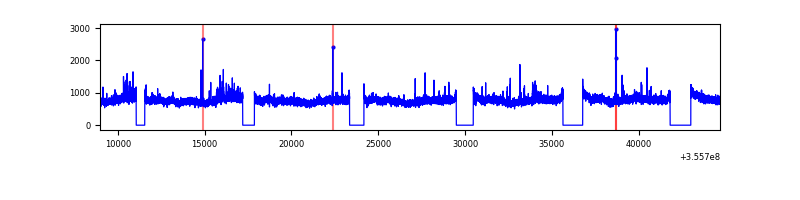 |
| C | 35697 | 30388 | 20 | 20 | 0.06% | 0.07% | 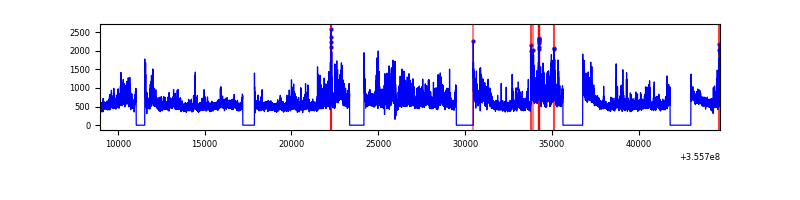 |
| D | 35697 | 30388 | 6351 | 6351 | 17.79% | 20.90% | 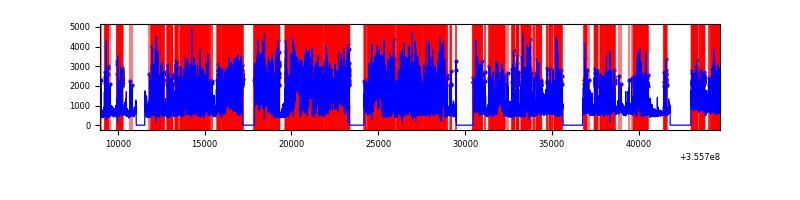 |
Top three noisy pixels from each quadrant. If the there are fewer than three noisy pixels in the level2.evt file, extra rows are filled as -1
| Pixel properties | Quadrant properties | ||||||
|---|---|---|---|---|---|---|---|
| Quadrant | DetID | PixID | Counts | Sigma | Mean | Median | Sigma |
| A | 15 | 174 | 94418 | 119.43 | 3841 | 3762 | 759.1 |
| A | 8 | 192 | 72266 | 90.25 | 3841 | 3762 | 759.1 |
| A | 13 | 254 | 55256 | 67.84 | 3841 | 3762 | 759.1 |
| B | 6 | 159 | 8542516 | 12030.87 | 3767 | 3671 | 709.7 |
| B | 0 | 190 | 304864 | 424.37 | 3767 | 3671 | 709.7 |
| B | 12 | 111 | 86945 | 117.33 | 3767 | 3671 | 709.7 |
| C | 3 | 233 | 4563592 | 5400.03 | 3653 | 3676 | 844.4 |
| C | 14 | 238 | 650215 | 765.66 | 3653 | 3676 | 844.4 |
| C | 14 | 254 | 93524 | 106.4 | 3653 | 3676 | 844.4 |
| D | 7 | 80 | 22092144 | 27726.66 | 3398 | 3310 | 796.7 |
| D | 8 | 195 | 1474630 | 1846.85 | 3398 | 3310 | 796.7 |
| D | 1 | 52 | 812365 | 1015.55 | 3398 | 3310 | 796.7 |
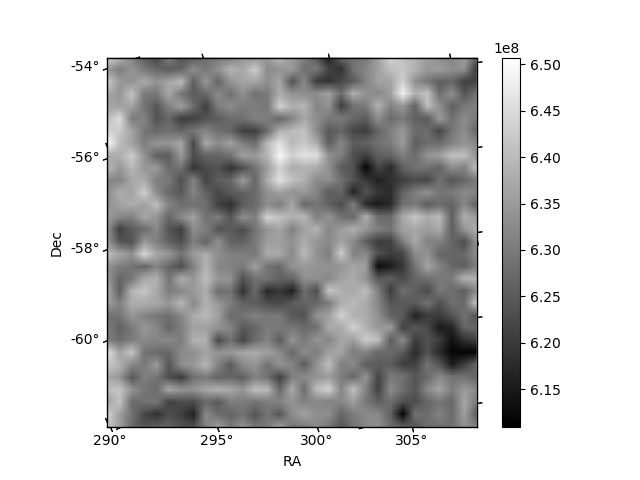
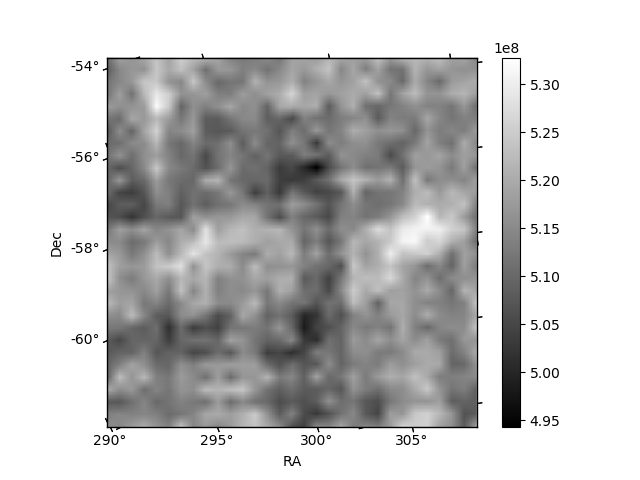
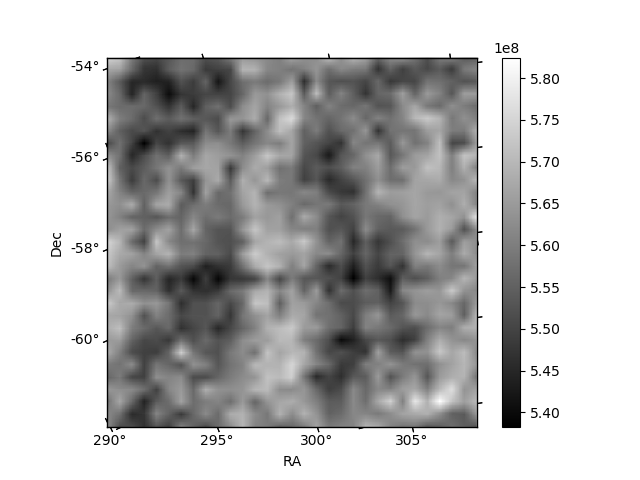
Histogram calculated using DETX and DETY for each event in the final _common_clean file
| Quadrant A | 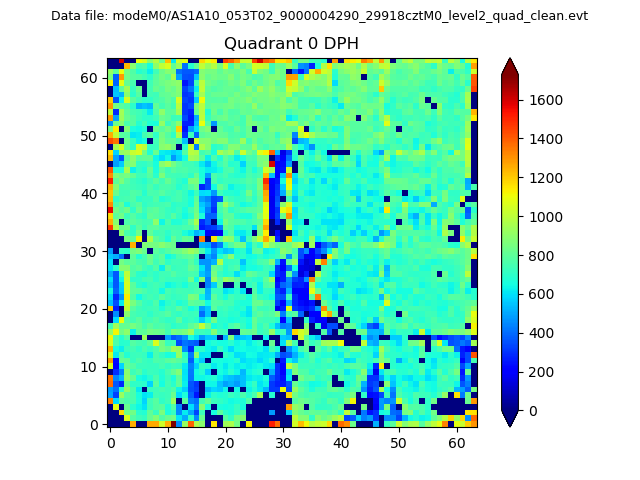 |
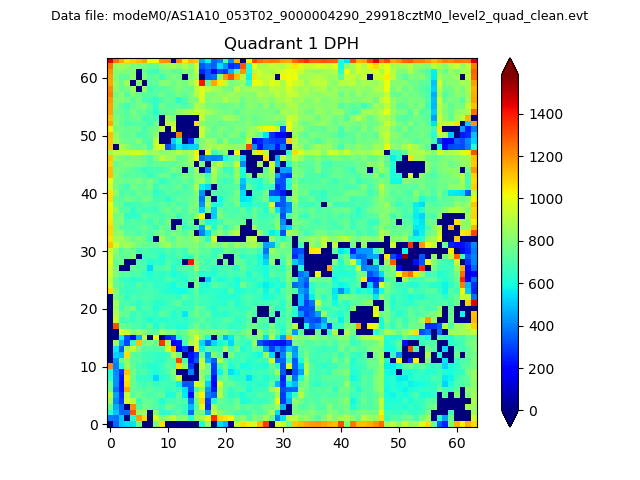 |
Quadrant B |
|---|---|---|---|
| Quadrant D | 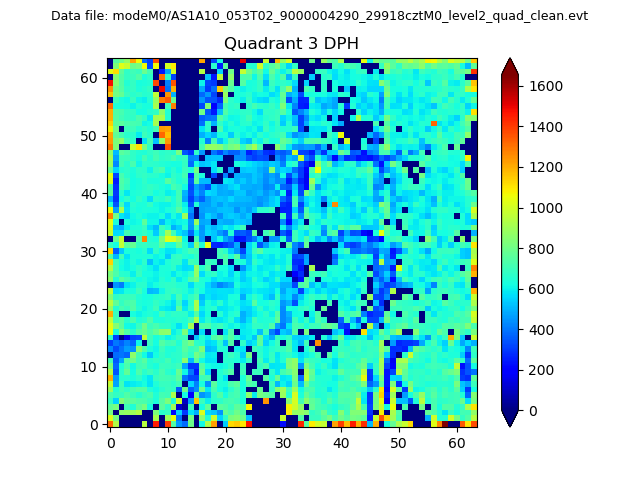 |
 |
Quadrant C |
| Plot type | Count rate plots | Images |
|---|---|---|
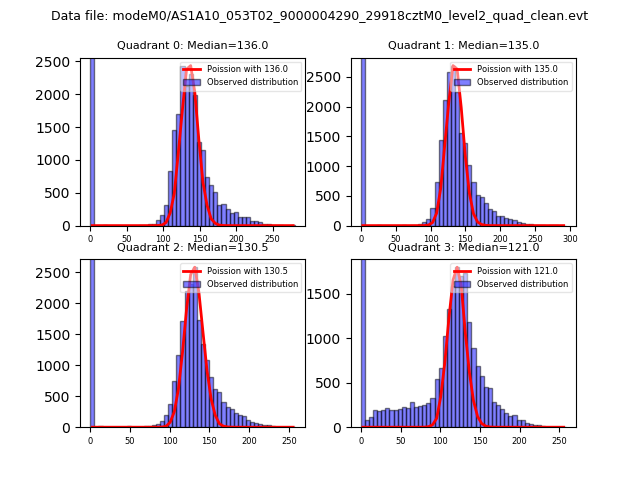
| Comparison with Poisson distribution Blue bars denote a histogram of data divided into 1 sec bins. Red curve is a Poisson curve with rate = median count rate of data. |
 |
 |
| Quadrant-wise count rates Data is divided into 100 sec bins |
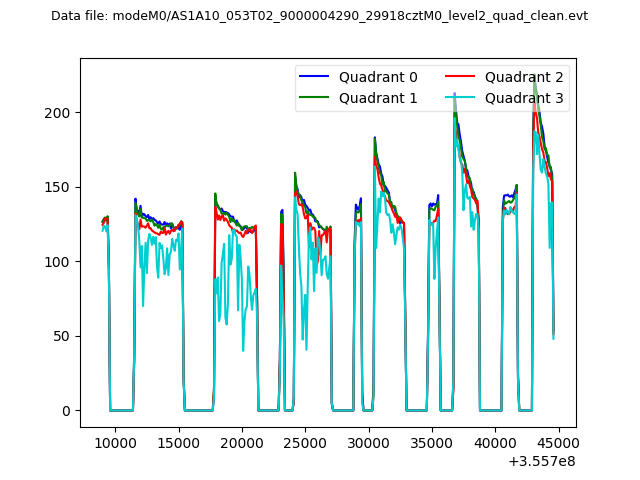 |
|
| Module-wise count rates for Quadrant A Data is divided into 100 sec bins |
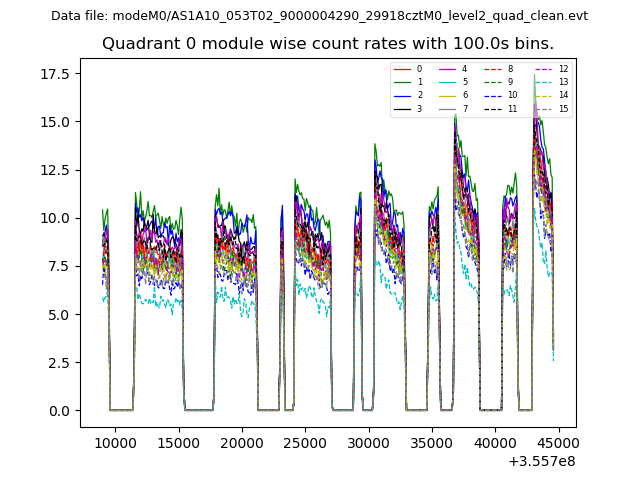 |
 |
| Module-wise count rates for Quadrant B Data is divided into 100 sec bins |
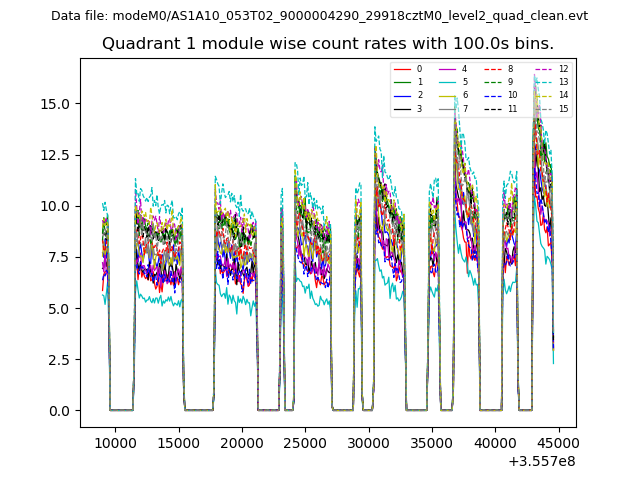 |
 |
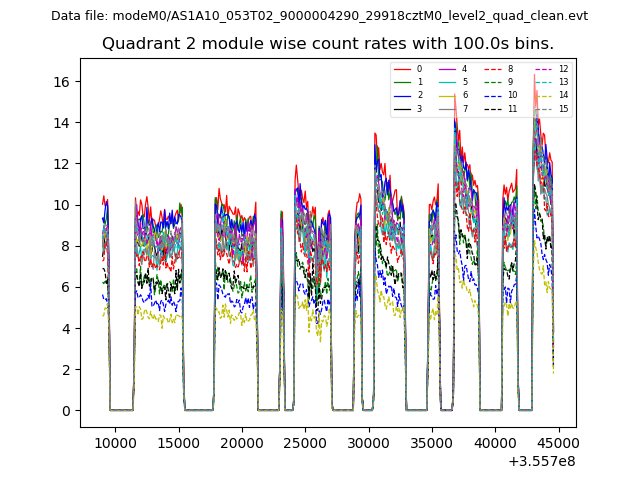
| Module-wise count rates for Quadrant C Data is divided into 100 sec bins |
 |
 |
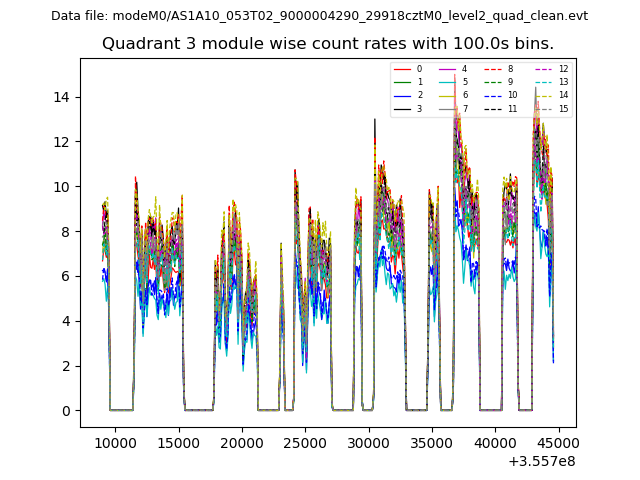
| Module-wise count rates for Quadrant D Data is divided into 100 sec bins |
 |
 |
| Parameter | Plot |
|---|---|
| CZT HV Monitor | 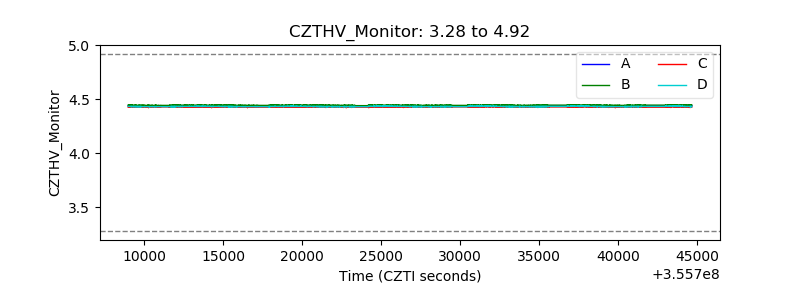 |
| D_VDD | 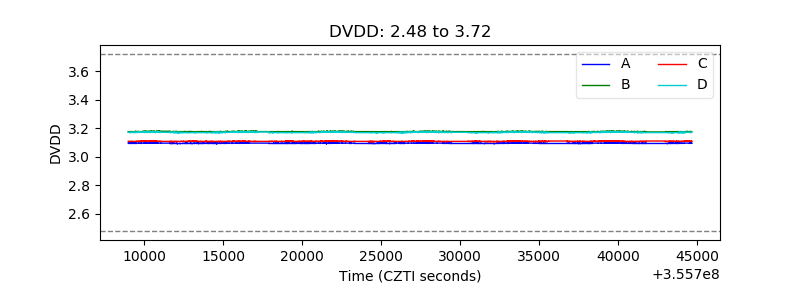 |
| Temperature 1 | 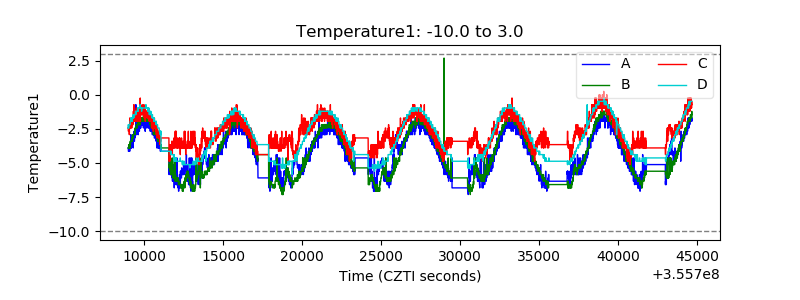 |
| Veto HV Monitor | 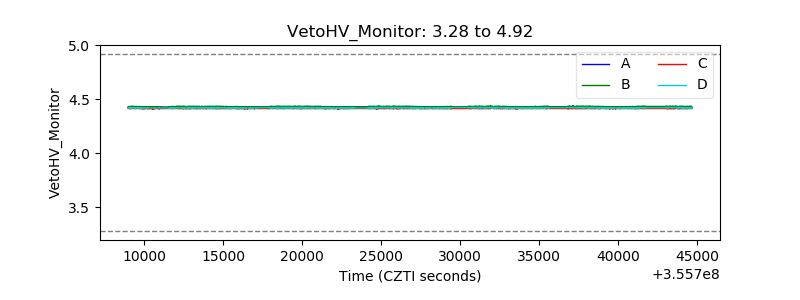 |
| Veto LLD | 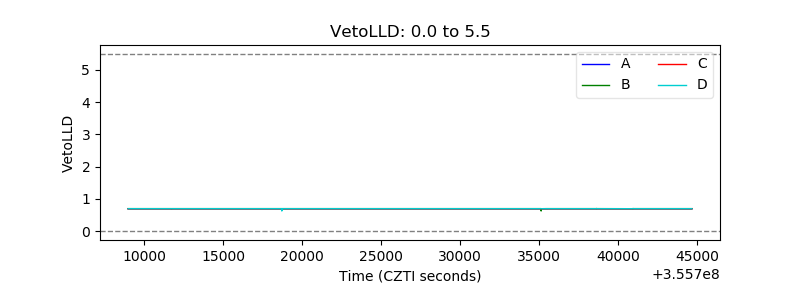 |
| Alpha Counter | 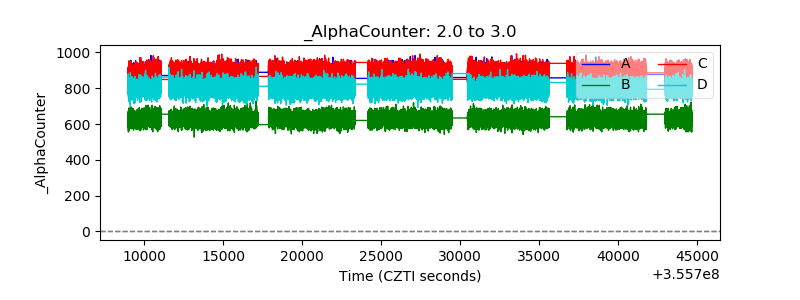 |
| _CPM_Rate | 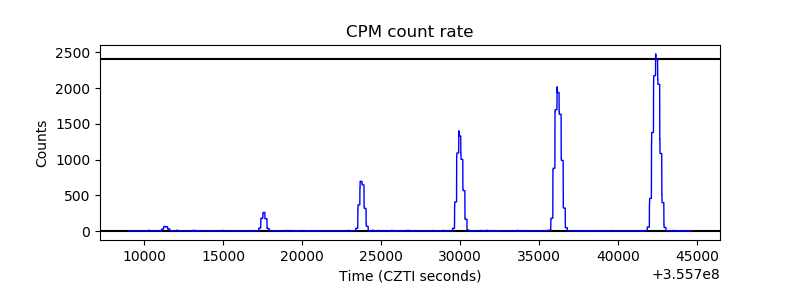 |
| CZT Counter |  |
| +2.5 Volts monitor |  |
| +5 Volts monitor |  |
| _ROLL_ROT |  |
| _Roll_DEC | 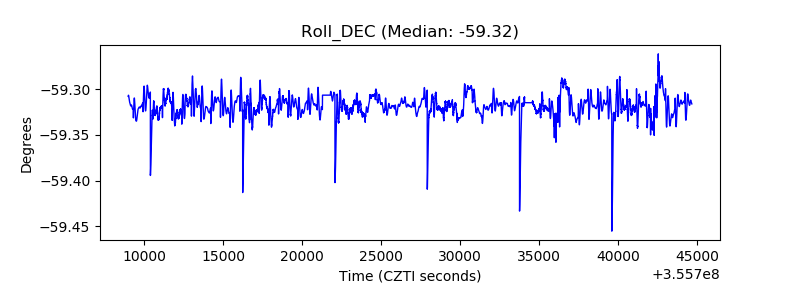 |
| _Roll_RA |  |
| Veto Counter |  |