| Param | Original file | Final file |
|---|---|---|
| Filename | modeM0/AS1A10_102T04_9000004286_29899cztM0_level2.evt | modeM0/AS1A10_102T04_9000004286_29899cztM0_level2_quad_clean.evt |
| Size (bytes) | 998,795,520 | 137,917,440 |
| Size | 952.5 MB | 131.5 MB |
| Events in quadrant A | 5,355,478 | 866,864 |
| Events in quadrant B | 8,398,120 | 870,365 |
| Events in quadrant C | 7,493,525 | 852,727 |
| Events in quadrant D | 8,244,864 | 810,100 |
| Mode SS | |||
|---|---|---|---|
| Quadrant | BADHDUFLAG | Total packets | Discarded packets |
| A | 0 | 226 | 0 |
| B | 0 | 226 | 0 |
| C | 0 | 226 | 0 |
| D | 0 | 226 | 0 |
| Mode M9 | |||
|---|---|---|---|
| Quadrant | BADHDUFLAG | Total packets | Discarded packets |
| A | 0 | 14 | 0 |
| B | 0 | 14 | 0 |
| C | 0 | 14 | 0 |
| D | 0 | 14 | 0 |
| Mode M0 | |||
|---|---|---|---|
| Quadrant | BADHDUFLAG | Total packets | Discarded packets |
| A | 0 | 22936 | 2 |
| B | 0 | 33792 | 2 |
| C | 0 | 30042 | 2 |
| D | 0 | 31790 | 2 |
| Quadrant | Total seconds | Saturated seconds | Saturation percentage |
|---|---|---|---|
| A | 11229 | 89 | 0.792591% |
| B | 11229 | 162 | 1.442693% |
| C | 11229 | 273 | 2.431205% |
| D | 11228 | 586 | 5.219095% |
Noise dominated data is calculated using 1-second bins in cleaned event files. If a bin has >2000 counts, and if more than 50% of those come from <1% of pixels, then it is considered to be noise-dominated and hence unusable.
| Quadrant | # 1 sec bins | Bins with >0 counts | Bins with >2000 counts | High rate bins dominated by noise | Noise dominated (total time) | Noise dominated (detector-on time) | Marked lightcurve |
|---|---|---|---|---|---|---|---|
| A | 12524 | 11231 | 0 | 0 | 0.00% | 0.00% | 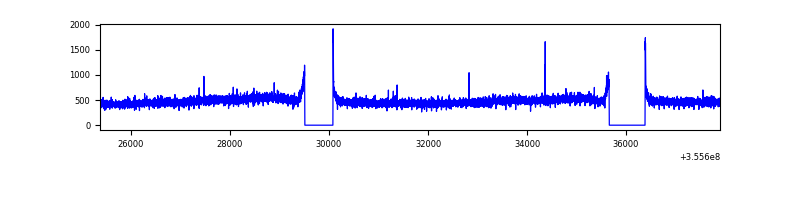 |
| B | 12524 | 11231 | 1 | 1 | 0.01% | 0.01% | 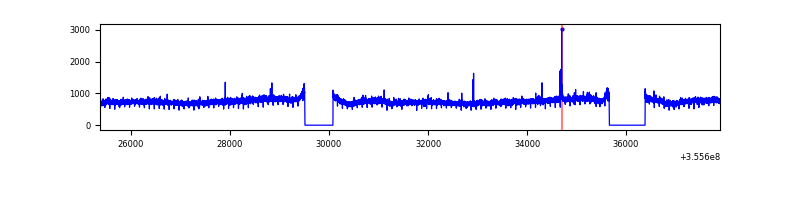 |
| C | 12524 | 11231 | 18 | 18 | 0.14% | 0.16% | 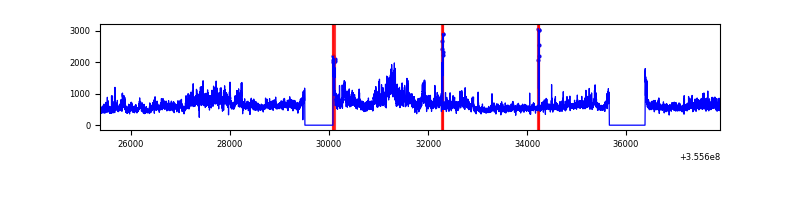 |
| D | 12523 | 11230 | 448 | 448 | 3.58% | 3.99% | 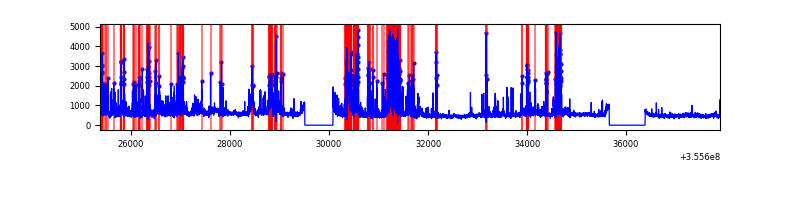 |
Top three noisy pixels from each quadrant. If the there are fewer than three noisy pixels in the level2.evt file, extra rows are filled as -1
| Pixel properties | Quadrant properties | ||||||
|---|---|---|---|---|---|---|---|
| Quadrant | DetID | PixID | Counts | Sigma | Mean | Median | Sigma |
| A | 8 | 192 | 24329 | 82.99 | 1376 | 1346 | 276.9 |
| A | 1 | 113 | 23426 | 79.73 | 1376 | 1346 | 276.9 |
| A | 13 | 254 | 18678 | 62.58 | 1376 | 1346 | 276.9 |
| B | 6 | 159 | 3038734 | 11559.86 | 1357 | 1324 | 262.8 |
| B | 12 | 111 | 33151 | 121.13 | 1357 | 1324 | 262.8 |
| B | 11 | 111 | 31097 | 113.31 | 1357 | 1324 | 262.8 |
| C | 3 | 233 | 2017790 | 6564.86 | 1314 | 1323 | 307.2 |
| C | 14 | 238 | 218056 | 705.6 | 1314 | 1323 | 307.2 |
| C | 10 | 22 | 62461 | 199.04 | 1314 | 1323 | 307.2 |
| D | 7 | 80 | 2362464 | 7509.09 | 1311 | 1274 | 314.4 |
| D | 8 | 195 | 447913 | 1420.41 | 1311 | 1274 | 314.4 |
| D | 2 | 250 | 173209 | 546.79 | 1311 | 1274 | 314.4 |
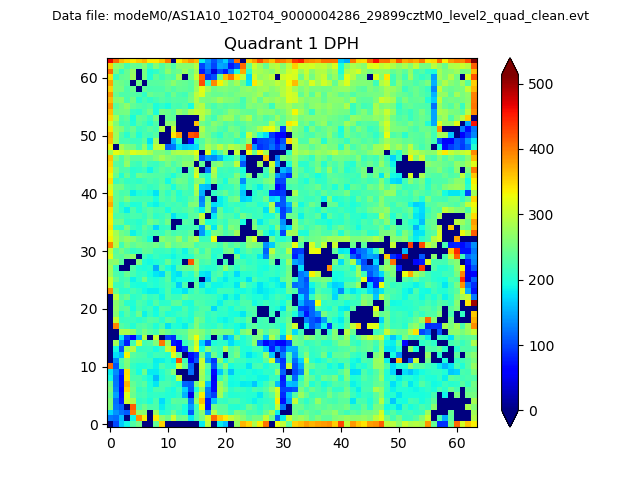
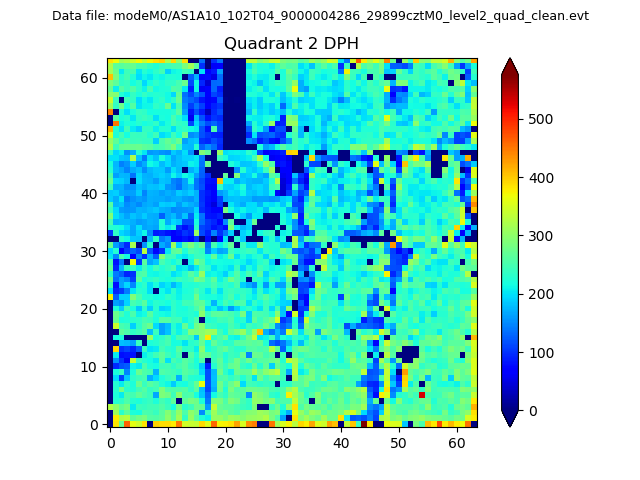
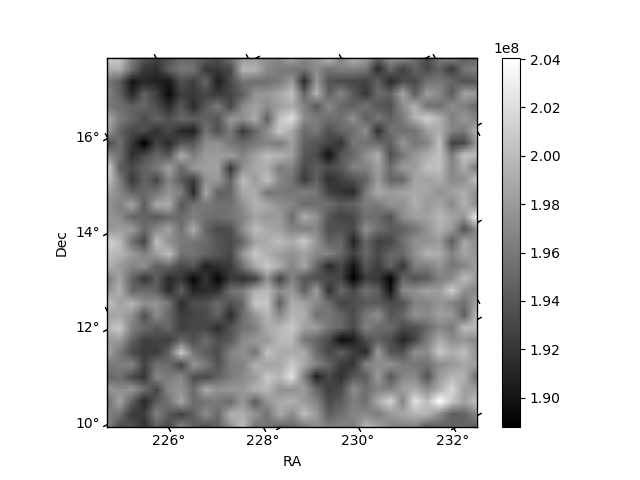
Histogram calculated using DETX and DETY for each event in the final _common_clean file
| Quadrant A |  |
 |
Quadrant B |
|---|---|---|---|
| Quadrant D |  |
 |
Quadrant C |
| Plot type | Count rate plots | Images |
|---|---|---|
| Comparison with Poisson distribution Blue bars denote a histogram of data divided into 1 sec bins. Red curve is a Poisson curve with rate = median count rate of data. |
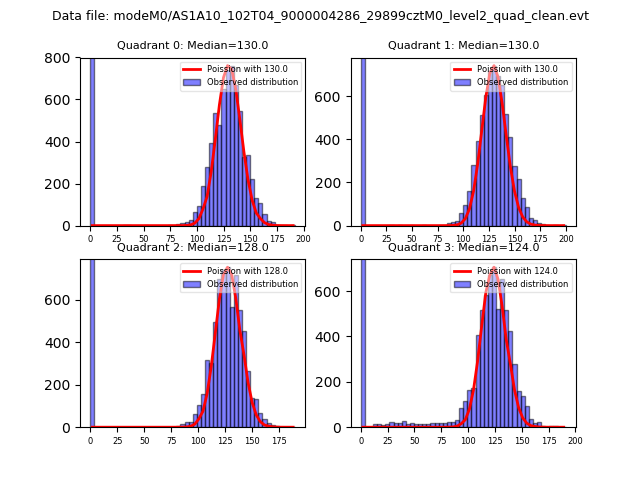 |
 |
| Quadrant-wise count rates Data is divided into 100 sec bins |
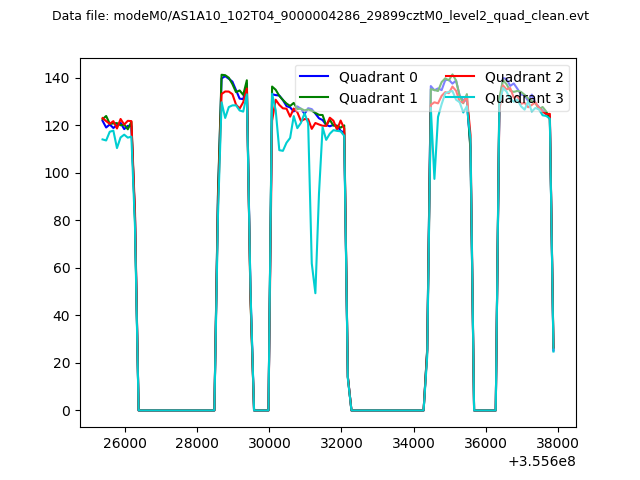 |
|
| Module-wise count rates for Quadrant A Data is divided into 100 sec bins |
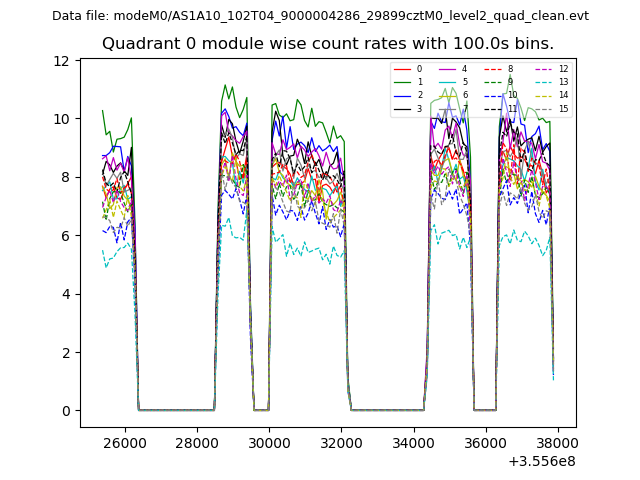 |
 |
| Module-wise count rates for Quadrant B Data is divided into 100 sec bins |
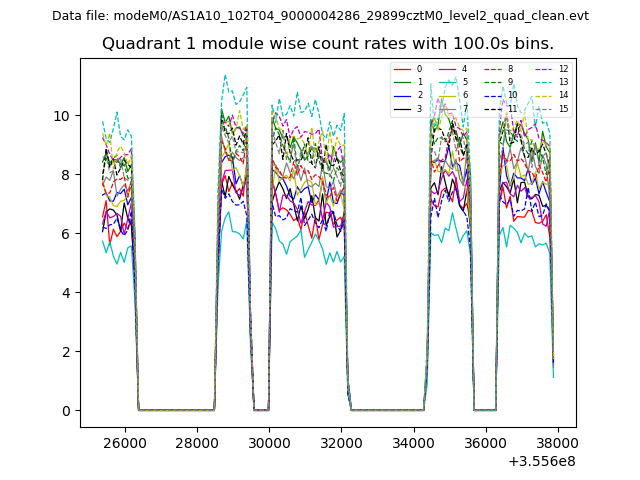 |
 |
| Module-wise count rates for Quadrant C Data is divided into 100 sec bins |
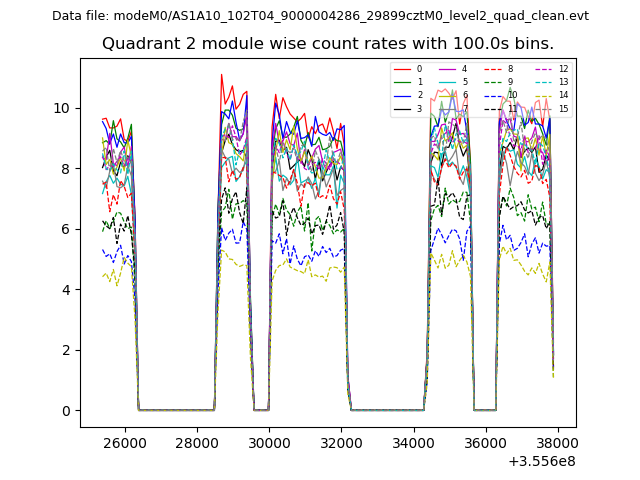 |
 |
| Module-wise count rates for Quadrant D Data is divided into 100 sec bins |
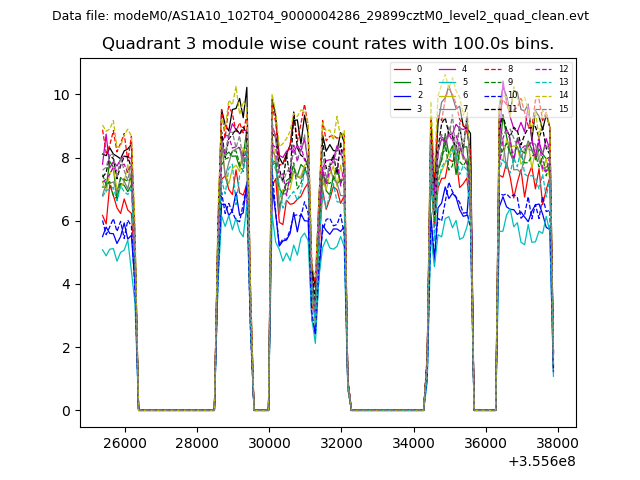 |
 |
| Parameter | Plot |
|---|---|
| CZT HV Monitor | 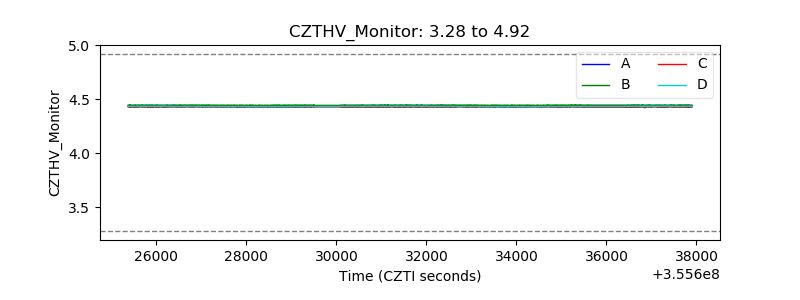 |
| D_VDD | 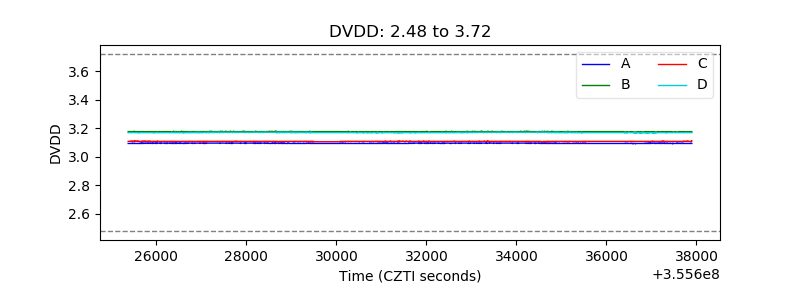 |
| Temperature 1 | 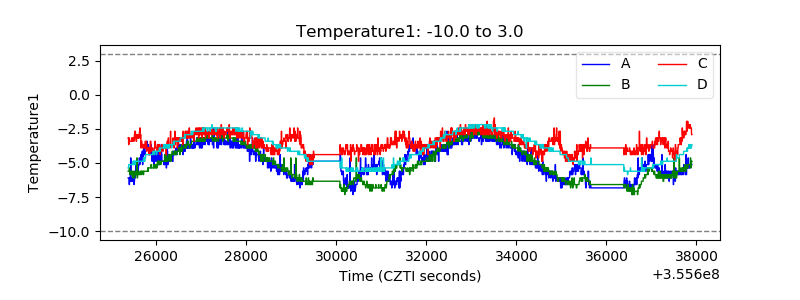 |
| Veto HV Monitor | 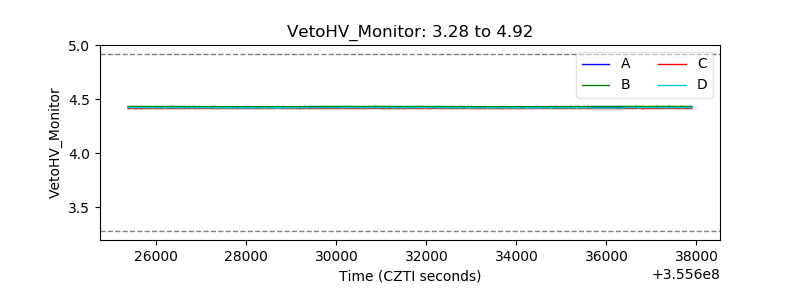 |
| Veto LLD | 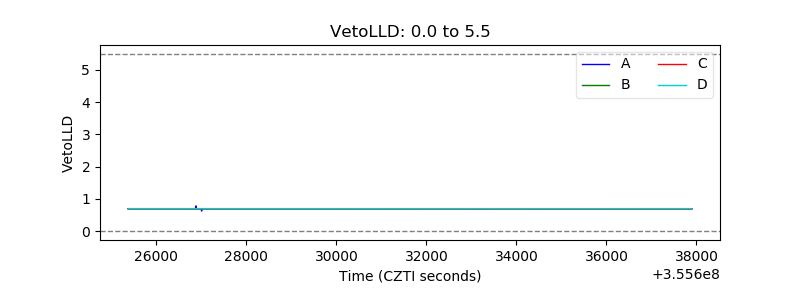 |
| Alpha Counter | 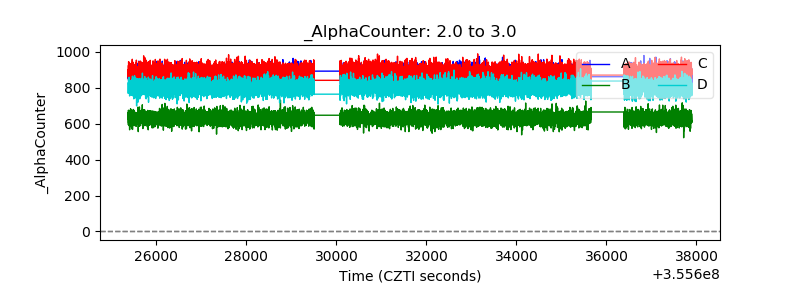 |
| _CPM_Rate | 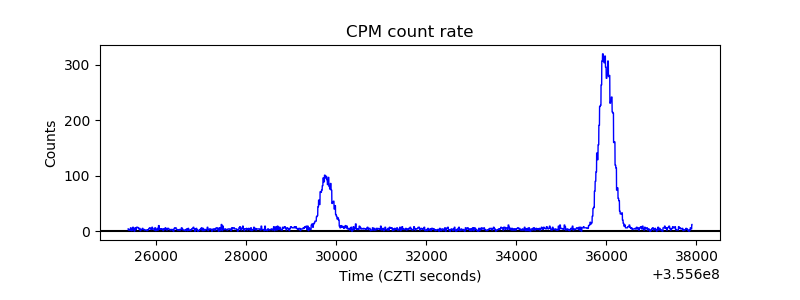 |
| CZT Counter | 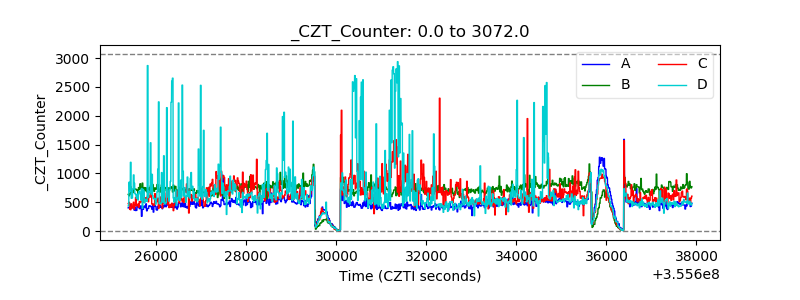 |
| +2.5 Volts monitor |  |
| +5 Volts monitor | 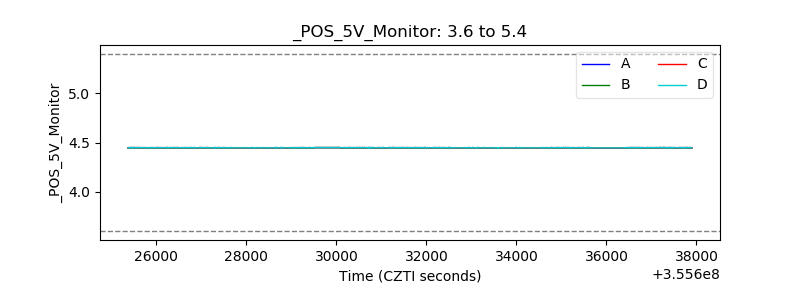 |
| _ROLL_ROT | 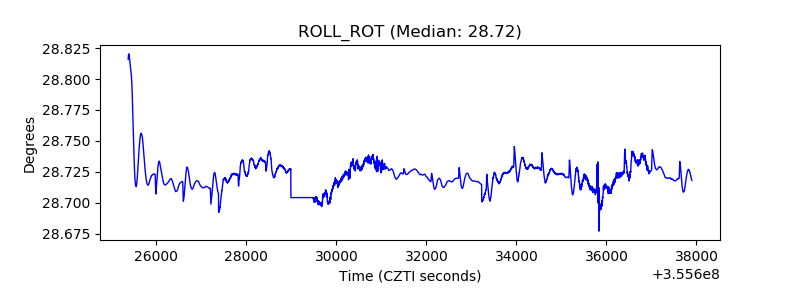 |
| _Roll_DEC | 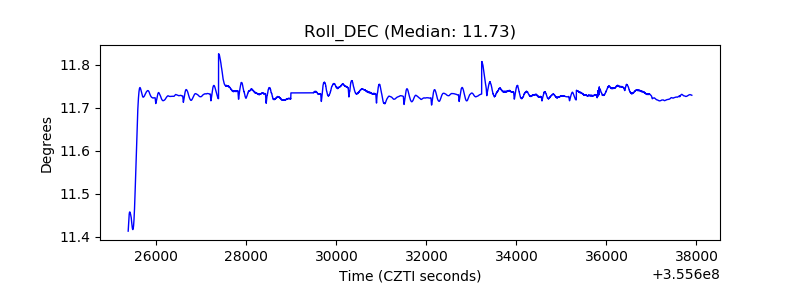 |
| _Roll_RA | 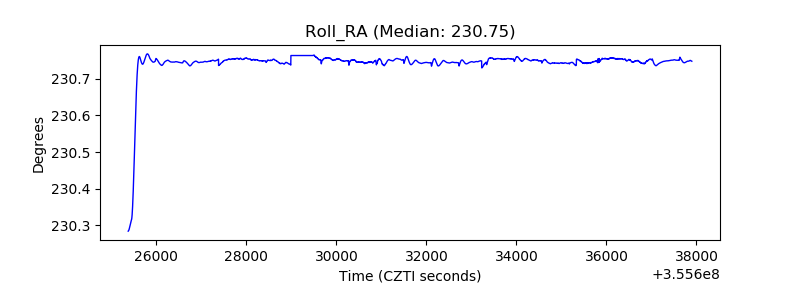 |
| Veto Counter | 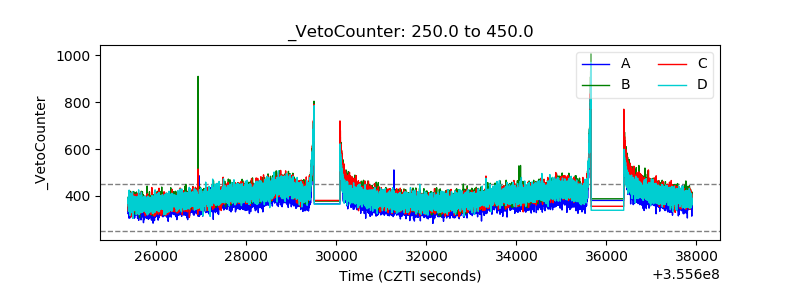 |