| Param | Original file | Final file |
|---|---|---|
| Filename | modeM0/AS1A10_102T04_9000004286_29900cztM0_level2.evt | modeM0/AS1A10_102T04_9000004286_29900cztM0_level2_quad_clean.evt |
| Size (bytes) | 452,148,480 | 63,420,480 |
| Size | 431.2 MB | 60.5 MB |
| Events in quadrant A | 2,467,461 | 393,781 |
| Events in quadrant B | 3,939,562 | 394,401 |
| Events in quadrant C | 4,257,630 | 384,377 |
| Events in quadrant D | 2,673,917 | 380,975 |
| Mode SS | |||
|---|---|---|---|
| Quadrant | BADHDUFLAG | Total packets | Discarded packets |
| A | 0 | 106 | 0 |
| B | 0 | 106 | 0 |
| C | 0 | 106 | 0 |
| D | 0 | 106 | 0 |
| Mode M9 | |||
|---|---|---|---|
| Quadrant | BADHDUFLAG | Total packets | Discarded packets |
| A | 0 | 5 | 0 |
| B | 0 | 5 | 0 |
| C | 0 | 5 | 0 |
| D | 0 | 5 | 0 |
| Mode M0 | |||
|---|---|---|---|
| Quadrant | BADHDUFLAG | Total packets | Discarded packets |
| A | 0 | 10582 | 0 |
| B | 0 | 15705 | 0 |
| C | 0 | 16304 | 0 |
| D | 0 | 11081 | 0 |
| Quadrant | Total seconds | Saturated seconds | Saturation percentage |
|---|---|---|---|
| A | 5235 | 30 | 0.573066% |
| B | 5236 | 40 | 0.763942% |
| C | 5236 | 224 | 4.278075% |
| D | 5236 | 31 | 0.592055% |
Noise dominated data is calculated using 1-second bins in cleaned event files. If a bin has >2000 counts, and if more than 50% of those come from <1% of pixels, then it is considered to be noise-dominated and hence unusable.
| Quadrant | # 1 sec bins | Bins with >0 counts | Bins with >2000 counts | High rate bins dominated by noise | Noise dominated (total time) | Noise dominated (detector-on time) | Marked lightcurve |
|---|---|---|---|---|---|---|---|
| A | 5235 | 5235 | 0 | 0 | 0.00% | 0.00% | 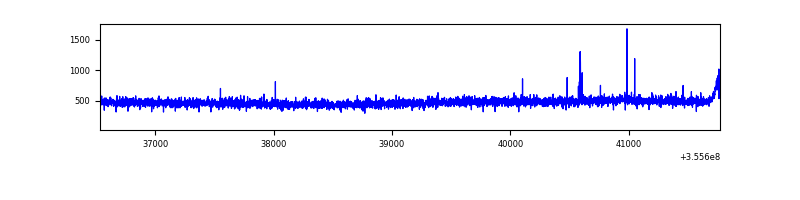 |
| B | 5236 | 5236 | 0 | 0 | 0.00% | 0.00% | 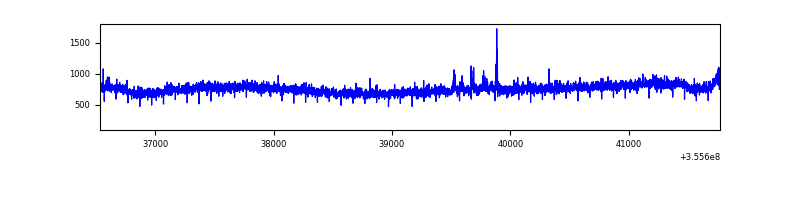 |
| C | 5236 | 5236 | 48 | 48 | 0.92% | 0.92% | 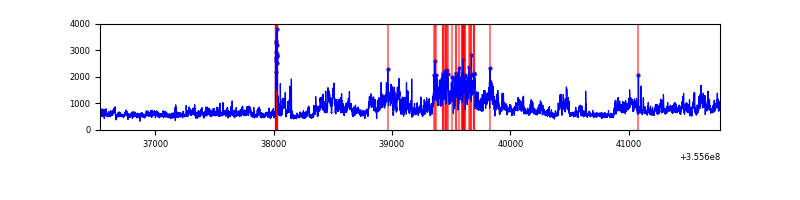 |
| D | 5236 | 5236 | 8 | 8 | 0.15% | 0.15% | 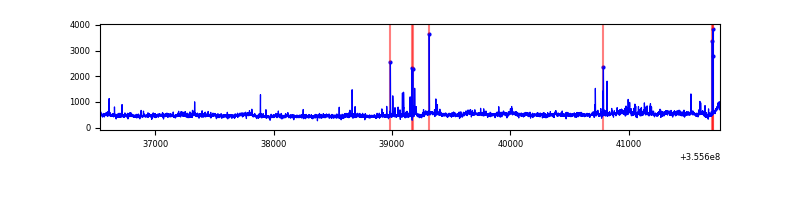 |
Top three noisy pixels from each quadrant. If the there are fewer than three noisy pixels in the level2.evt file, extra rows are filled as -1
| Pixel properties | Quadrant properties | ||||||
|---|---|---|---|---|---|---|---|
| Quadrant | DetID | PixID | Counts | Sigma | Mean | Median | Sigma |
| A | 15 | 174 | 11520 | 85.05 | 636 | 622 | 128.1 |
| A | 13 | 254 | 8937 | 64.9 | 636 | 622 | 128.1 |
| A | 3 | 137 | 6479 | 45.71 | 636 | 622 | 128.1 |
| B | 6 | 159 | 1447818 | 11796.9 | 627 | 609 | 122.7 |
| B | 0 | 229 | 30919 | 247.07 | 627 | 609 | 122.7 |
| B | 12 | 111 | 15103 | 118.15 | 627 | 609 | 122.7 |
| C | 3 | 233 | 1692326 | 11857.49 | 605 | 608 | 142.7 |
| C | 14 | 238 | 102865 | 716.73 | 605 | 608 | 142.7 |
| C | 15 | 208 | 70023 | 486.54 | 605 | 608 | 142.7 |
| D | 8 | 195 | 190867 | 1273.65 | 619 | 603 | 149.4 |
| D | 2 | 250 | 58712 | 388.99 | 619 | 603 | 149.4 |
| D | 7 | 238 | 49393 | 326.61 | 619 | 603 | 149.4 |
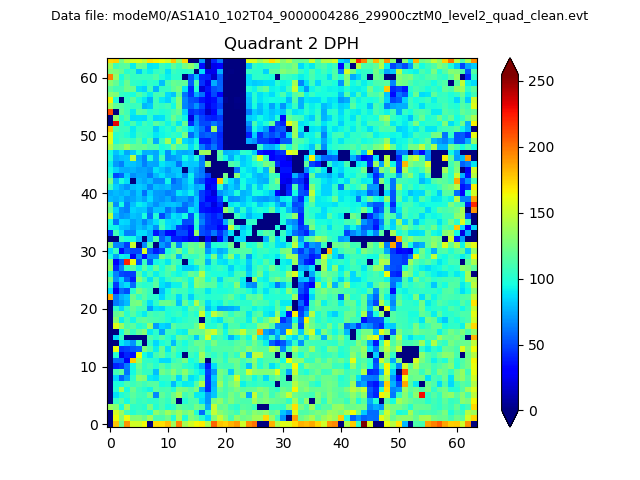
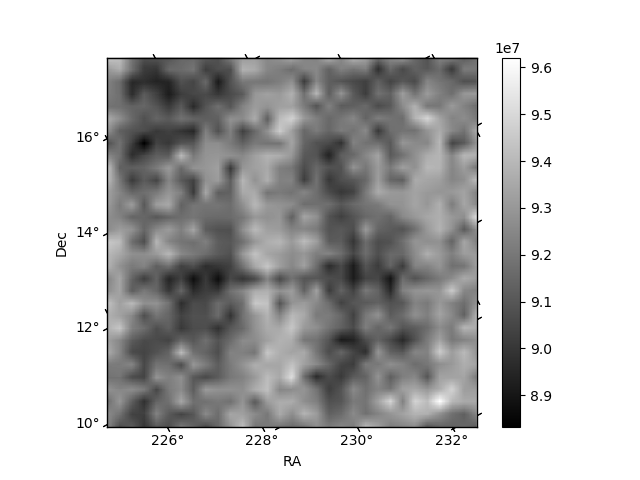
Histogram calculated using DETX and DETY for each event in the final _common_clean file
| Quadrant A | 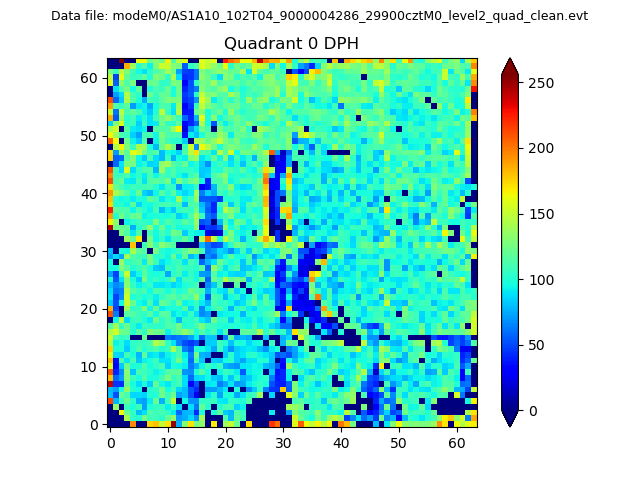 |
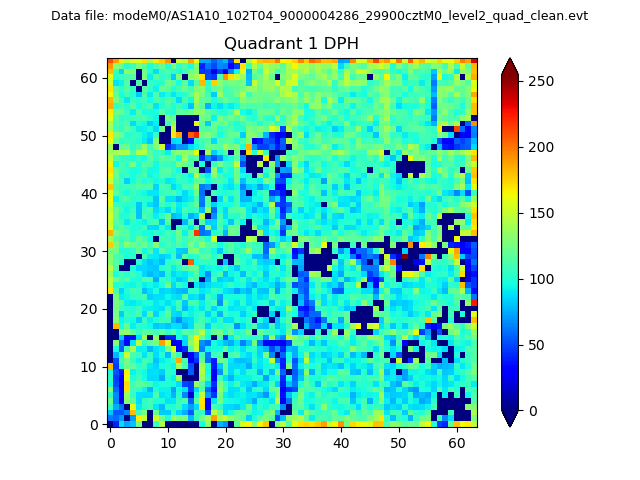 |
Quadrant B |
|---|---|---|---|
| Quadrant D | 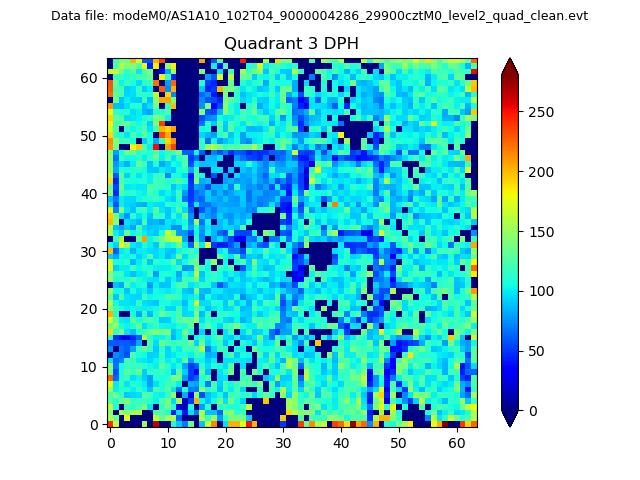 |
 |
Quadrant C |
| Plot type | Count rate plots | Images |
|---|---|---|
| Comparison with Poisson distribution Blue bars denote a histogram of data divided into 1 sec bins. Red curve is a Poisson curve with rate = median count rate of data. |
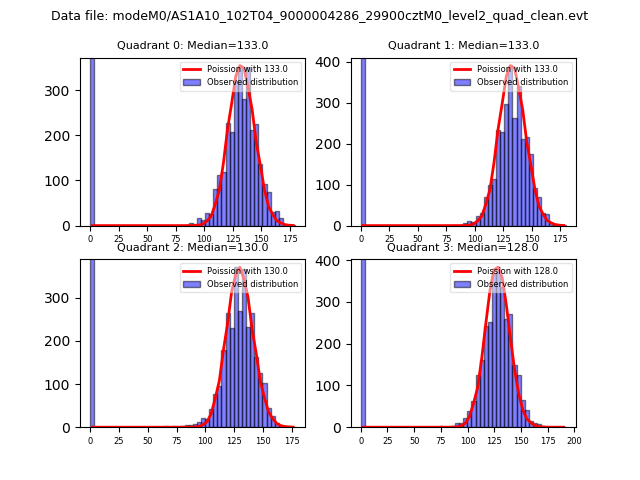 |
 |
| Quadrant-wise count rates Data is divided into 100 sec bins |
 |
|
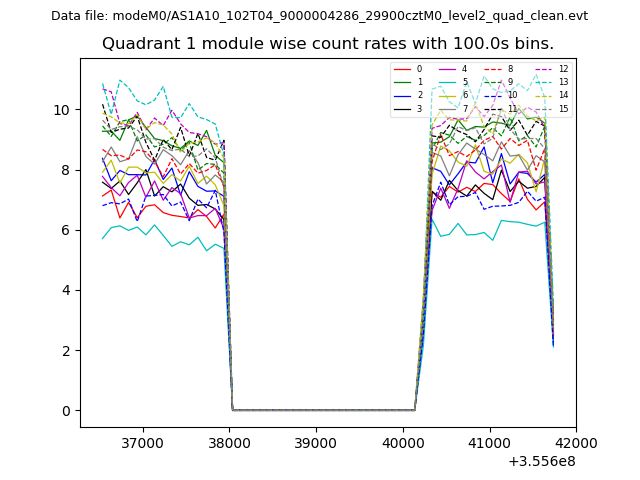
| Module-wise count rates for Quadrant A Data is divided into 100 sec bins |
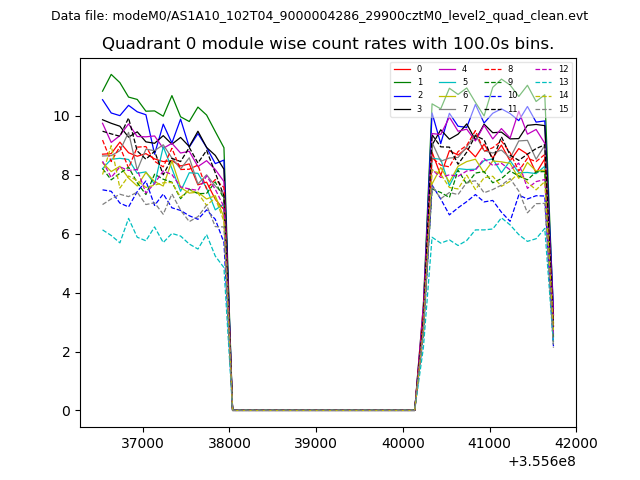 |
 |
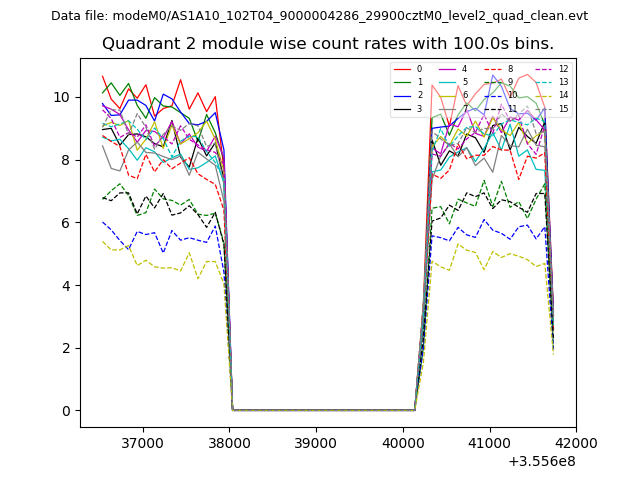
| Module-wise count rates for Quadrant B Data is divided into 100 sec bins |
 |
 |
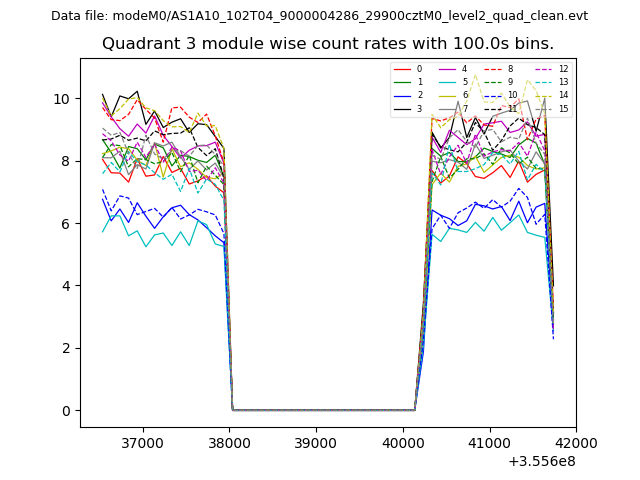
| Module-wise count rates for Quadrant C Data is divided into 100 sec bins |
 |
 |
| Module-wise count rates for Quadrant D Data is divided into 100 sec bins |
 |
 |
| Parameter | Plot |
|---|---|
| CZT HV Monitor | 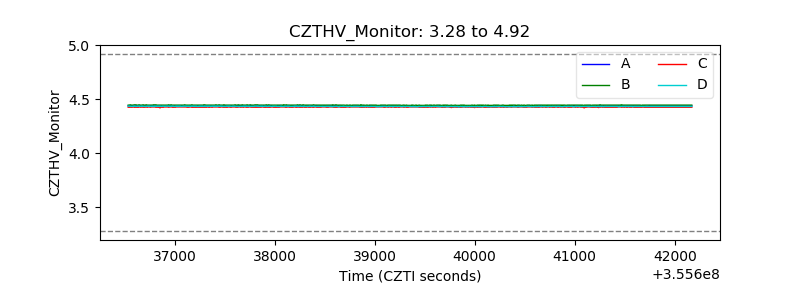 |
| D_VDD | 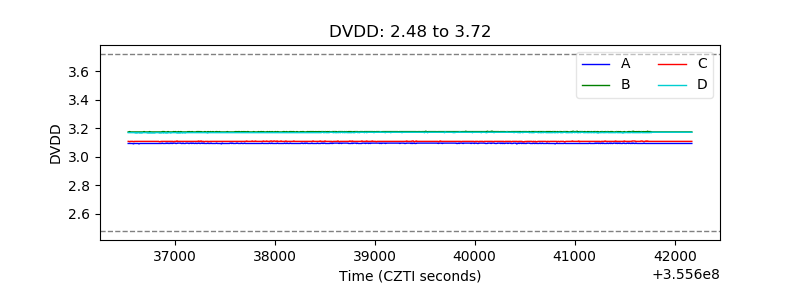 |
| Temperature 1 | 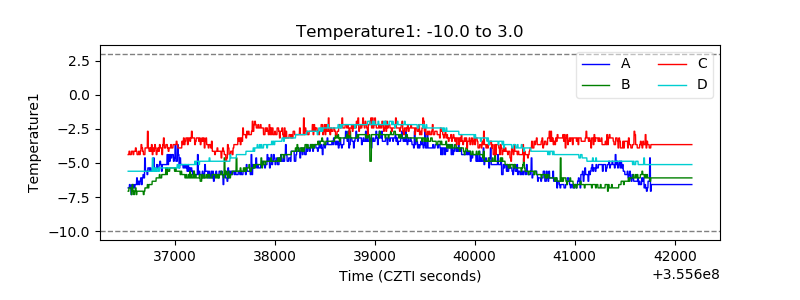 |
| Veto HV Monitor |  |
| Veto LLD | 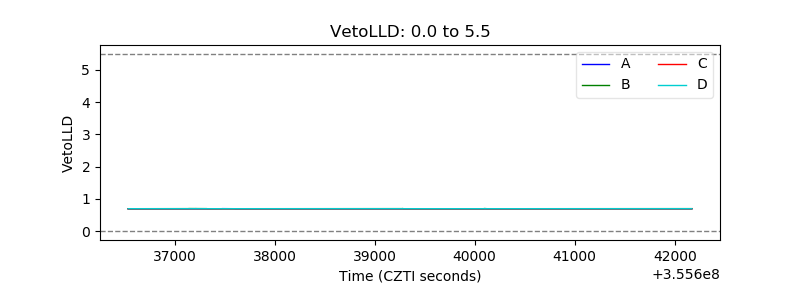 |
| Alpha Counter | 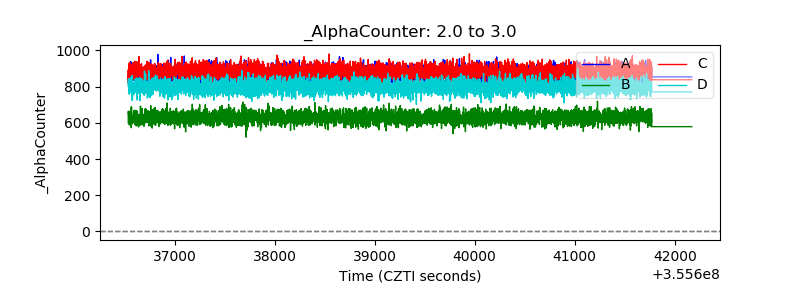 |
| _CPM_Rate |  |
| CZT Counter | 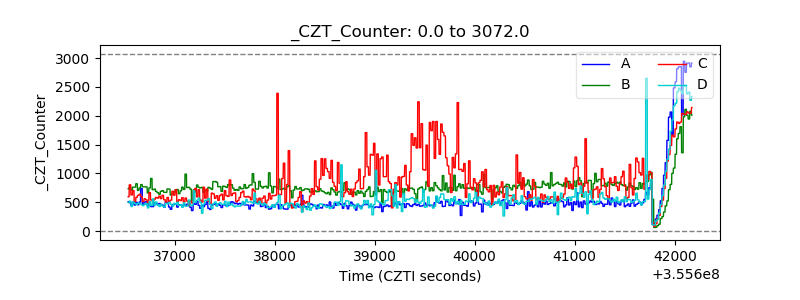 |
| +2.5 Volts monitor |  |
| +5 Volts monitor | 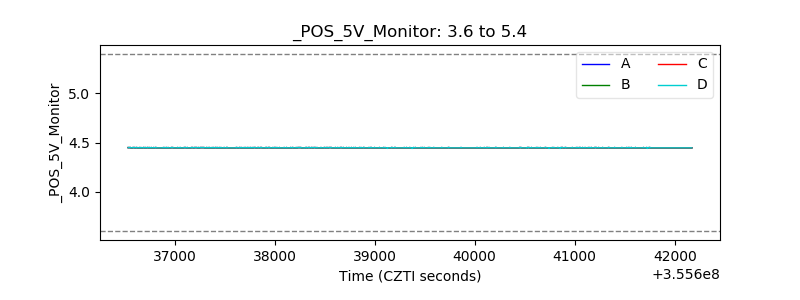 |
| _ROLL_ROT | 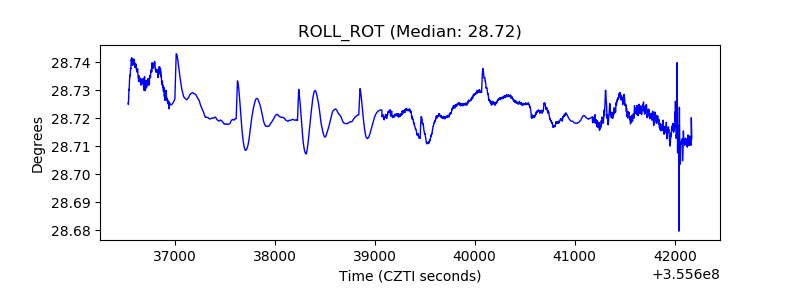 |
| _Roll_DEC | 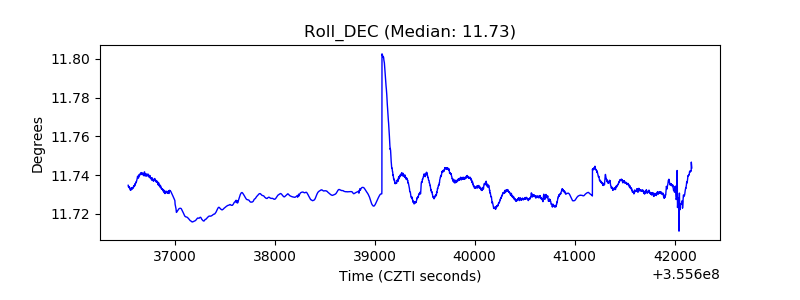 |
| _Roll_RA | 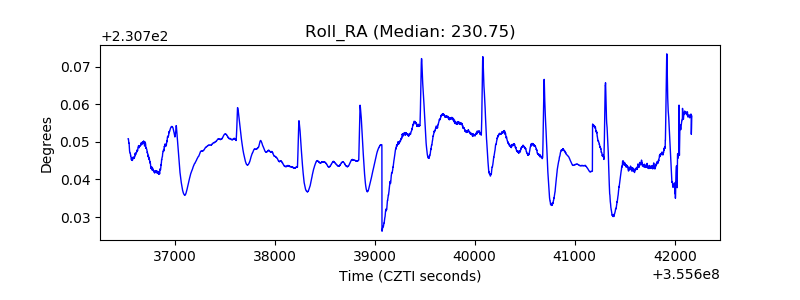 |
| Veto Counter | 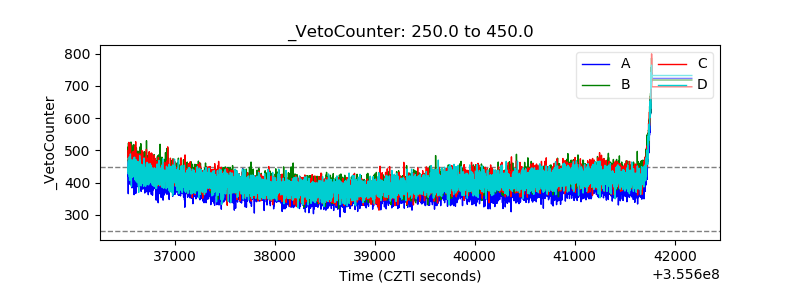 |