| Param | Original file | Final file |
|---|---|---|
| Filename | modeM0/AS1A10_102T04_9000004286_29919cztM0_level2.evt | modeM0/AS1A10_102T04_9000004286_29919cztM0_level2_quad_clean.evt |
| Size (bytes) | 608,368,320 | 88,390,080 |
| Size | 580.2 MB | 84.3 MB |
| Events in quadrant A | 3,133,404 | 595,391 |
| Events in quadrant B | 4,750,257 | 594,692 |
| Events in quadrant C | 3,528,845 | 568,285 |
| Events in quadrant D | 6,625,405 | 517,712 |
| Mode SS | |||
|---|---|---|---|
| Quadrant | BADHDUFLAG | Total packets | Discarded packets |
| A | 0 | 118 | 0 |
| B | 0 | 118 | 0 |
| C | 0 | 118 | 0 |
| D | 0 | 118 | 0 |
| Mode M9 | |||
|---|---|---|---|
| Quadrant | BADHDUFLAG | Total packets | Discarded packets |
| A | 0 | 13 | 0 |
| B | 0 | 13 | 0 |
| C | 0 | 13 | 0 |
| D | 0 | 13 | 0 |
| Mode M0 | |||
|---|---|---|---|
| Quadrant | BADHDUFLAG | Total packets | Discarded packets |
| A | 0 | 12706 | 3 |
| B | 0 | 17621 | 1 |
| C | 0 | 14210 | 1 |
| D | 0 | 23806 | 1 |
| Quadrant | Total seconds | Saturated seconds | Saturation percentage |
|---|---|---|---|
| A | 5720 | 73 | 1.276224% |
| B | 5721 | 90 | 1.573152% |
| C | 5721 | 117 | 2.045097% |
| D | 5721 | 840 | 14.682748% |
Noise dominated data is calculated using 1-second bins in cleaned event files. If a bin has >2000 counts, and if more than 50% of those come from <1% of pixels, then it is considered to be noise-dominated and hence unusable.
| Quadrant | # 1 sec bins | Bins with >0 counts | Bins with >2000 counts | High rate bins dominated by noise | Noise dominated (total time) | Noise dominated (detector-on time) | Marked lightcurve |
|---|---|---|---|---|---|---|---|
| A | 7030 | 5721 | 1 | 1 | 0.01% | 0.02% | 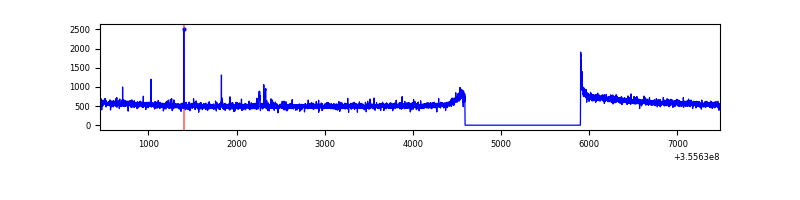 |
| B | 7031 | 5722 | 0 | 0 | 0.00% | 0.00% | 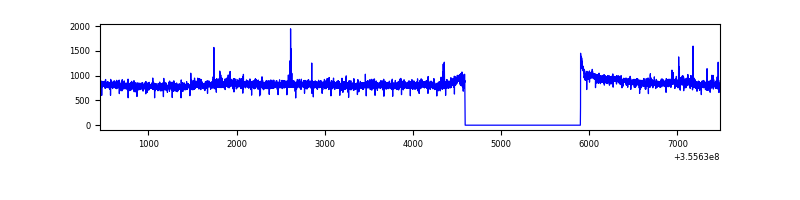 |
| C | 7031 | 5722 | 3 | 3 | 0.04% | 0.05% | 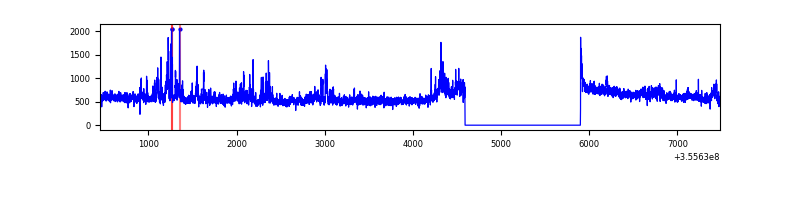 |
| D | 7031 | 5722 | 723 | 723 | 10.28% | 12.64% | 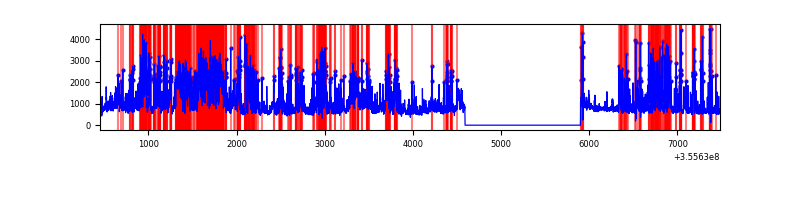 |
Top three noisy pixels from each quadrant. If the there are fewer than three noisy pixels in the level2.evt file, extra rows are filled as -1
| Pixel properties | Quadrant properties | ||||||
|---|---|---|---|---|---|---|---|
| Quadrant | DetID | PixID | Counts | Sigma | Mean | Median | Sigma |
| A | 12 | 96 | 12135 | 71.97 | 804 | 790 | 157.6 |
| A | 13 | 254 | 11349 | 66.99 | 804 | 790 | 157.6 |
| A | 15 | 174 | 10366 | 60.75 | 804 | 790 | 157.6 |
| B | 6 | 159 | 1630267 | 11480.34 | 778 | 761 | 141.9 |
| B | 0 | 190 | 47029 | 325.97 | 778 | 761 | 141.9 |
| B | 12 | 111 | 16182 | 108.65 | 778 | 761 | 141.9 |
| C | 3 | 233 | 465796 | 2722.86 | 750 | 758 | 170.8 |
| C | 14 | 238 | 125185 | 728.54 | 750 | 758 | 170.8 |
| C | 2 | 114 | 13408 | 74.07 | 750 | 758 | 170.8 |
| D | 7 | 80 | 3077840 | 17856.54 | 740 | 725 | 172.3 |
| D | 8 | 195 | 362671 | 2100.38 | 740 | 725 | 172.3 |
| D | 13 | 138 | 152210 | 879.07 | 740 | 725 | 172.3 |
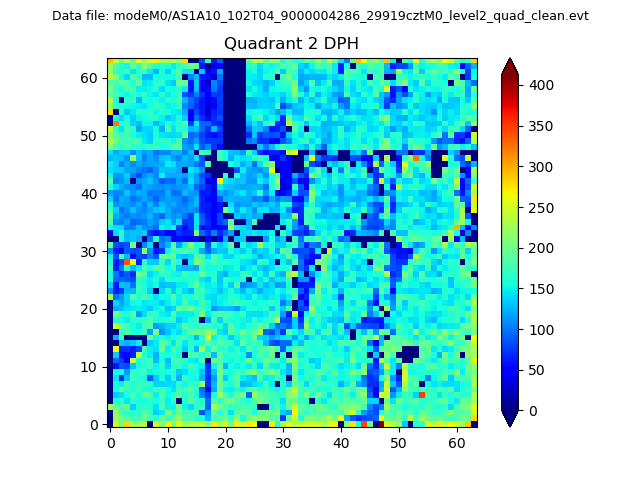
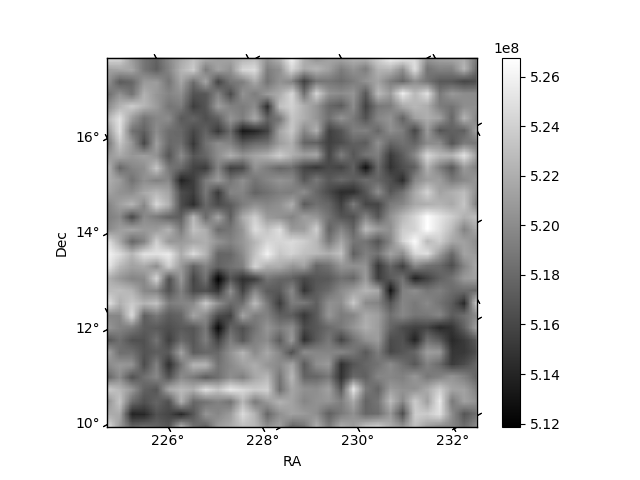
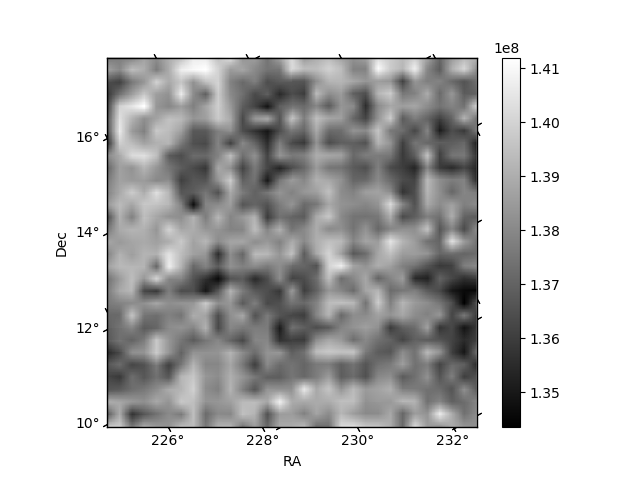
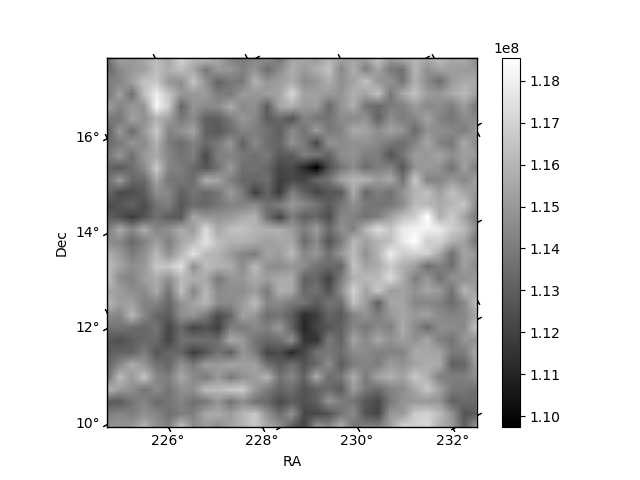
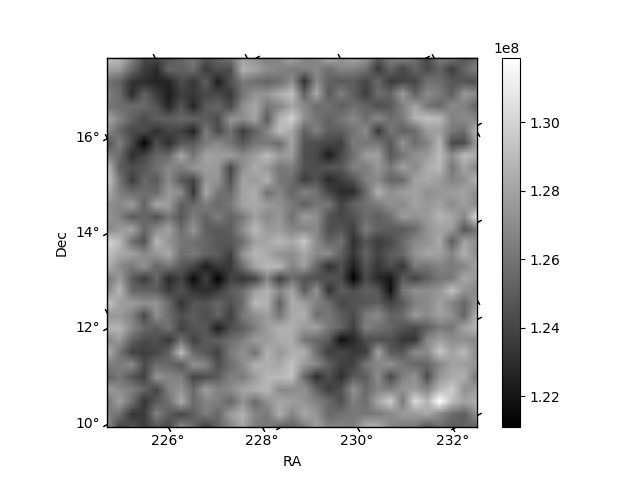
Histogram calculated using DETX and DETY for each event in the final _common_clean file
| Quadrant A | 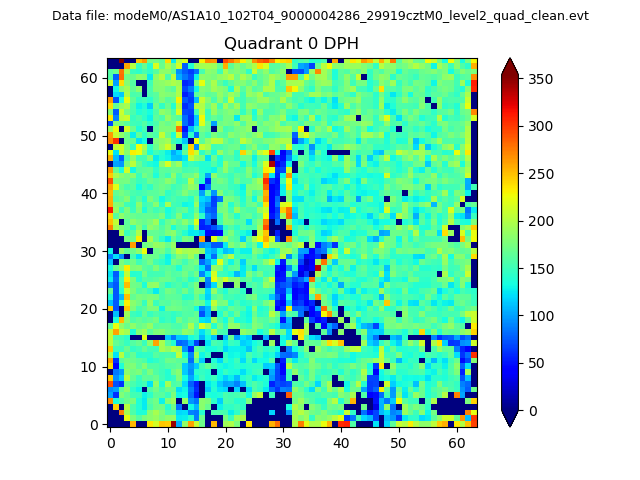 |
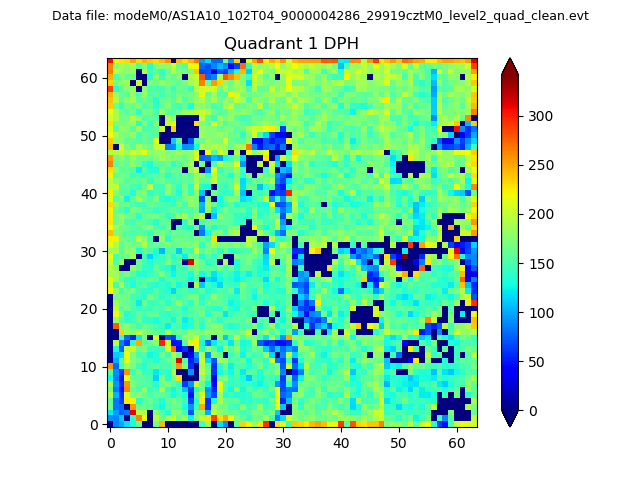 |
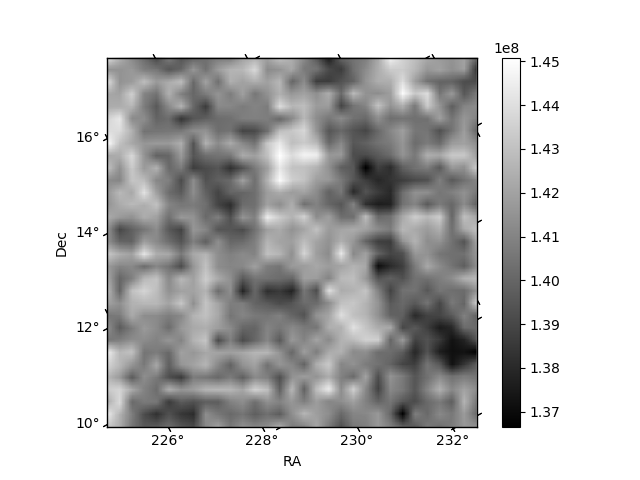
Quadrant B |
|---|---|---|---|
| Quadrant D | 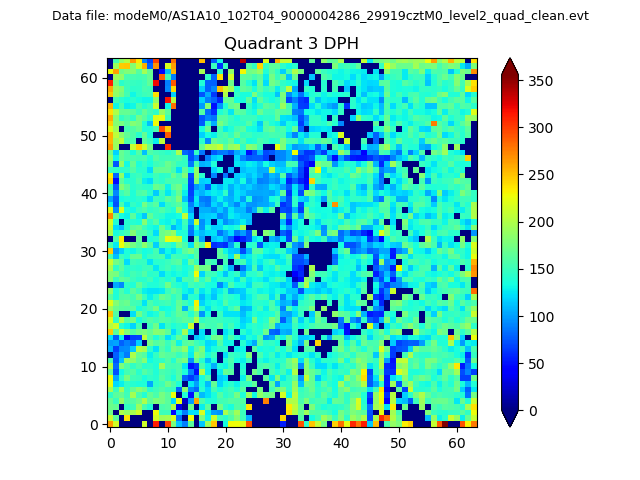 |
 |
Quadrant C |
| Plot type | Count rate plots | Images |
|---|---|---|
| Comparison with Poisson distribution Blue bars denote a histogram of data divided into 1 sec bins. Red curve is a Poisson curve with rate = median count rate of data. |
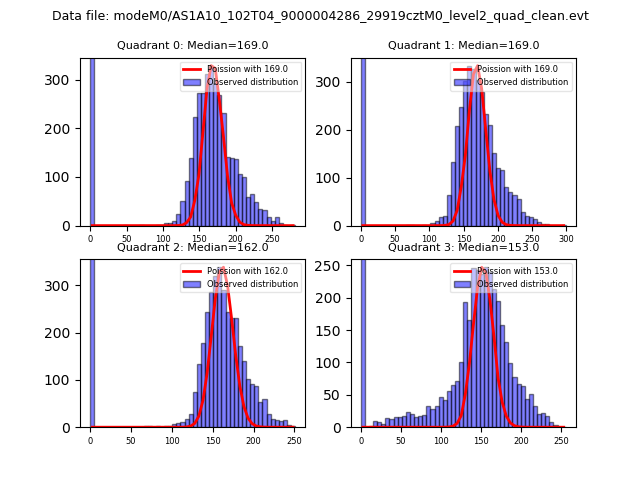 |
 |
| Quadrant-wise count rates Data is divided into 100 sec bins |
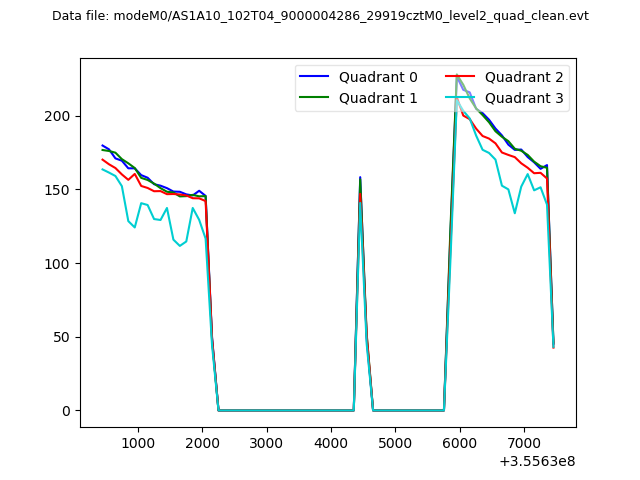 |
|
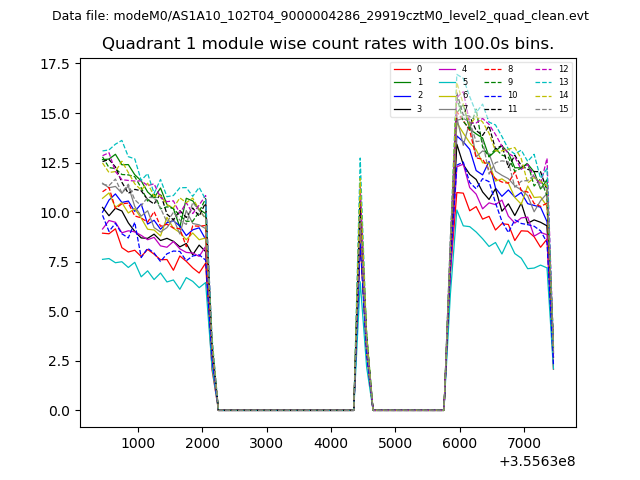
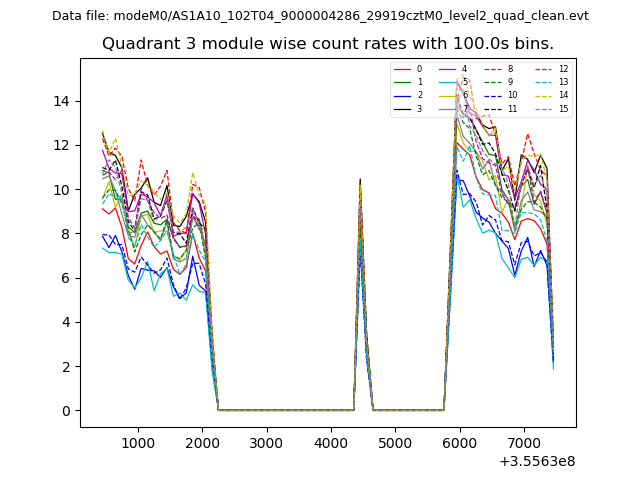
| Module-wise count rates for Quadrant A Data is divided into 100 sec bins |
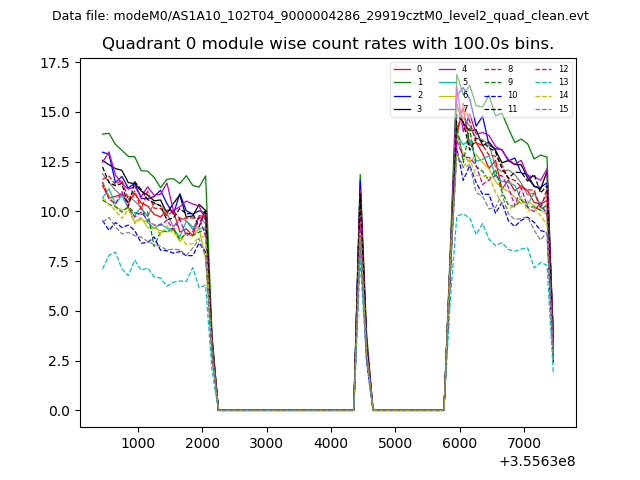 |
 |
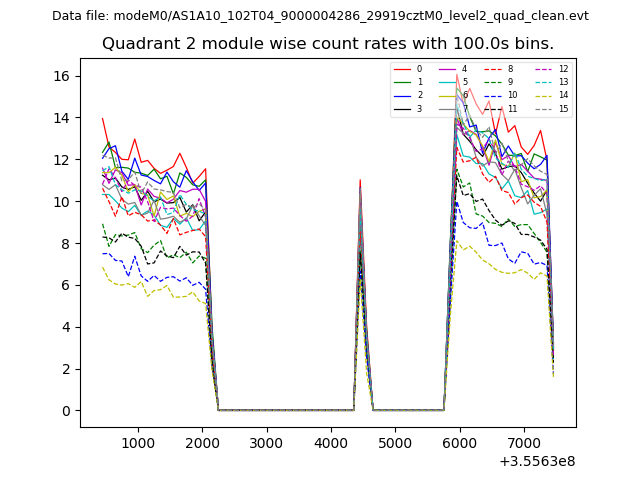
| Module-wise count rates for Quadrant B Data is divided into 100 sec bins |
 |
 |
| Module-wise count rates for Quadrant C Data is divided into 100 sec bins |
 |
 |
| Module-wise count rates for Quadrant D Data is divided into 100 sec bins |
 |
 |
| Parameter | Plot |
|---|---|
| CZT HV Monitor | 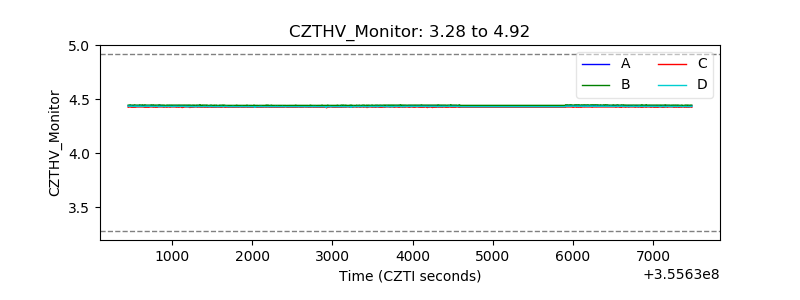 |
| D_VDD | 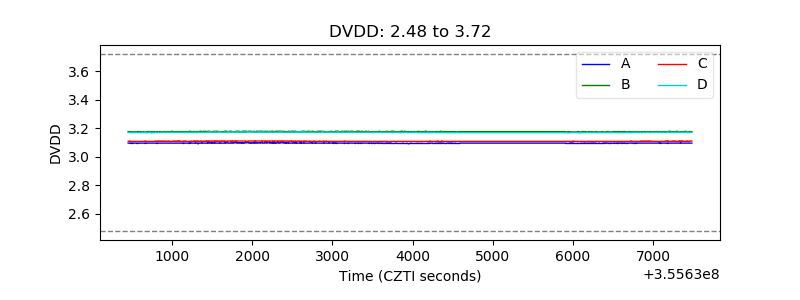 |
| Temperature 1 | 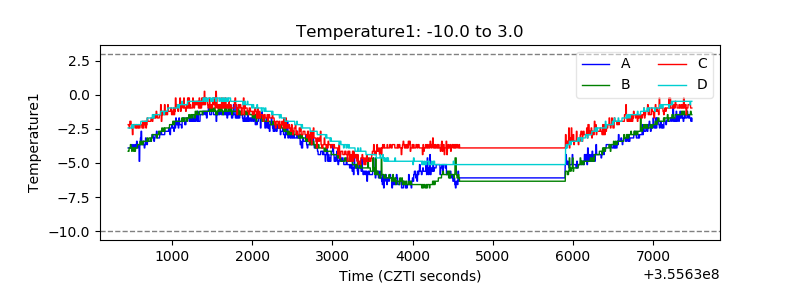 |
| Veto HV Monitor | 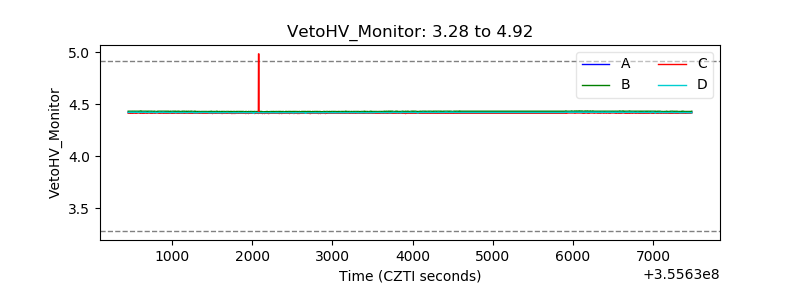 |
| Veto LLD | 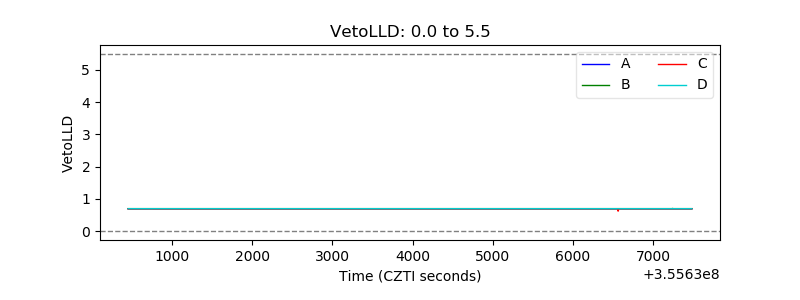 |
| Alpha Counter | 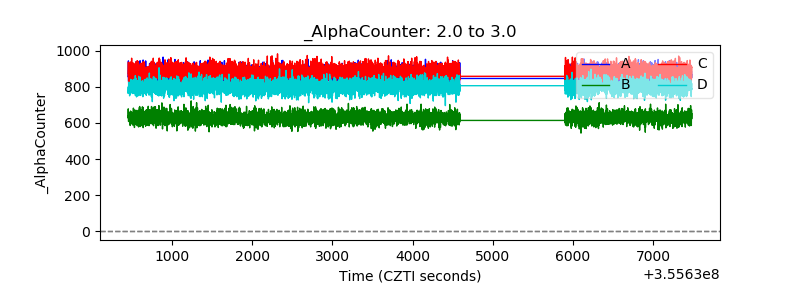 |
| _CPM_Rate | 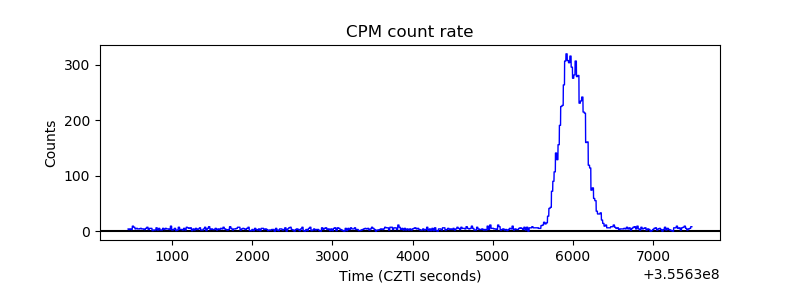 |
| CZT Counter | 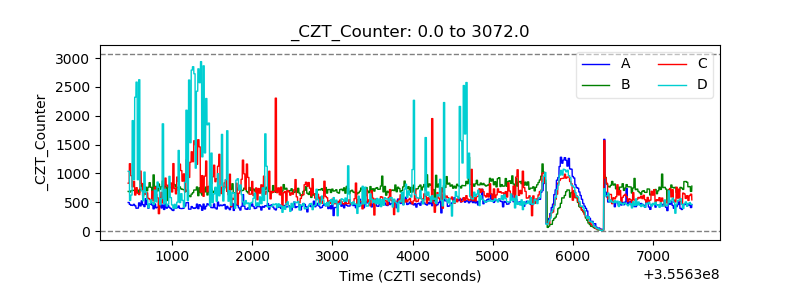 |
| +2.5 Volts monitor |  |
| +5 Volts monitor |  |
| _ROLL_ROT | 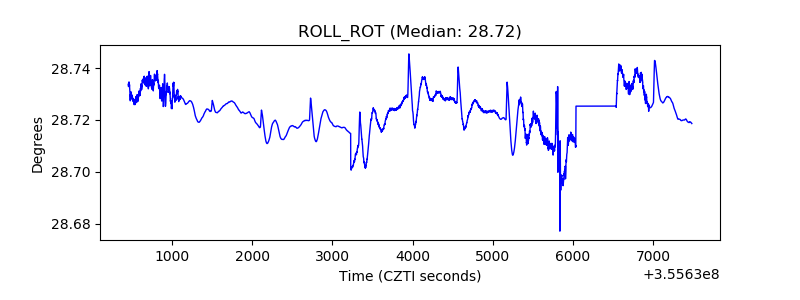 |
| _Roll_DEC | 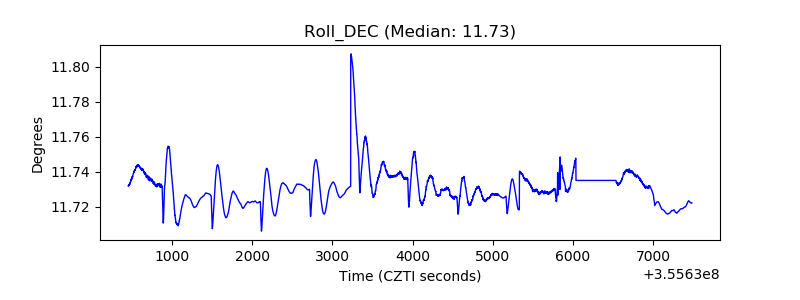 |
| _Roll_RA | 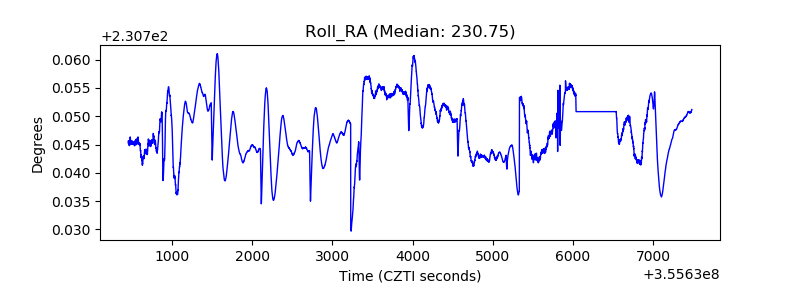 |
| Veto Counter | 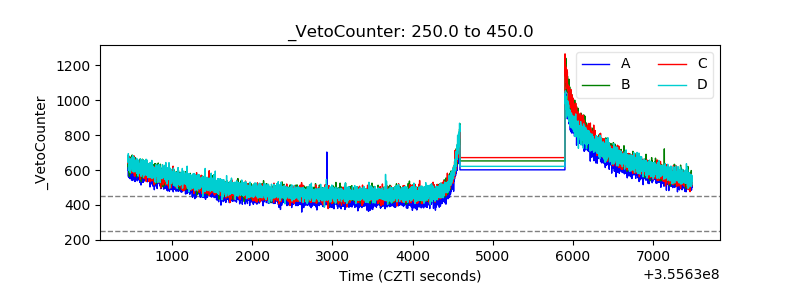 |