| Param | Original file | Final file |
|---|---|---|
| Filename | modeM0/AS1A10_053T05_9000004296cztM0_level2.fits | modeM0/AS1A10_053T05_9000004296cztM0_level2_quad_clean.evt |
| Size (bytes) | 90,829,440 | 33,575,040 |
| Size | 86.6 MB | 32.0 MB |
| Events in quadrant A | 606,228 | 125,499 |
| Events in quadrant B | 560,108 | 120,730 |
| Events in quadrant C | 527,214 | 110,773 |
| Events in quadrant D | 504,636 | 105,526 |
| Mode M0 | |||
|---|---|---|---|
| Quadrant | BADHDUFLAG | Total packets | Discarded packets |
| A | 0 | 17431 | 0 |
| B | 0 | 24186 | 0 |
| C | 0 | 23063 | 0 |
| D | 0 | 19500 | 0 |
| Mode SS | |||
|---|---|---|---|
| Quadrant | BADHDUFLAG | Total packets | Discarded packets |
| A | 0 | 162 | 0 |
| B | 0 | 162 | 0 |
| C | 0 | 162 | 0 |
| D | 0 | 162 | 0 |
| Mode M9 | |||
|---|---|---|---|
| Quadrant | BADHDUFLAG | Total packets | Discarded packets |
| A | 0 | 13 | 0 |
| B | 0 | 13 | 0 |
| C | 0 | 13 | 0 |
| D | 0 | 13 | 0 |
| Quadrant | Total seconds | Saturated seconds | Saturation percentage |
|---|---|---|---|
| A | 7947 | 99 | 1.245753% |
| B | 7948 | 152 | 1.912431% |
| C | 7948 | 895 | 11.260695% |
| D | 7948 | 150 | 1.887267% |
Noise dominated data is calculated using 1-second bins in cleaned event files. If a bin has >2000 counts, and if more than 50% of those come from <1% of pixels, then it is considered to be noise-dominated and hence unusable.
| Quadrant | # 1 sec bins | Bins with >0 counts | Bins with >2000 counts | High rate bins dominated by noise | Noise dominated (total time) | Noise dominated (detector-on time) | Marked lightcurve |
|---|---|---|---|---|---|---|---|
| A | 9252 | 7947 | 0 | 0 | 0.00% | 0.00% | 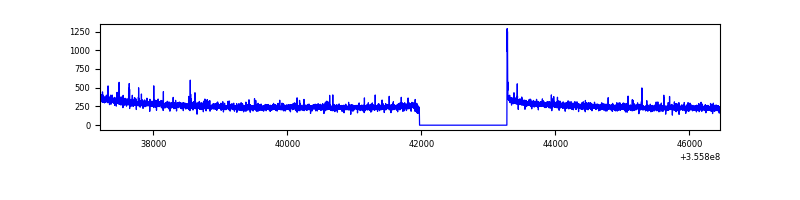 |
| B | 9253 | 7948 | 0 | 0 | 0.00% | 0.00% | 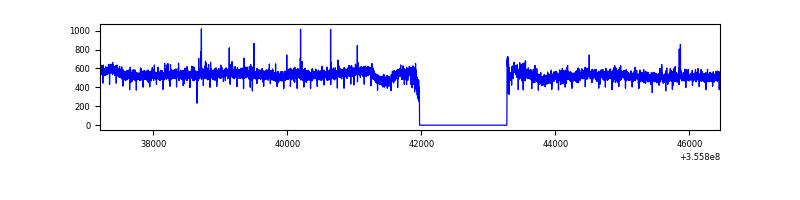 |
| C | 9253 | 7942 | 0 | 0 | 0.00% | 0.00% |  |
| D | 9253 | 7948 | 0 | 0 | 0.00% | 0.00% | 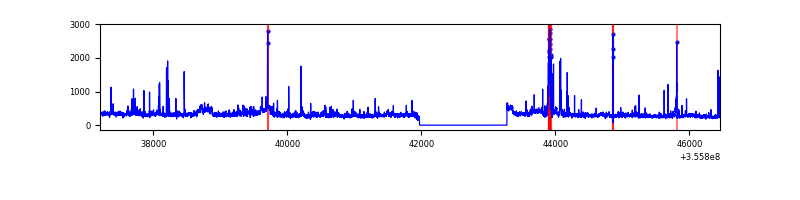 |
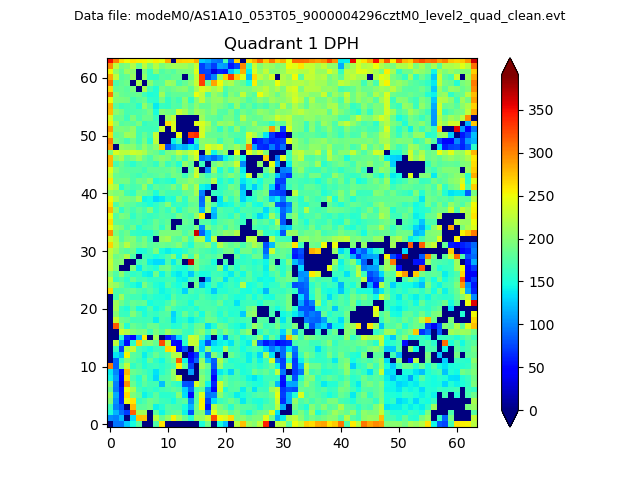
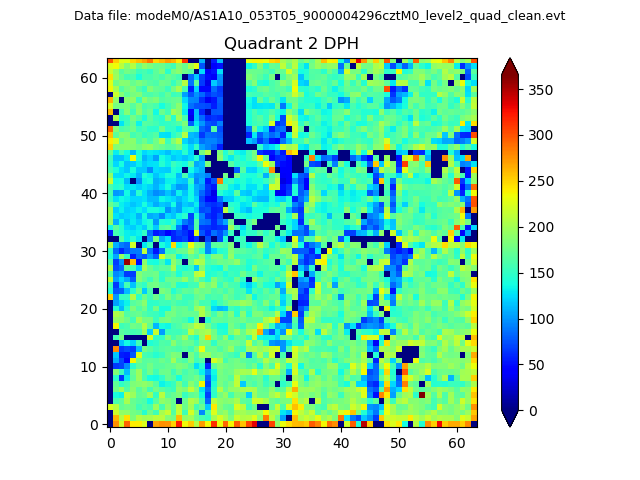
Top three noisy pixels from each quadrant. If the there are fewer than three noisy pixels in the level2.evt file, extra rows are filled as -1
| Pixel properties | Quadrant properties | ||||||
|---|---|---|---|---|---|---|---|
| Quadrant | DetID | PixID | Counts | Sigma | Mean | Median | Sigma |
| A | 0 | 29 | 549 | 10.1 | 158 | 152 | 39.3 |
| A | 7 | 110 | 478 | 8.29 | 158 | 152 | 39.3 |
| A | 14 | 79 | 438 | 7.27 | 158 | 152 | 39.3 |
| B | 2 | 9 | 405 | 8.54 | 148 | 143 | 30.7 |
| B | 5 | 128 | 386 | 7.92 | 148 | 143 | 30.7 |
| B | 5 | 232 | 365 | 7.23 | 148 | 143 | 30.7 |
| C | 1 | 81 | 399 | 7.36 | 139 | 133 | 36.1 |
| C | 3 | 202 | 398 | 7.33 | 139 | 133 | 36.1 |
| C | 1 | 80 | 393 | 7.2 | 139 | 133 | 36.1 |
| D | 10 | 189 | 393 | 6.65 | 144 | 133 | 39.1 |
| D | 6 | 67 | 381 | 6.35 | 144 | 133 | 39.1 |
| D | 15 | 46 | 367 | 5.99 | 144 | 133 | 39.1 |
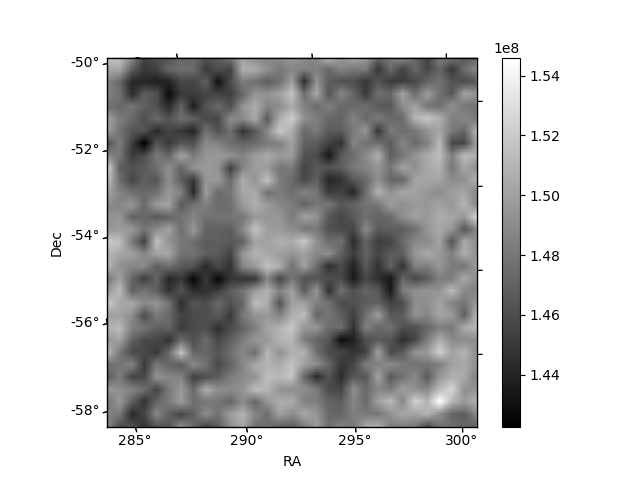
Histogram calculated using DETX and DETY for each event in the final _common_clean file
| Quadrant A | 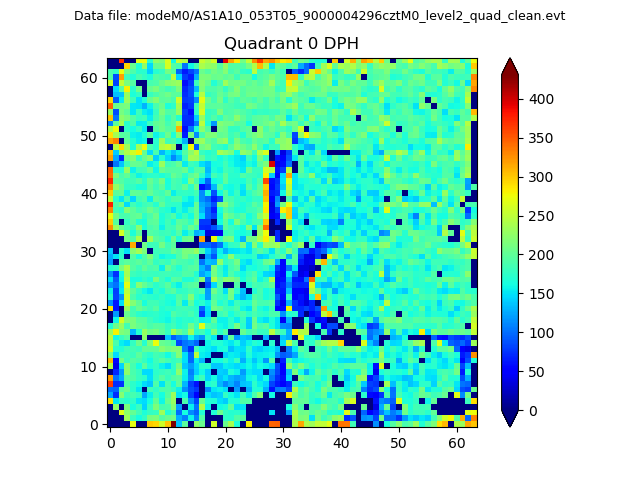 |
 |
Quadrant B |
|---|---|---|---|
| Quadrant D |  |
 |
Quadrant C |
| Plot type | Count rate plots | Images |
|---|---|---|
| Comparison with Poisson distribution Blue bars denote a histogram of data divided into 1 sec bins. Red curve is a Poisson curve with rate = median count rate of data. |
 |
 |
| Quadrant-wise count rates Data is divided into 100 sec bins |
 |
|
| Module-wise count rates for Quadrant A Data is divided into 100 sec bins |
 |
 |
| Module-wise count rates for Quadrant B Data is divided into 100 sec bins |
 |
 |
| Module-wise count rates for Quadrant C Data is divided into 100 sec bins |
 |
 |
| Module-wise count rates for Quadrant D Data is divided into 100 sec bins |
 |
 |
| Parameter | Plot |
|---|---|
| CZT HV Monitor |  |
| D_VDD |  |
| Temperature 1 | 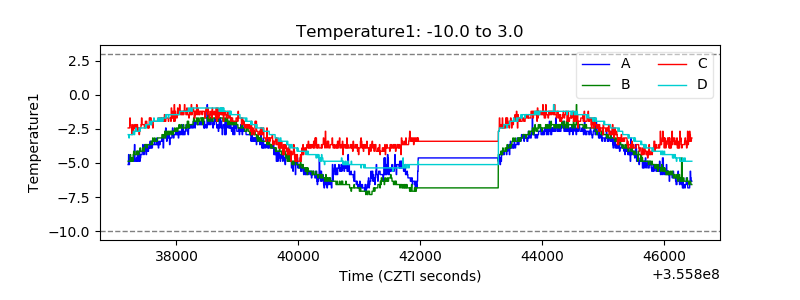 |
| Veto HV Monitor |  |
| Veto LLD |  |
| Alpha Counter | 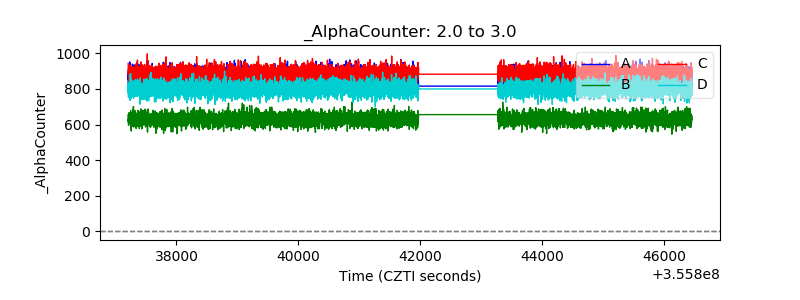 |
| _CPM_Rate |  |
| CZT Counter |  |
| +2.5 Volts monitor |  |
| +5 Volts monitor |  |
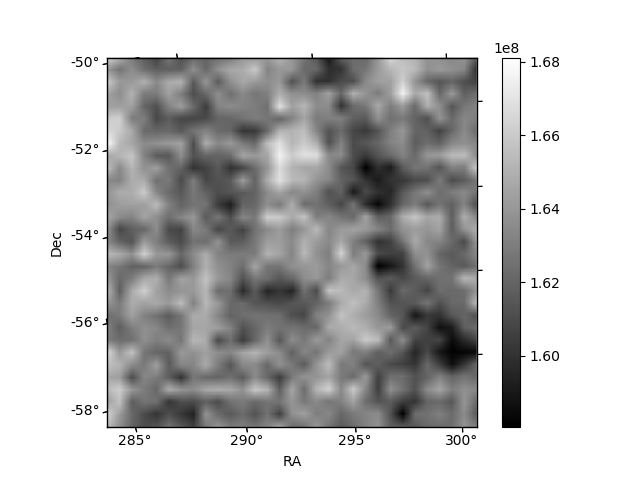
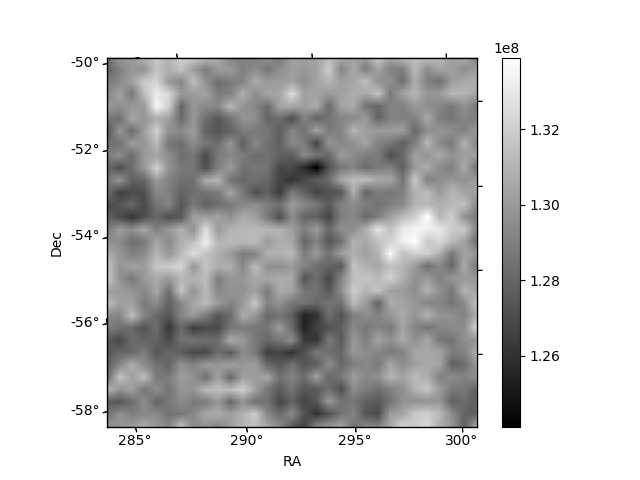
| _ROLL_ROT |  |
| _Roll_DEC |  |
| _Roll_RA |  |
| Veto Counter |  |