| Param | Original file | Final file |
|---|---|---|
| Filename | modeM0/AS1A10_053T05_9000004296_29935cztM0_level2.evt | modeM0/AS1A10_053T05_9000004296_29935cztM0_level2_quad_clean.evt |
| Size (bytes) | 600,243,840 | 85,844,160 |
| Size | 572.4 MB | 81.9 MB |
| Events in quadrant A | 3,487,592 | 564,898 |
| Events in quadrant B | 5,236,238 | 559,837 |
| Events in quadrant C | 5,050,525 | 509,857 |
| Events in quadrant D | 3,974,551 | 521,832 |
| Mode M0 | |||
|---|---|---|---|
| Quadrant | BADHDUFLAG | Total packets | Discarded packets |
| A | 0 | 14207 | 1 |
| B | 0 | 19386 | 1 |
| C | 0 | 19325 | 1 |
| D | 0 | 16068 | 1 |
| Mode SS | |||
|---|---|---|---|
| Quadrant | BADHDUFLAG | Total packets | Discarded packets |
| A | 0 | 130 | 0 |
| B | 0 | 130 | 0 |
| C | 0 | 130 | 0 |
| D | 0 | 130 | 0 |
| Mode M9 | |||
|---|---|---|---|
| Quadrant | BADHDUFLAG | Total packets | Discarded packets |
| A | 0 | 13 | 0 |
| B | 0 | 13 | 0 |
| C | 0 | 13 | 0 |
| D | 0 | 13 | 0 |
| Quadrant | Total seconds | Saturated seconds | Saturation percentage |
|---|---|---|---|
| A | 6344 | 98 | 1.544767% |
| B | 6345 | 149 | 2.348306% |
| C | 6345 | 864 | 13.617021% |
| D | 6345 | 140 | 2.206462% |
Noise dominated data is calculated using 1-second bins in cleaned event files. If a bin has >2000 counts, and if more than 50% of those come from <1% of pixels, then it is considered to be noise-dominated and hence unusable.
| Quadrant | # 1 sec bins | Bins with >0 counts | Bins with >2000 counts | High rate bins dominated by noise | Noise dominated (total time) | Noise dominated (detector-on time) | Marked lightcurve |
|---|---|---|---|---|---|---|---|
| A | 7649 | 6345 | 0 | 0 | 0.00% | 0.00% | 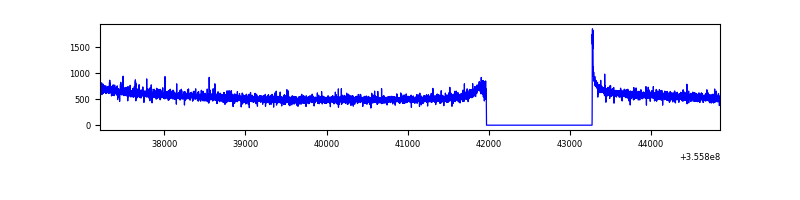 |
| B | 7650 | 6346 | 1 | 1 | 0.01% | 0.02% | 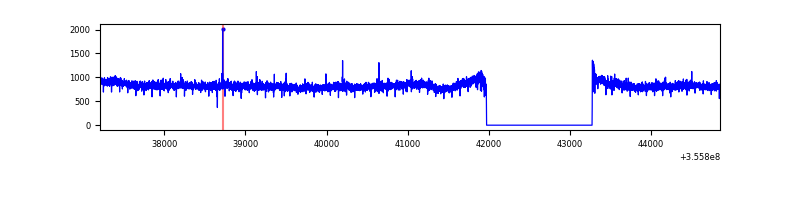 |
| C | 7650 | 6346 | 359 | 359 | 4.69% | 5.66% | 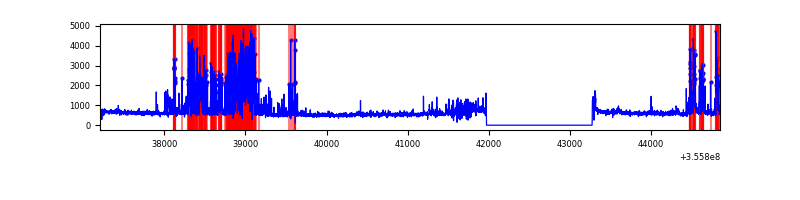 |
| D | 7650 | 6346 | 49 | 49 | 0.64% | 0.77% | 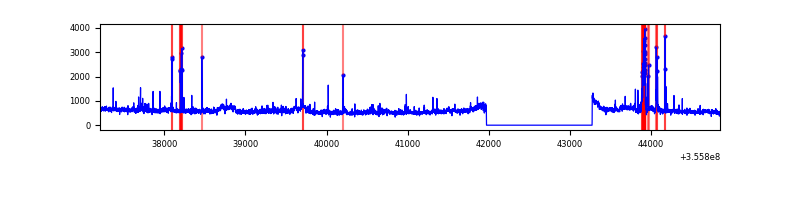 |
Top three noisy pixels from each quadrant. If the there are fewer than three noisy pixels in the level2.evt file, extra rows are filled as -1
| Pixel properties | Quadrant properties | ||||||
|---|---|---|---|---|---|---|---|
| Quadrant | DetID | PixID | Counts | Sigma | Mean | Median | Sigma |
| A | 13 | 254 | 12256 | 64.6 | 899 | 885 | 176.0 |
| A | 8 | 192 | 11691 | 61.39 | 899 | 885 | 176.0 |
| A | 12 | 96 | 8644 | 44.08 | 899 | 885 | 176.0 |
| B | 6 | 159 | 1797826 | 11110.71 | 874 | 856 | 161.7 |
| B | 12 | 111 | 18650 | 110.02 | 874 | 856 | 161.7 |
| B | 11 | 111 | 17157 | 100.79 | 874 | 856 | 161.7 |
| C | 15 | 208 | 1389257 | 7713.67 | 793 | 803 | 180.0 |
| C | 3 | 233 | 277656 | 1538.08 | 793 | 803 | 180.0 |
| C | 14 | 238 | 187431 | 1036.83 | 793 | 803 | 180.0 |
| D | 8 | 195 | 403021 | 2031.66 | 857 | 838 | 198.0 |
| D | 2 | 250 | 196408 | 987.94 | 857 | 838 | 198.0 |
| D | 1 | 52 | 28105 | 137.74 | 857 | 838 | 198.0 |
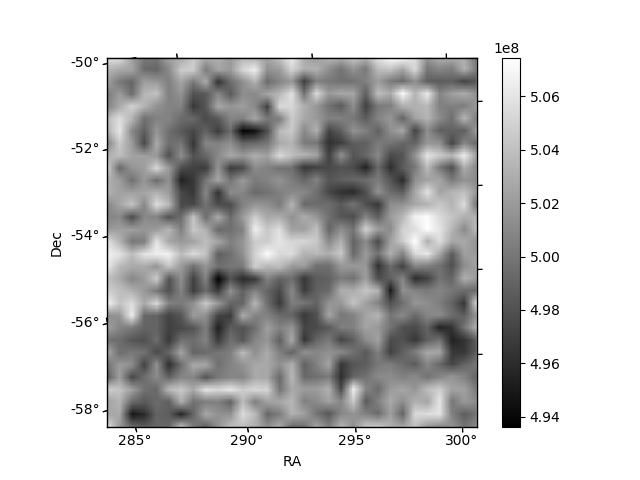
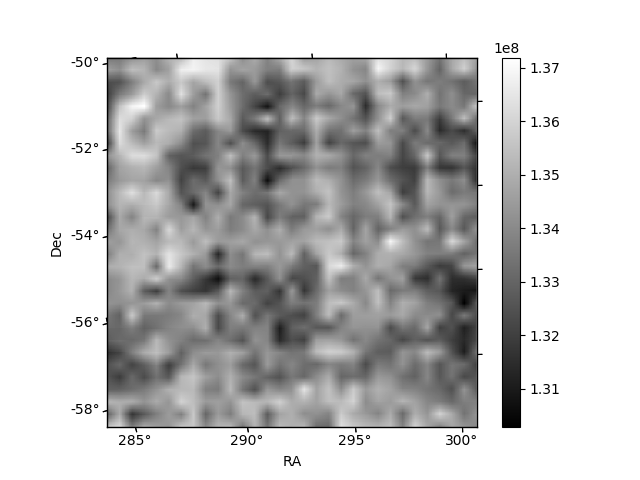
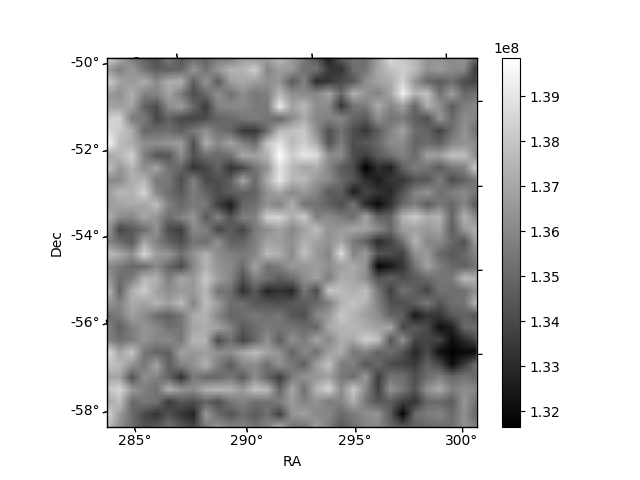
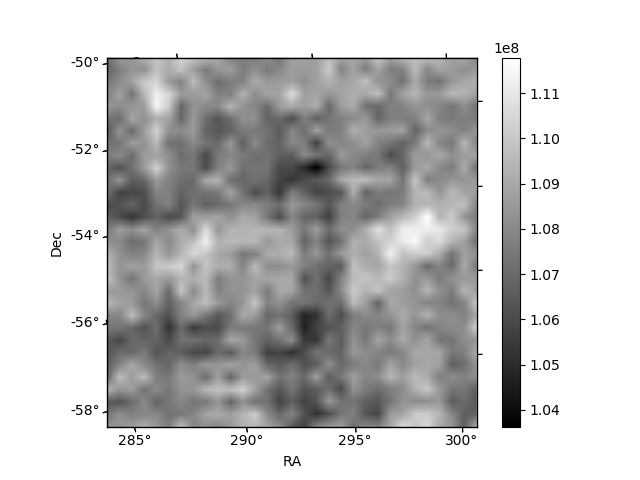
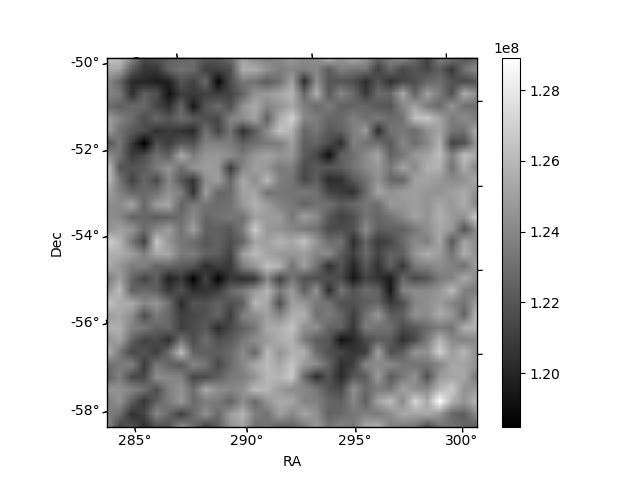
Histogram calculated using DETX and DETY for each event in the final _common_clean file
| Quadrant A | 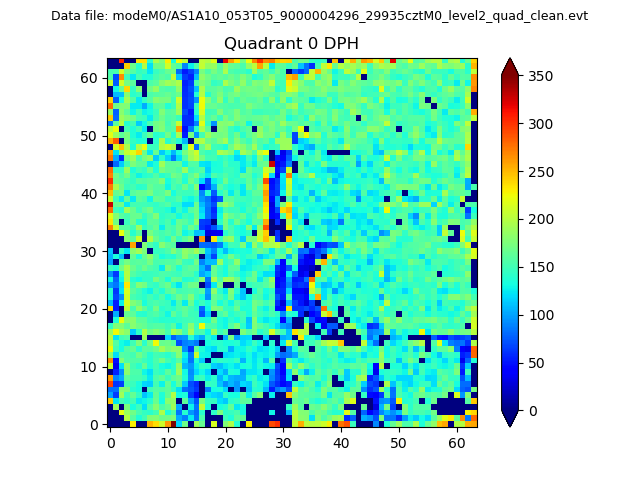 |
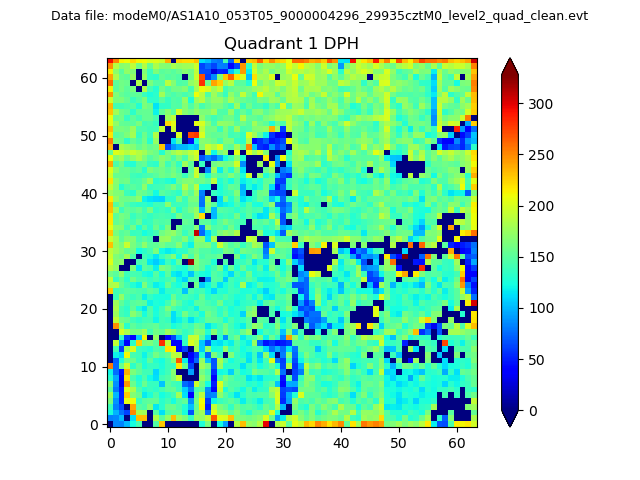 |
Quadrant B |
|---|---|---|---|
| Quadrant D | 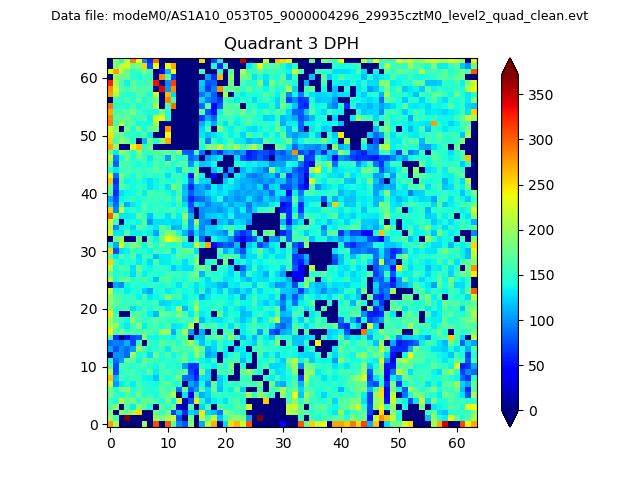 |
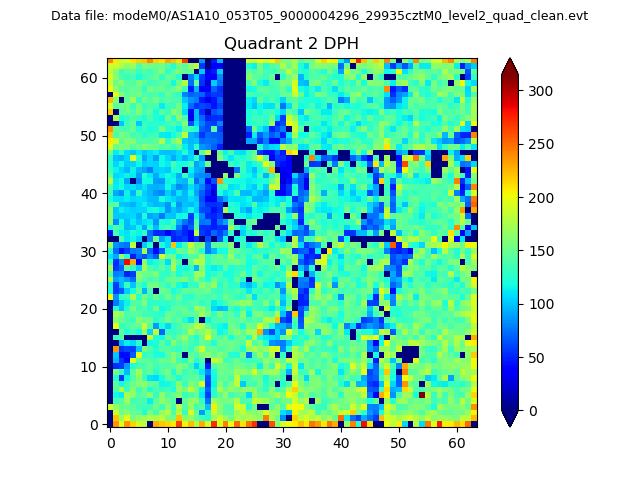 |
Quadrant C |
| Plot type | Count rate plots | Images |
|---|---|---|
| Comparison with Poisson distribution Blue bars denote a histogram of data divided into 1 sec bins. Red curve is a Poisson curve with rate = median count rate of data. |
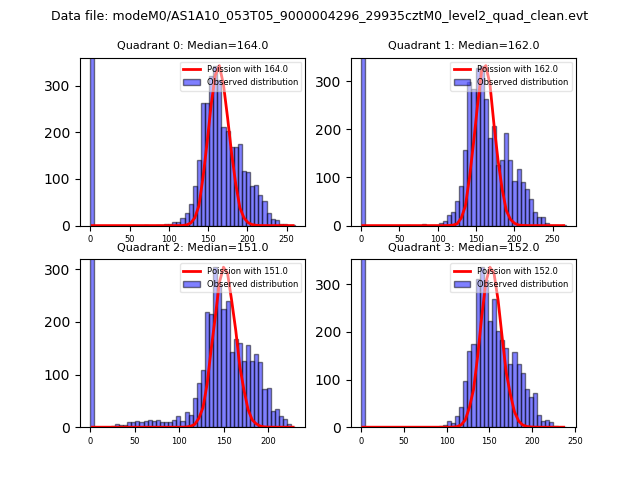 |
 |
| Quadrant-wise count rates Data is divided into 100 sec bins |
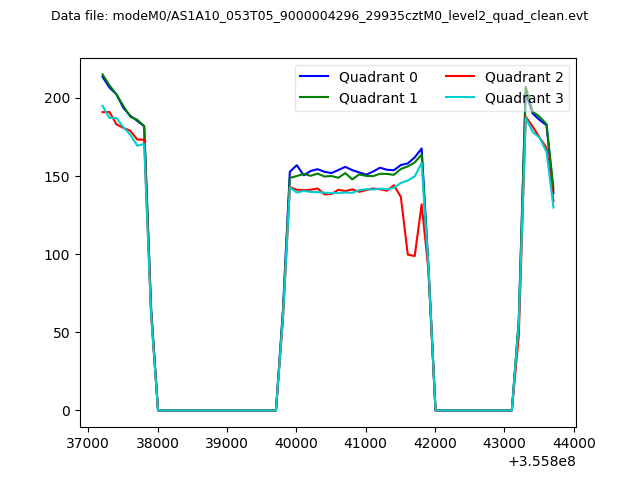 |
|
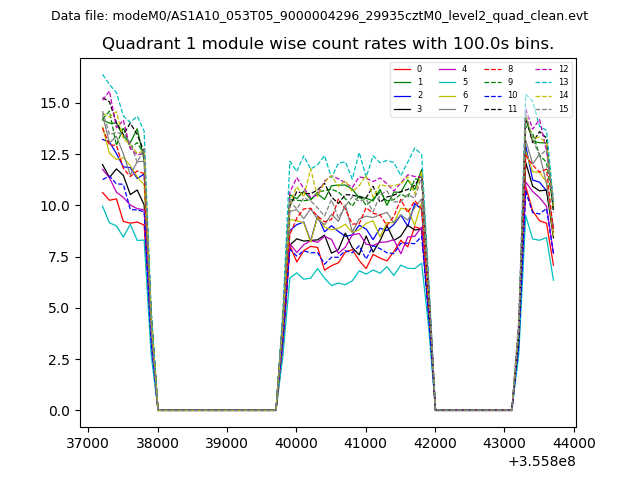
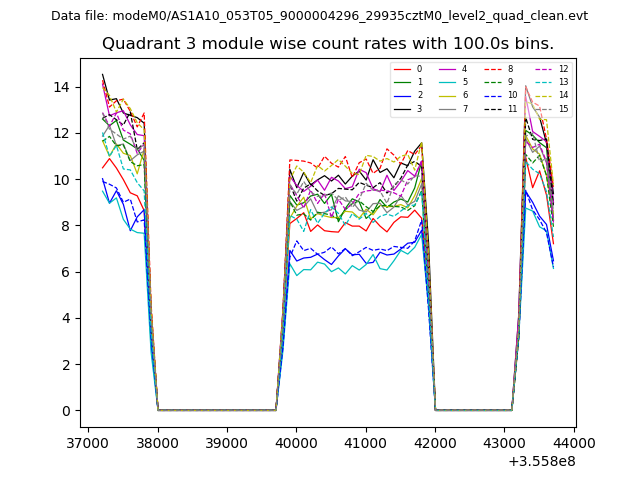
| Module-wise count rates for Quadrant A Data is divided into 100 sec bins |
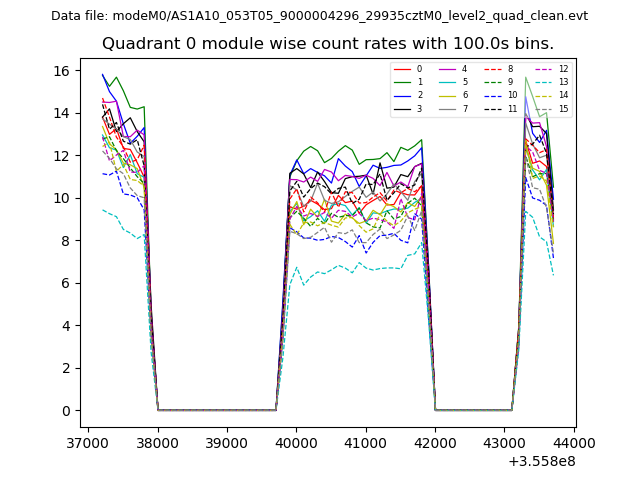 |
 |
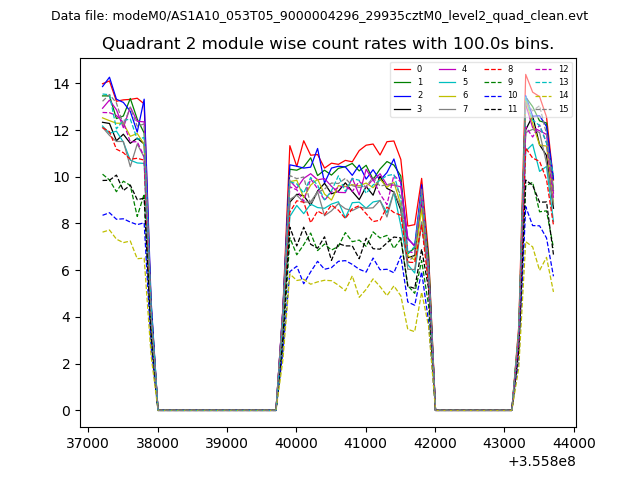
| Module-wise count rates for Quadrant B Data is divided into 100 sec bins |
 |
 |
| Module-wise count rates for Quadrant C Data is divided into 100 sec bins |
 |
 |
| Module-wise count rates for Quadrant D Data is divided into 100 sec bins |
 |
 |
| Parameter | Plot |
|---|---|
| CZT HV Monitor | 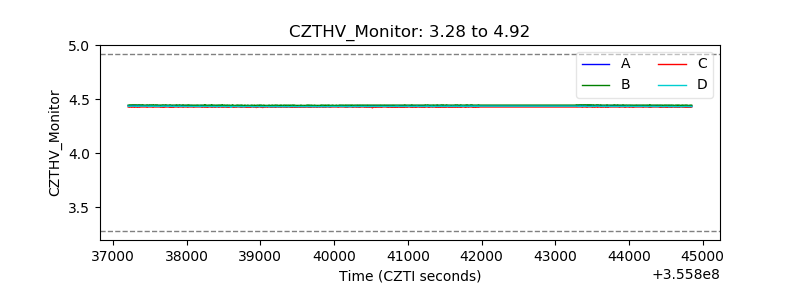 |
| D_VDD | 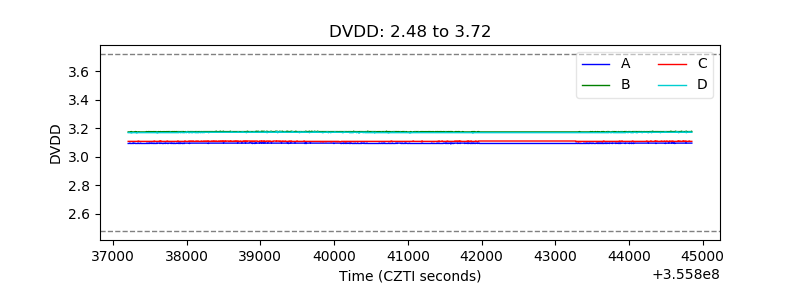 |
| Temperature 1 | 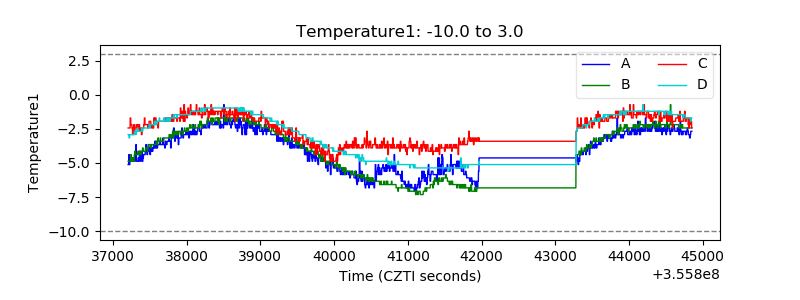 |
| Veto HV Monitor | 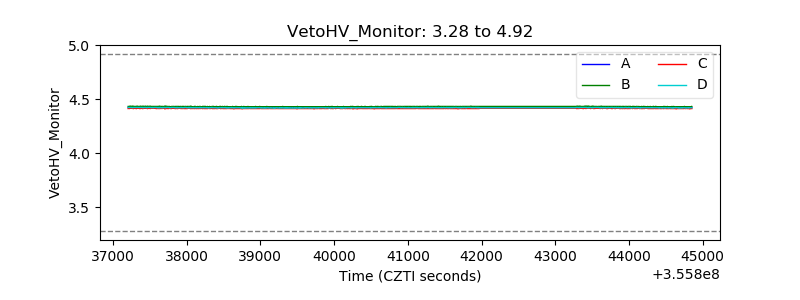 |
| Veto LLD | 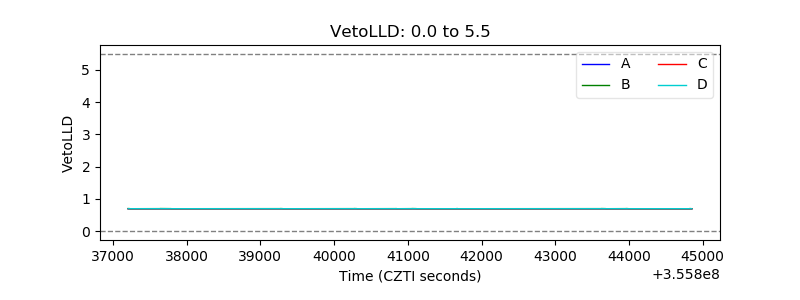 |
| Alpha Counter | 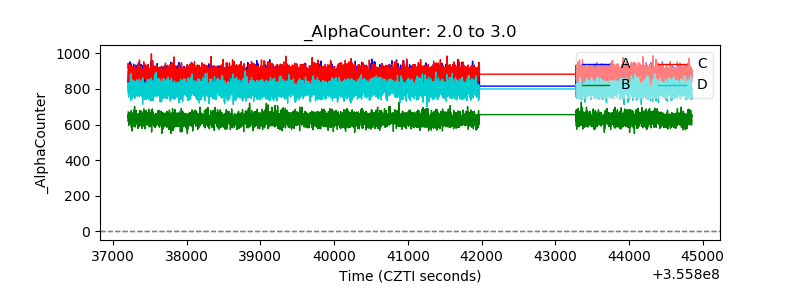 |
| _CPM_Rate | 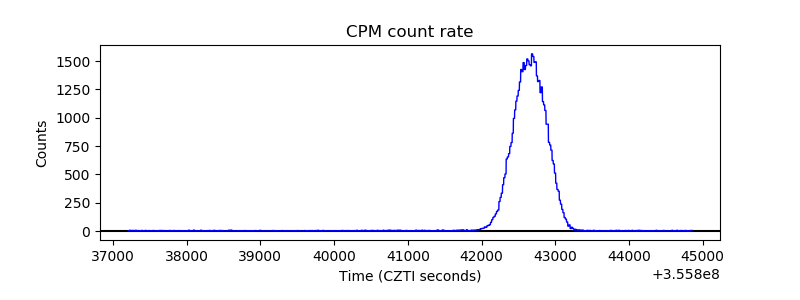 |
| CZT Counter | 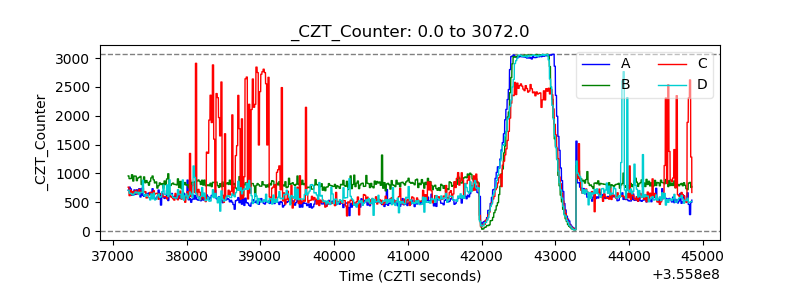 |
| +2.5 Volts monitor | 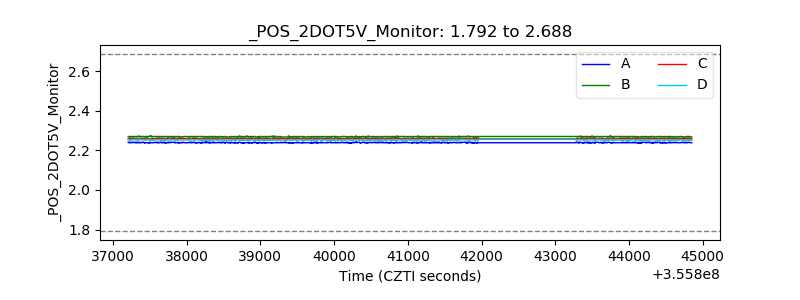 |
| +5 Volts monitor | 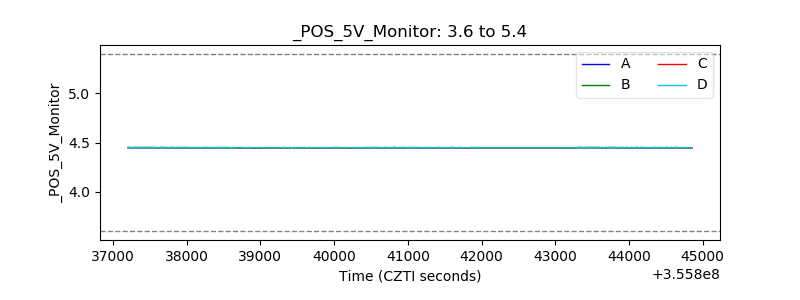 |
| _ROLL_ROT | 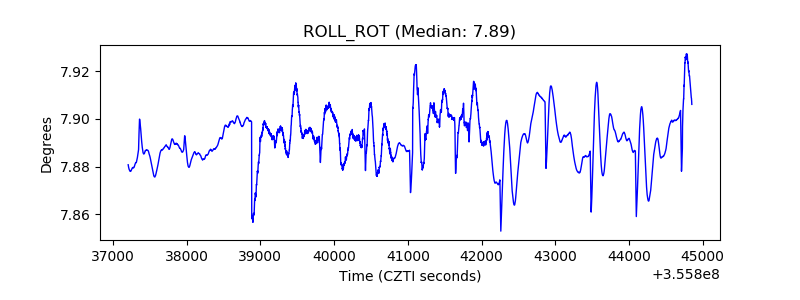 |
| _Roll_DEC | 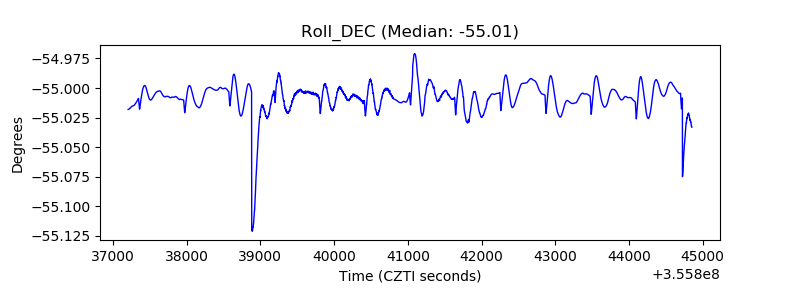 |
| _Roll_RA | 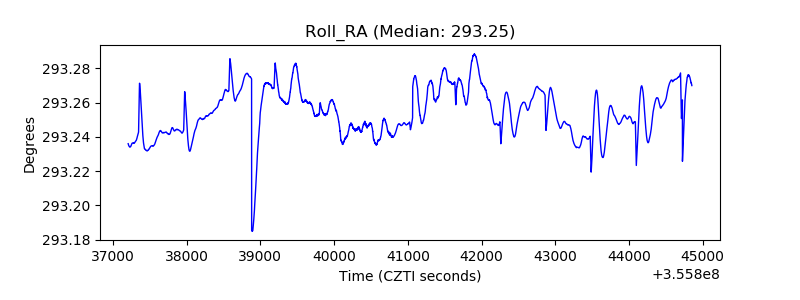 |
| Veto Counter | 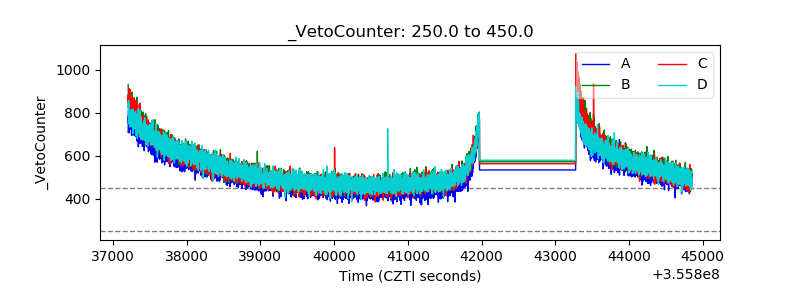 |