| Param | Original file | Final file |
|---|---|---|
| Filename | modeM0/AS1A10_058T01_9000004298cztM0_level2.fits | modeM0/AS1A10_058T01_9000004298cztM0_level2_quad_clean.evt |
| Size (bytes) | 1,567,402,560 | 1,287,532,800 |
| Size | 1.5 GB | 1.2 GB |
| Events in quadrant A | 9,991,388 | 7,664,754 |
| Events in quadrant B | 9,170,636 | 7,399,152 |
| Events in quadrant C | 9,177,992 | 6,694,929 |
| Events in quadrant D | 8,455,862 | 6,564,974 |
| Mode M9 | |||
|---|---|---|---|
| Quadrant | BADHDUFLAG | Total packets | Discarded packets |
| A | 0 | 246 | 0 |
| B | 0 | 246 | 0 |
| C | 0 | 246 | 0 |
| D | 0 | 246 | 0 |
| Mode M0 | |||
|---|---|---|---|
| Quadrant | BADHDUFLAG | Total packets | Discarded packets |
| A | 0 | 327425 | 0 |
| B | 0 | 488642 | 0 |
| C | 0 | 463356 | 0 |
| D | 0 | 385287 | 0 |
| Mode SS | |||
|---|---|---|---|
| Quadrant | BADHDUFLAG | Total packets | Discarded packets |
| A | 0 | 3182 | 0 |
| B | 0 | 3182 | 0 |
| C | 0 | 3182 | 0 |
| D | 0 | 3182 | 0 |
| Quadrant | Total seconds | Saturated seconds | Saturation percentage |
|---|---|---|---|
| A | 155651 | 1995 | 1.281714% |
| B | 155651 | 4968 | 3.191756% |
| C | 155651 | 14664 | 9.421077% |
| D | 155651 | 3946 | 2.535159% |
Noise dominated data is calculated using 1-second bins in cleaned event files. If a bin has >2000 counts, and if more than 50% of those come from <1% of pixels, then it is considered to be noise-dominated and hence unusable.
| Quadrant | # 1 sec bins | Bins with >0 counts | Bins with >2000 counts | High rate bins dominated by noise | Noise dominated (total time) | Noise dominated (detector-on time) | Marked lightcurve |
|---|---|---|---|---|---|---|---|
| A | 180782 | 155651 | 0 | 0 | 0.00% | 0.00% |  |
| B | 180782 | 155643 | 0 | 0 | 0.00% | 0.00% |  |
| C | 180782 | 155635 | 0 | 0 | 0.00% | 0.00% |  |
| D | 180782 | 155623 | 0 | 0 | 0.00% | 0.00% |  |
Top three noisy pixels from each quadrant. If the there are fewer than three noisy pixels in the level2.evt file, extra rows are filled as -1
| Pixel properties | Quadrant properties | ||||||
|---|---|---|---|---|---|---|---|
| Quadrant | DetID | PixID | Counts | Sigma | Mean | Median | Sigma |
| A | 0 | 29 | 9594 | 11.52 | 2603 | 2457 | 619.8 |
| A | 7 | 110 | 7674 | 8.42 | 2603 | 2457 | 619.8 |
| A | 0 | 30 | 7368 | 7.92 | 2603 | 2457 | 619.8 |
| B | 2 | 9 | 7197 | 10.4 | 2430 | 2331 | 468.0 |
| B | 3 | 17 | 6071 | 7.99 | 2430 | 2331 | 468.0 |
| B | 2 | 8 | 6070 | 7.99 | 2430 | 2331 | 468.0 |
| C | 3 | 187 | 6358 | 6.72 | 2428 | 2284 | 606.0 |
| C | 12 | 241 | 6314 | 6.65 | 2428 | 2284 | 606.0 |
| C | 3 | 126 | 6258 | 6.56 | 2428 | 2284 | 606.0 |
| D | 15 | 46 | 6361 | 6.54 | 2422 | 2216 | 633.8 |
| D | 10 | 189 | 5986 | 5.95 | 2422 | 2216 | 633.8 |
| D | 6 | 67 | 5864 | 5.76 | 2422 | 2216 | 633.8 |
Histogram calculated using DETX and DETY for each event in the final _common_clean file
| Quadrant A | 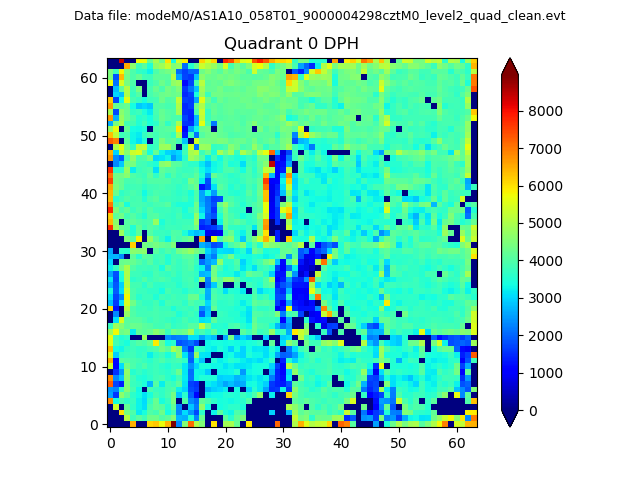 |
 |
Quadrant B |
|---|---|---|---|
| Quadrant D |  |
 |
Quadrant C |
| Plot type | Count rate plots | Images |
|---|---|---|
| Comparison with Poisson distribution Blue bars denote a histogram of data divided into 1 sec bins. Red curve is a Poisson curve with rate = median count rate of data. |
 |
 |
| Quadrant-wise count rates Data is divided into 100 sec bins |
 |
|
| Module-wise count rates for Quadrant A Data is divided into 100 sec bins |
 |
 |
| Module-wise count rates for Quadrant B Data is divided into 100 sec bins |
 |
 |
| Module-wise count rates for Quadrant C Data is divided into 100 sec bins |
 |
 |
| Module-wise count rates for Quadrant D Data is divided into 100 sec bins |
 |
 |
| Parameter | Plot |
|---|---|
| CZT HV Monitor |  |
| D_VDD |  |
| Temperature 1 |  |
| Veto HV Monitor |  |
| Veto LLD |  |
| Alpha Counter |  |
| _CPM_Rate |  |
| CZT Counter |  |
| +2.5 Volts monitor |  |
| +5 Volts monitor |  |
| _ROLL_ROT |  |
| _Roll_DEC |  |
| _Roll_RA |  |
| Veto Counter |  |