| Param | Original file | Final file |
|---|---|---|
| Filename | modeM0/AS1A10_058T01_9000004298_29936cztM0_level2.evt | modeM0/AS1A10_058T01_9000004298_29936cztM0_level2_quad_clean.evt |
| Size (bytes) | 260,095,680 | 41,708,160 |
| Size | 248.0 MB | 39.8 MB |
| Events in quadrant A | 1,644,633 | 270,788 |
| Events in quadrant B | 2,500,784 | 266,113 |
| Events in quadrant C | 1,710,736 | 251,433 |
| Events in quadrant D | 1,810,388 | 255,141 |
| Mode M9 | |||
|---|---|---|---|
| Quadrant | BADHDUFLAG | Total packets | Discarded packets |
| A | 0 | 12 | 0 |
| B | 0 | 12 | 0 |
| C | 0 | 12 | 0 |
| D | 0 | 12 | 0 |
| Mode M0 | |||
|---|---|---|---|
| Quadrant | BADHDUFLAG | Total packets | Discarded packets |
| A | 0 | 6644 | 1 |
| B | 0 | 9360 | 1 |
| C | 0 | 6820 | 1 |
| D | 0 | 7276 | 1 |
| Mode SS | |||
|---|---|---|---|
| Quadrant | BADHDUFLAG | Total packets | Discarded packets |
| A | 0 | 64 | 0 |
| B | 0 | 64 | 0 |
| C | 0 | 64 | 0 |
| D | 0 | 64 | 0 |
| Quadrant | Total seconds | Saturated seconds | Saturation percentage |
|---|---|---|---|
| A | 3075 | 94 | 3.056911% |
| B | 3075 | 128 | 4.162602% |
| C | 3075 | 158 | 5.138211% |
| D | 3075 | 62 | 2.016260% |
Noise dominated data is calculated using 1-second bins in cleaned event files. If a bin has >2000 counts, and if more than 50% of those come from <1% of pixels, then it is considered to be noise-dominated and hence unusable.
| Quadrant | # 1 sec bins | Bins with >0 counts | Bins with >2000 counts | High rate bins dominated by noise | Noise dominated (total time) | Noise dominated (detector-on time) | Marked lightcurve |
|---|---|---|---|---|---|---|---|
| A | 4255 | 3076 | 1 | 1 | 0.02% | 0.03% | 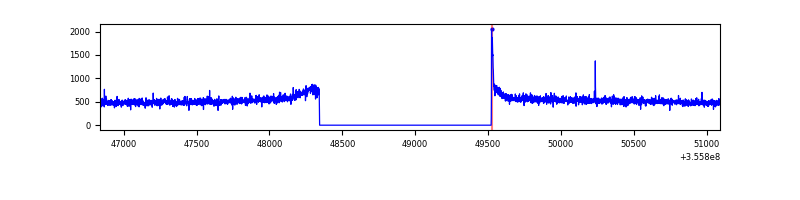 |
| B | 4255 | 3076 | 0 | 0 | 0.00% | 0.00% | 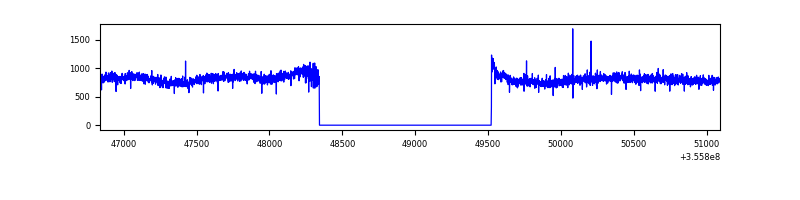 |
| C | 4255 | 3076 | 0 | 0 | 0.00% | 0.00% | 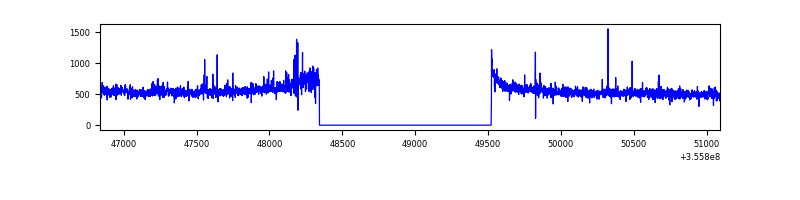 |
| D | 4255 | 3076 | 2 | 2 | 0.05% | 0.07% | 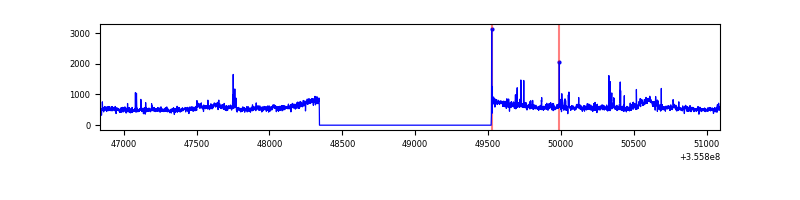 |
Top three noisy pixels from each quadrant. If the there are fewer than three noisy pixels in the level2.evt file, extra rows are filled as -1
| Pixel properties | Quadrant properties | ||||||
|---|---|---|---|---|---|---|---|
| Quadrant | DetID | PixID | Counts | Sigma | Mean | Median | Sigma |
| A | 8 | 192 | 13180 | 149.54 | 422 | 413 | 85.4 |
| A | 13 | 254 | 5879 | 64.02 | 422 | 413 | 85.4 |
| A | 3 | 137 | 3996 | 41.97 | 422 | 413 | 85.4 |
| B | 6 | 159 | 876347 | 11166.3 | 412 | 402 | 78.4 |
| B | 12 | 111 | 9224 | 112.46 | 412 | 402 | 78.4 |
| B | 11 | 111 | 8522 | 103.51 | 412 | 402 | 78.4 |
| C | 14 | 238 | 77516 | 835.48 | 396 | 399 | 92.3 |
| C | 3 | 233 | 43460 | 466.52 | 396 | 399 | 92.3 |
| C | 14 | 254 | 18944 | 200.92 | 396 | 399 | 92.3 |
| D | 8 | 195 | 195308 | 1984.11 | 410 | 399 | 98.2 |
| D | 2 | 250 | 21465 | 214.44 | 410 | 399 | 98.2 |
| D | 13 | 189 | 18758 | 186.89 | 410 | 399 | 98.2 |
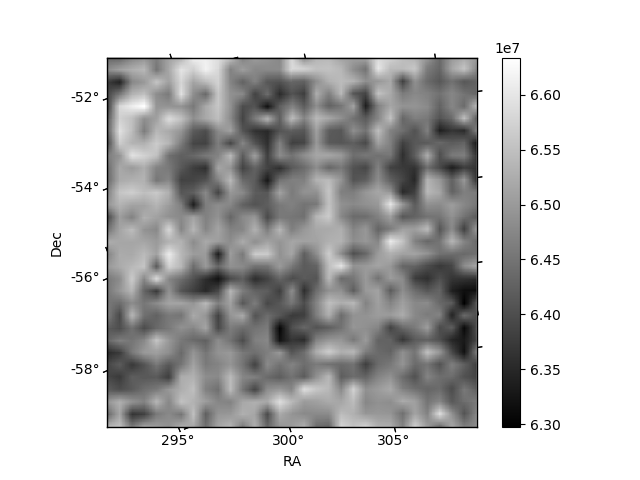
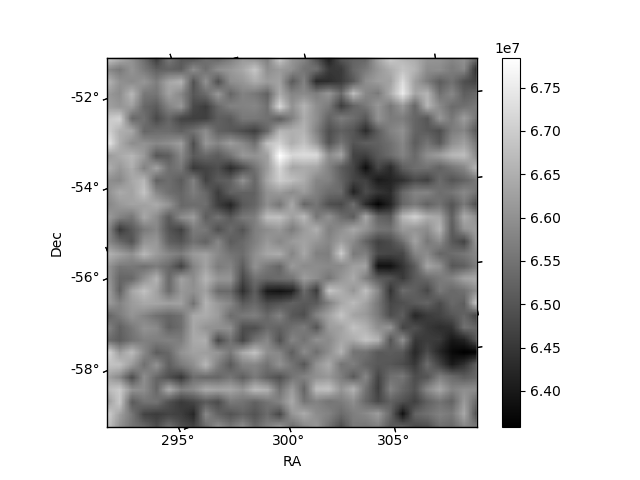
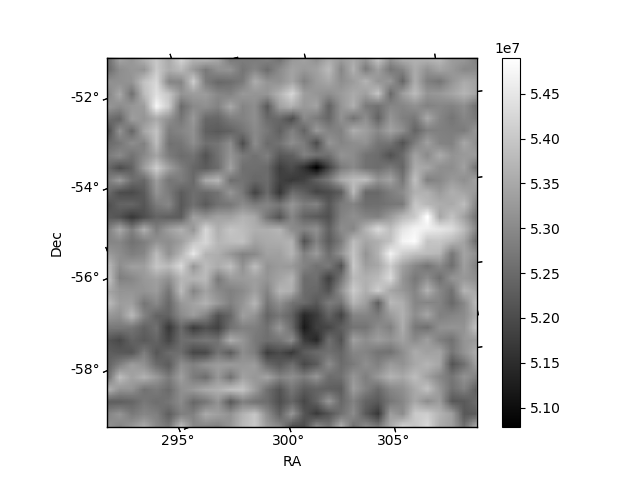
Histogram calculated using DETX and DETY for each event in the final _common_clean file
| Quadrant A | 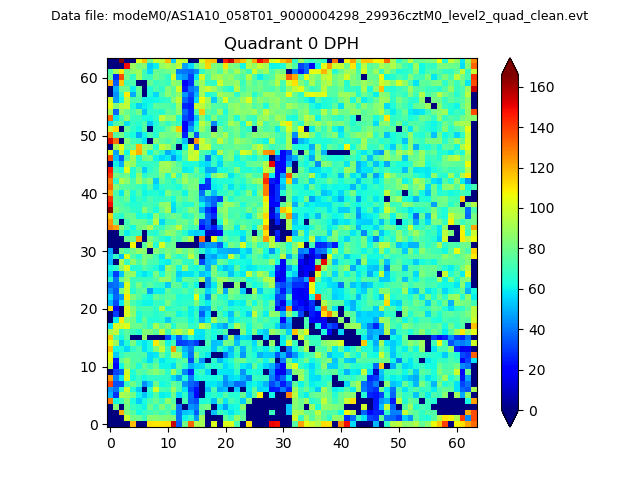 |
 |
Quadrant B |
|---|---|---|---|
| Quadrant D |  |
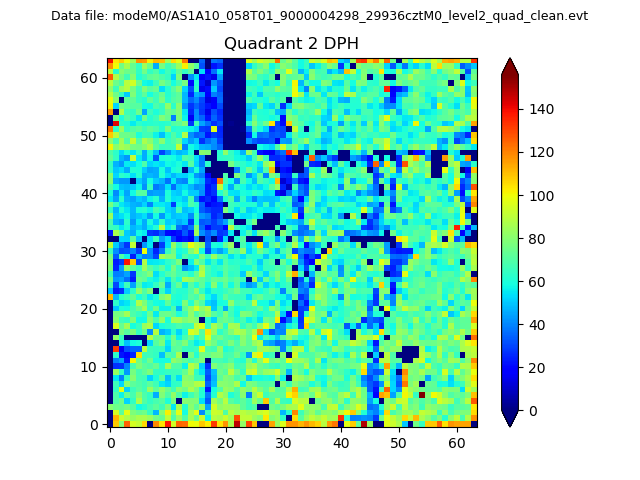 |
Quadrant C |
| Plot type | Count rate plots | Images |
|---|---|---|
| Comparison with Poisson distribution Blue bars denote a histogram of data divided into 1 sec bins. Red curve is a Poisson curve with rate = median count rate of data. |
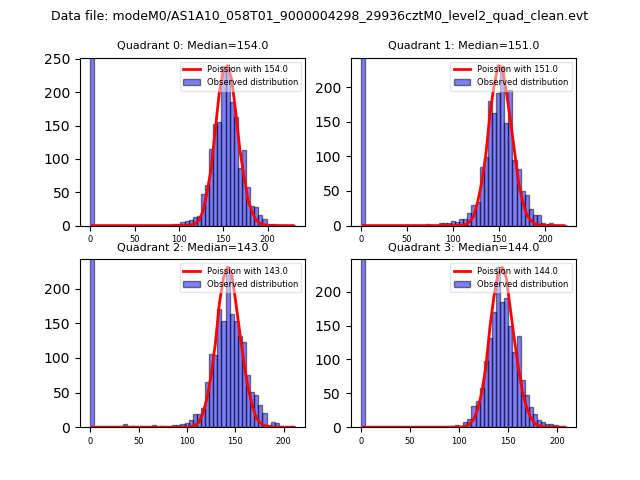 |
 |
| Quadrant-wise count rates Data is divided into 100 sec bins |
 |
|
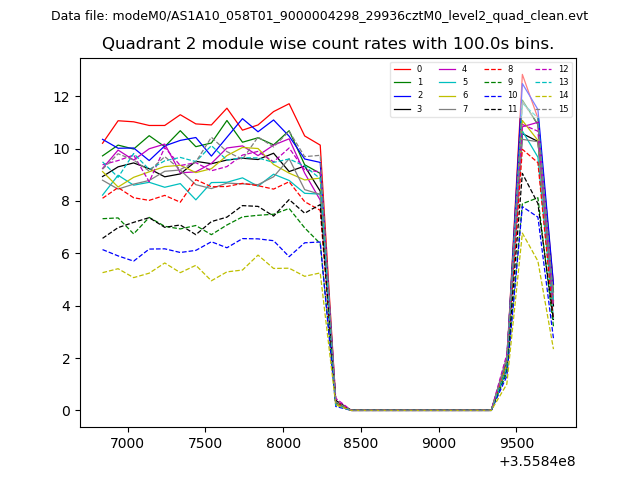
| Module-wise count rates for Quadrant A Data is divided into 100 sec bins |
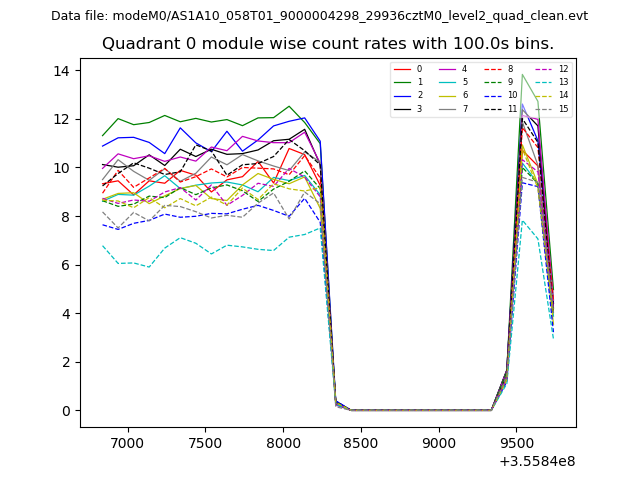 |
 |
| Module-wise count rates for Quadrant B Data is divided into 100 sec bins |
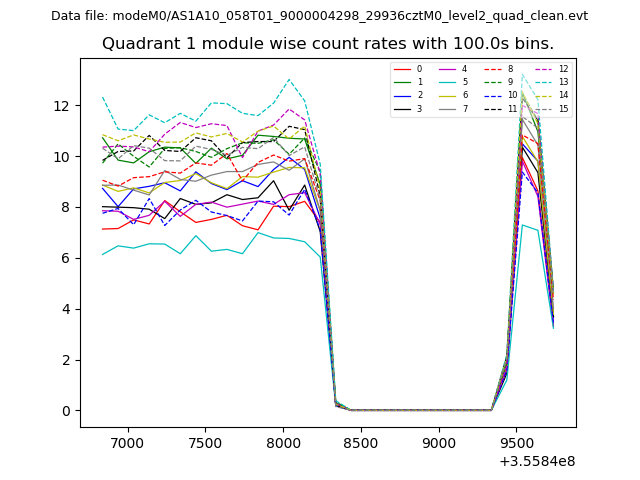 |
 |
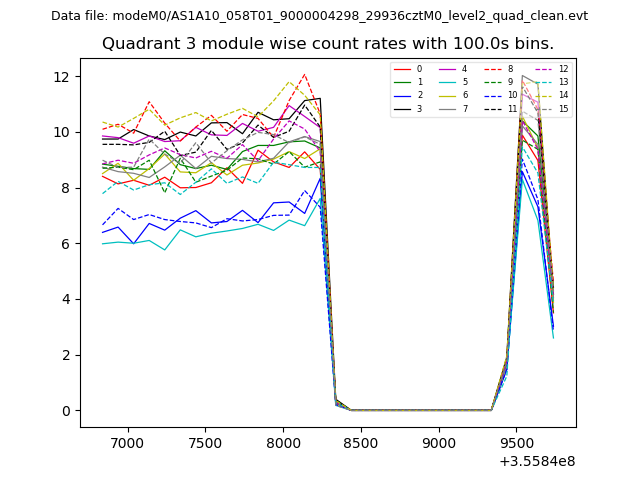
| Module-wise count rates for Quadrant C Data is divided into 100 sec bins |
 |
 |
| Module-wise count rates for Quadrant D Data is divided into 100 sec bins |
 |
 |
| Parameter | Plot |
|---|---|
| CZT HV Monitor |  |
| D_VDD | 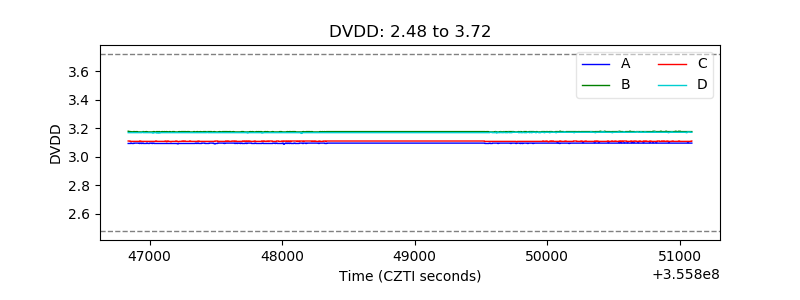 |
| Temperature 1 |  |
| Veto HV Monitor | 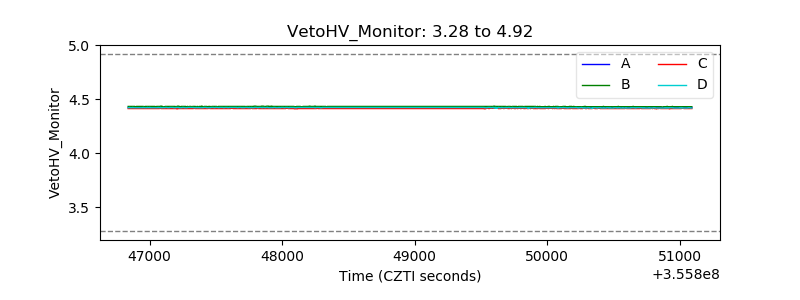 |
| Veto LLD | 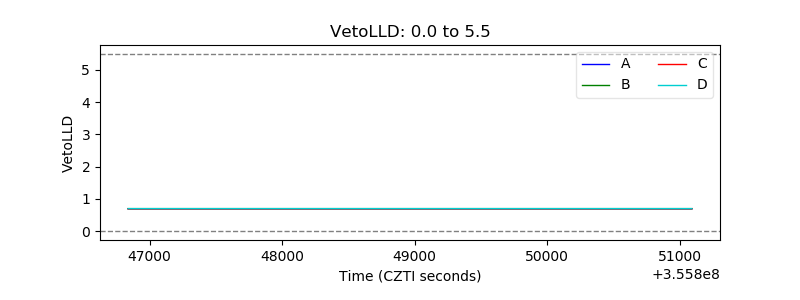 |
| Alpha Counter | 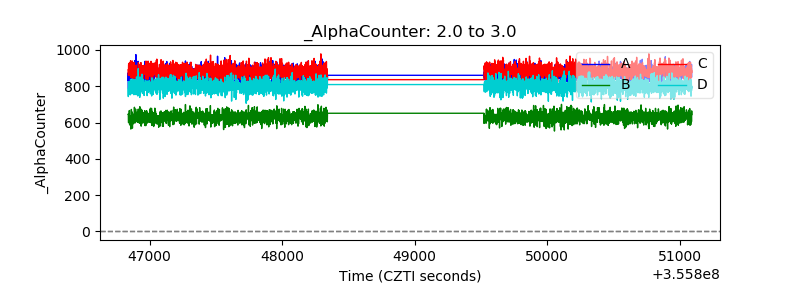 |
| _CPM_Rate | 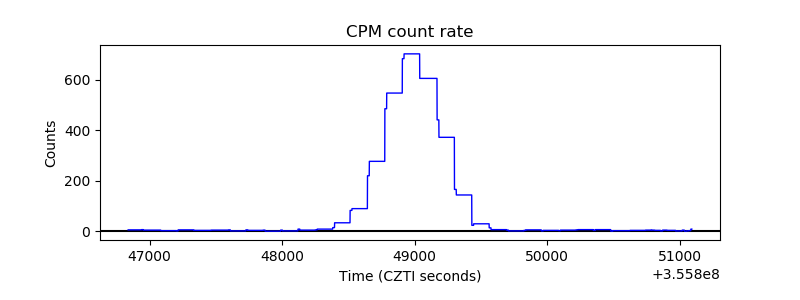 |
| CZT Counter | 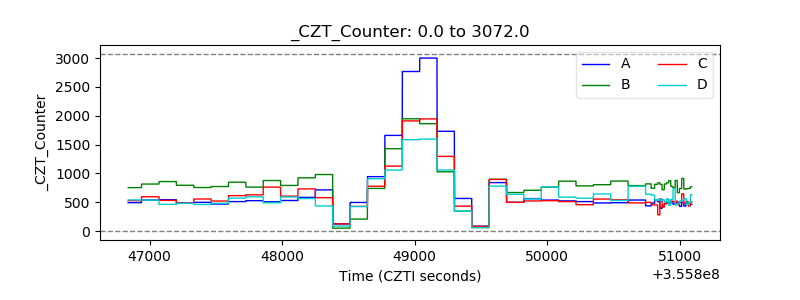 |
| +2.5 Volts monitor |  |
| +5 Volts monitor |  |
| _ROLL_ROT | 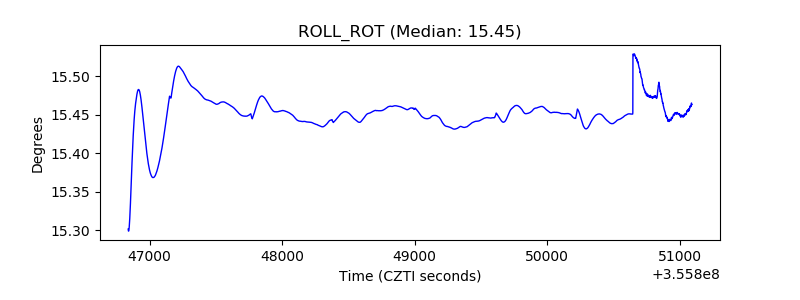 |
| _Roll_DEC | 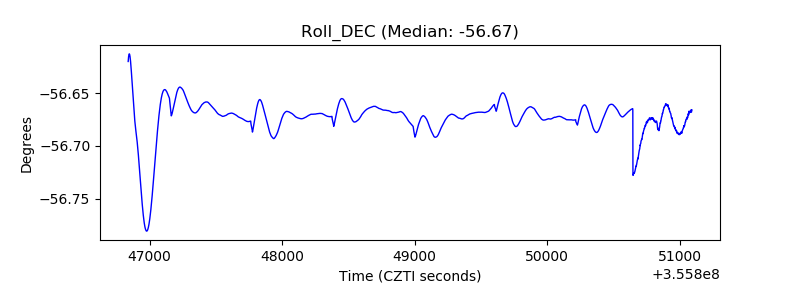 |
| _Roll_RA | 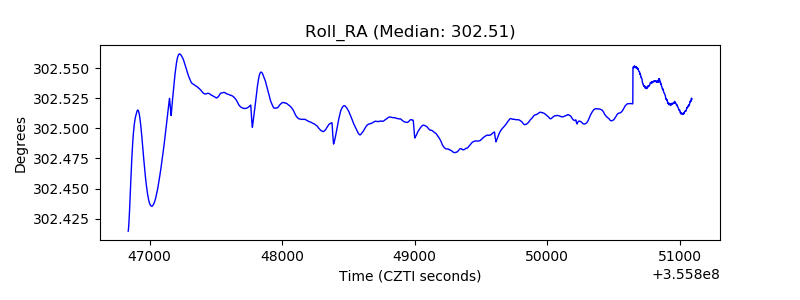 |
| Veto Counter | 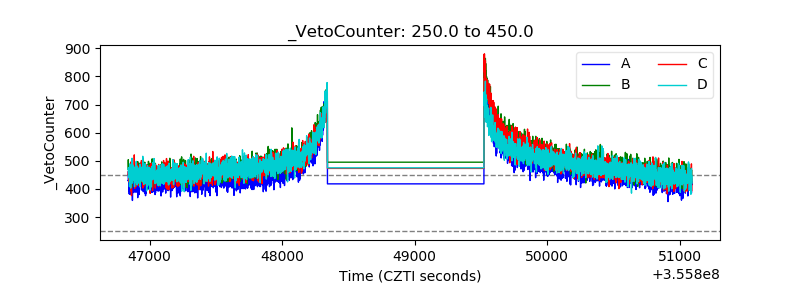 |