| Param | Original file | Final file |
|---|---|---|
| Filename | modeM0/AS1A10_058T01_9000004298_29939cztM0_level2.evt | modeM0/AS1A10_058T01_9000004298_29939cztM0_level2_quad_clean.evt |
| Size (bytes) | 685,969,920 | 95,232,960 |
| Size | 654.2 MB | 90.8 MB |
| Events in quadrant A | 3,846,537 | 610,332 |
| Events in quadrant B | 6,200,653 | 599,051 |
| Events in quadrant C | 4,442,919 | 571,189 |
| Events in quadrant D | 5,757,321 | 561,427 |
| Mode M9 | |||
|---|---|---|---|
| Quadrant | BADHDUFLAG | Total packets | Discarded packets |
| A | 0 | 6 | 0 |
| B | 0 | 6 | 0 |
| C | 0 | 6 | 0 |
| D | 0 | 6 | 0 |
| Mode M0 | |||
|---|---|---|---|
| Quadrant | BADHDUFLAG | Total packets | Discarded packets |
| A | 0 | 16475 | 2 |
| B | 0 | 24018 | 2 |
| C | 0 | 18212 | 3 |
| D | 0 | 22292 | 2 |
| Mode SS | |||
|---|---|---|---|
| Quadrant | BADHDUFLAG | Total packets | Discarded packets |
| A | 0 | 160 | 0 |
| B | 0 | 160 | 0 |
| C | 0 | 160 | 0 |
| D | 0 | 160 | 0 |
| Quadrant | Total seconds | Saturated seconds | Saturation percentage |
|---|---|---|---|
| A | 7790 | 185 | 2.374840% |
| B | 7791 | 342 | 4.389680% |
| C | 7790 | 528 | 6.777920% |
| D | 7790 | 477 | 6.123235% |
Noise dominated data is calculated using 1-second bins in cleaned event files. If a bin has >2000 counts, and if more than 50% of those come from <1% of pixels, then it is considered to be noise-dominated and hence unusable.
| Quadrant | # 1 sec bins | Bins with >0 counts | Bins with >2000 counts | High rate bins dominated by noise | Noise dominated (total time) | Noise dominated (detector-on time) | Marked lightcurve |
|---|---|---|---|---|---|---|---|
| A | 8370 | 7793 | 1 | 1 | 0.01% | 0.01% | 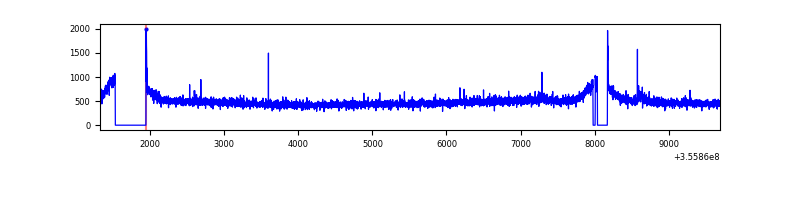 |
| B | 8371 | 7794 | 1 | 1 | 0.01% | 0.01% | 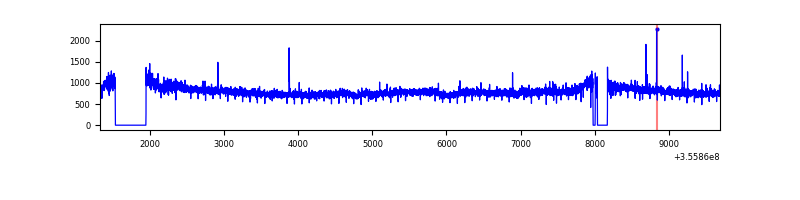 |
| C | 8370 | 7793 | 3 | 3 | 0.04% | 0.04% | 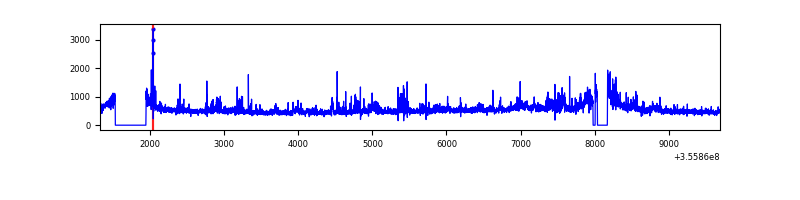 |
| D | 8370 | 7793 | 309 | 309 | 3.69% | 3.97% | 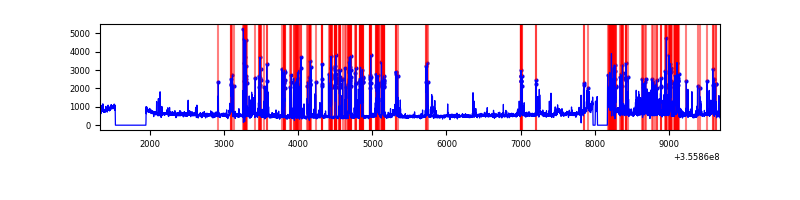 |
Top three noisy pixels from each quadrant. If the there are fewer than three noisy pixels in the level2.evt file, extra rows are filled as -1
| Pixel properties | Quadrant properties | ||||||
|---|---|---|---|---|---|---|---|
| Quadrant | DetID | PixID | Counts | Sigma | Mean | Median | Sigma |
| A | 8 | 192 | 25893 | 125.74 | 983 | 962 | 198.3 |
| A | 15 | 174 | 19671 | 94.36 | 983 | 962 | 198.3 |
| A | 13 | 254 | 16246 | 77.08 | 983 | 962 | 198.3 |
| B | 6 | 159 | 2327256 | 12591.05 | 962 | 939 | 184.8 |
| B | 0 | 190 | 64909 | 346.23 | 962 | 939 | 184.8 |
| B | 12 | 111 | 22600 | 117.24 | 962 | 939 | 184.8 |
| C | 3 | 233 | 400394 | 1871.92 | 915 | 917 | 213.4 |
| C | 14 | 238 | 254902 | 1190.16 | 915 | 917 | 213.4 |
| C | 14 | 254 | 147517 | 686.96 | 915 | 917 | 213.4 |
| D | 7 | 80 | 1366793 | 6164.41 | 931 | 904 | 221.6 |
| D | 8 | 195 | 549064 | 2473.91 | 931 | 904 | 221.6 |
| D | 2 | 250 | 43855 | 193.84 | 931 | 904 | 221.6 |
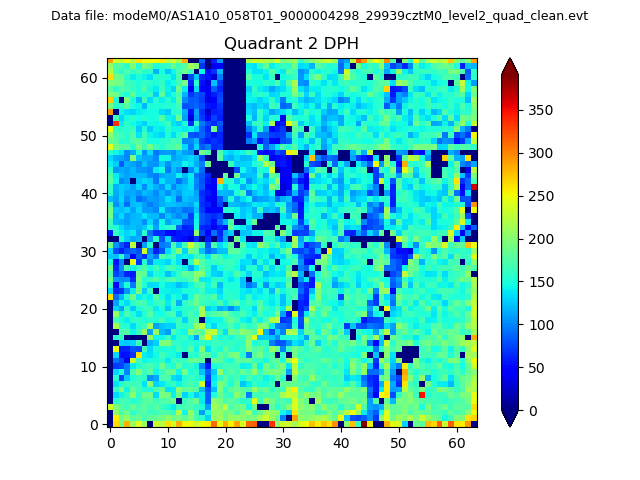
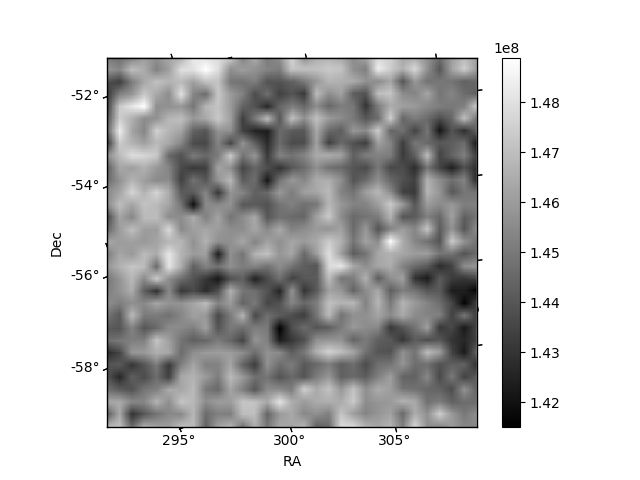
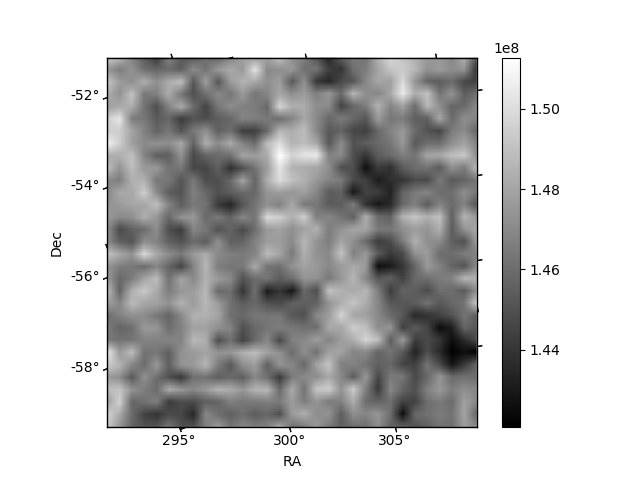
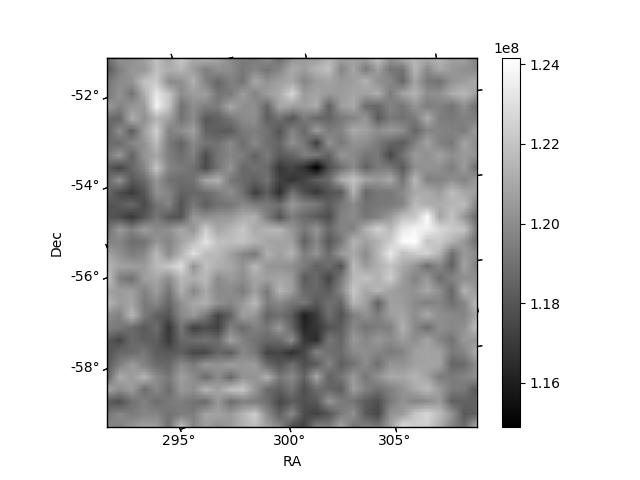
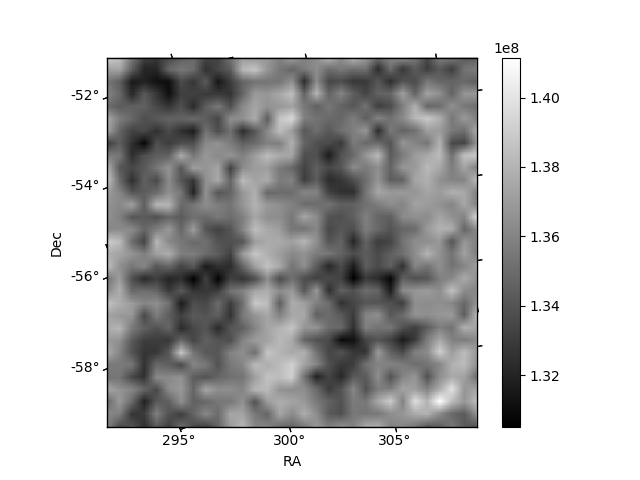
Histogram calculated using DETX and DETY for each event in the final _common_clean file
| Quadrant A | 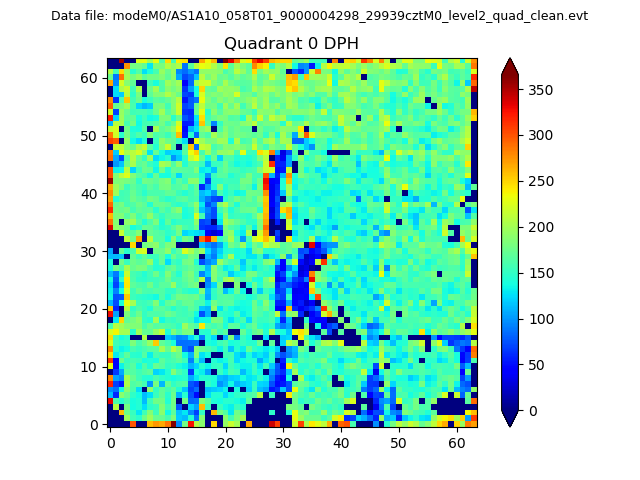 |
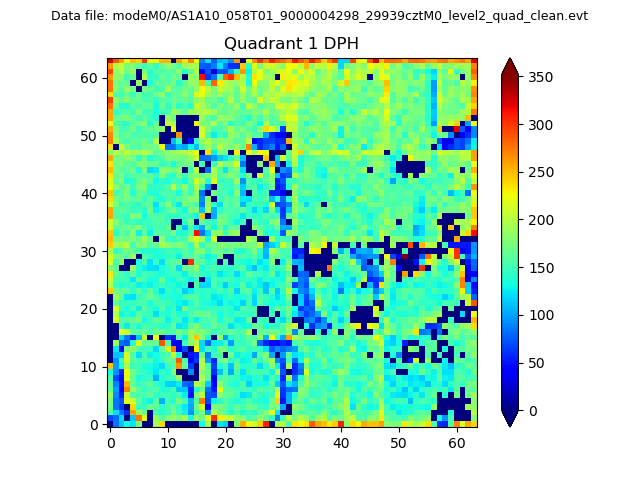 |
Quadrant B |
|---|---|---|---|
| Quadrant D | 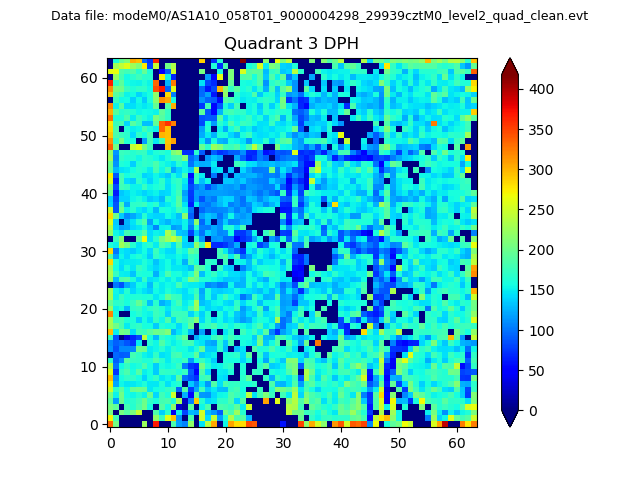 |
 |
Quadrant C |
| Plot type | Count rate plots | Images |
|---|---|---|
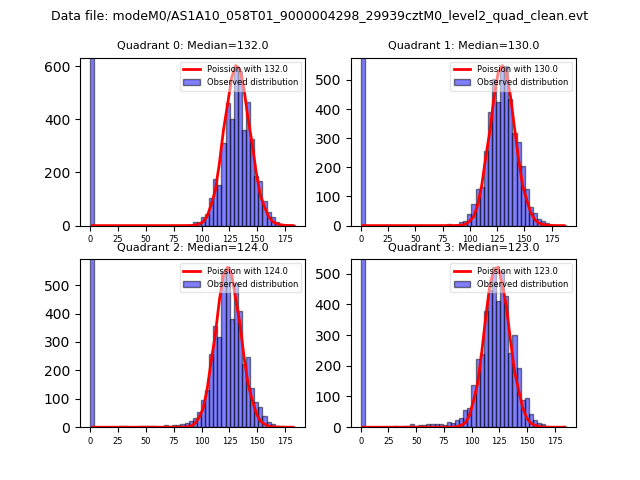
| Comparison with Poisson distribution Blue bars denote a histogram of data divided into 1 sec bins. Red curve is a Poisson curve with rate = median count rate of data. |
 |
 |
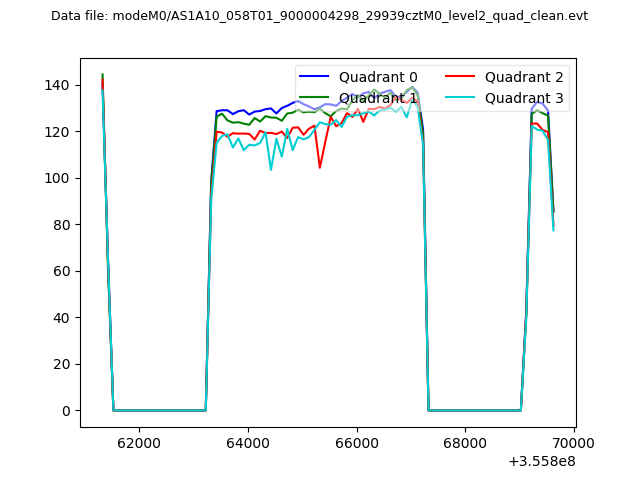
| Quadrant-wise count rates Data is divided into 100 sec bins |
 |
|
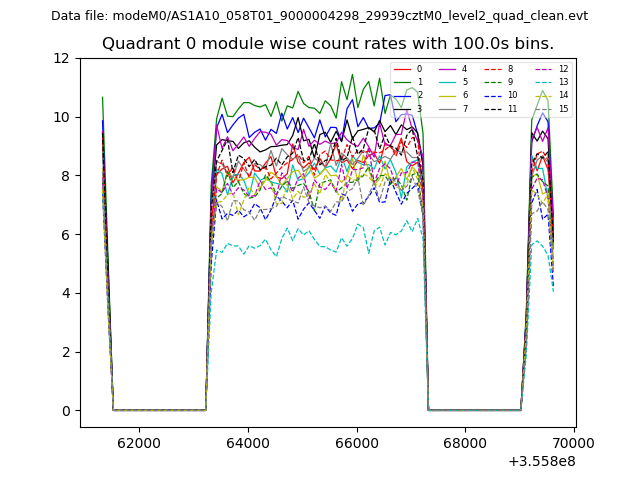
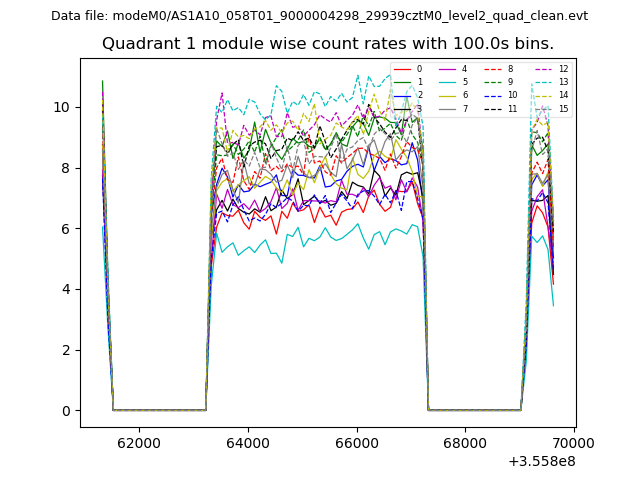
| Module-wise count rates for Quadrant A Data is divided into 100 sec bins |
 |
 |
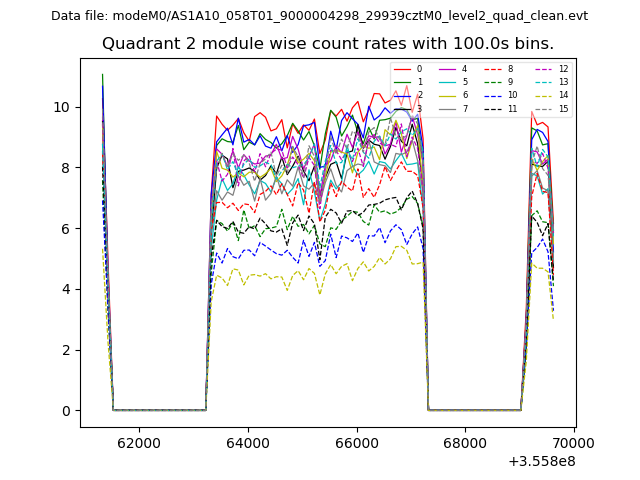
| Module-wise count rates for Quadrant B Data is divided into 100 sec bins |
 |
 |
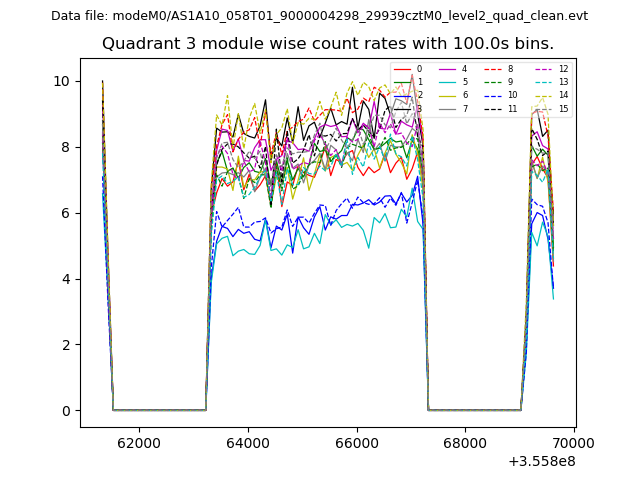
| Module-wise count rates for Quadrant C Data is divided into 100 sec bins |
 |
 |
| Module-wise count rates for Quadrant D Data is divided into 100 sec bins |
 |
 |
| Parameter | Plot |
|---|---|
| CZT HV Monitor |  |
| D_VDD | 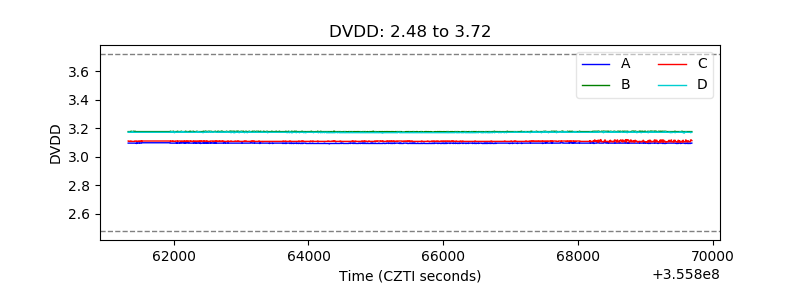 |
| Temperature 1 | 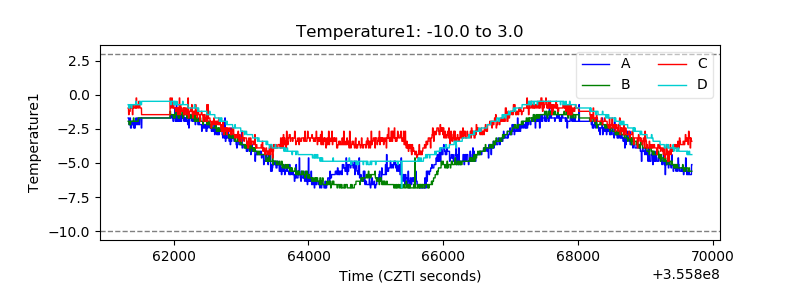 |
| Veto HV Monitor | 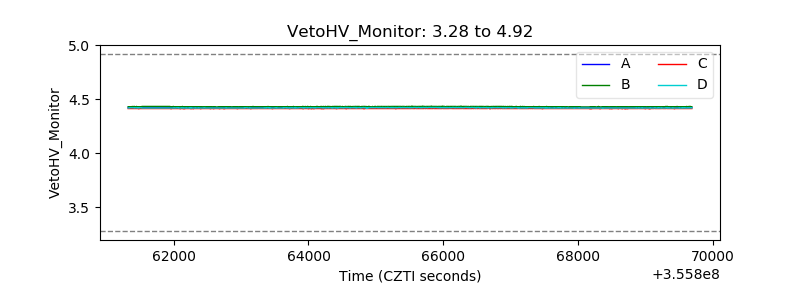 |
| Veto LLD | 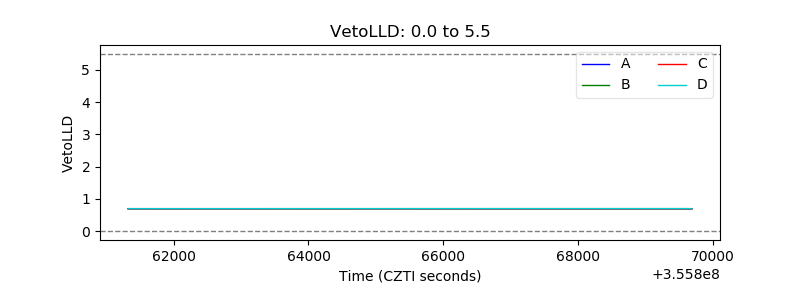 |
| Alpha Counter | 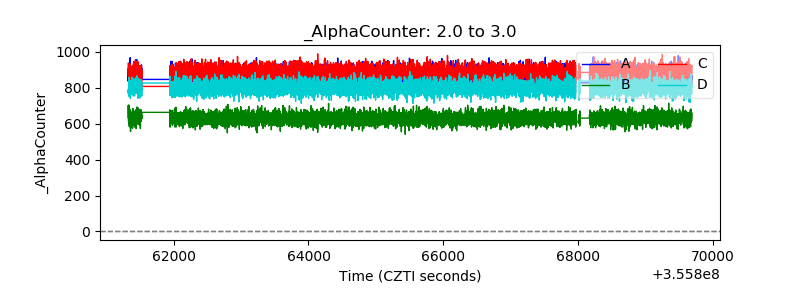 |
| _CPM_Rate | 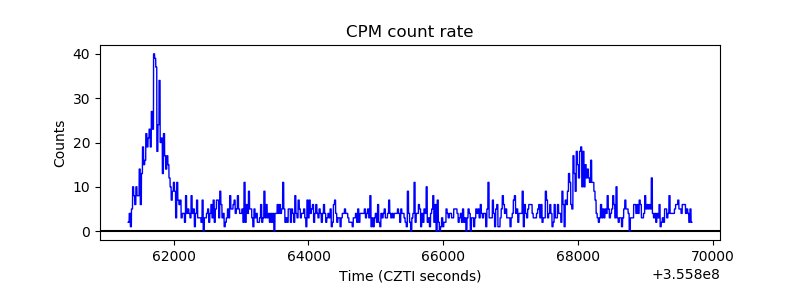 |
| CZT Counter | 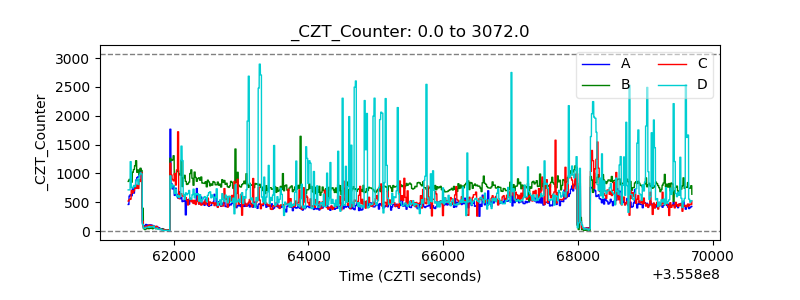 |
| +2.5 Volts monitor |  |
| +5 Volts monitor | 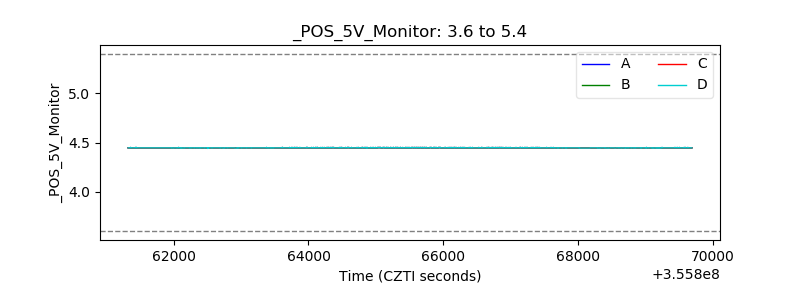 |
| _ROLL_ROT | 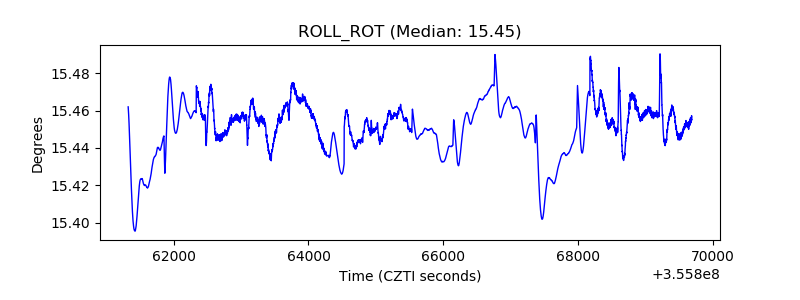 |
| _Roll_DEC | 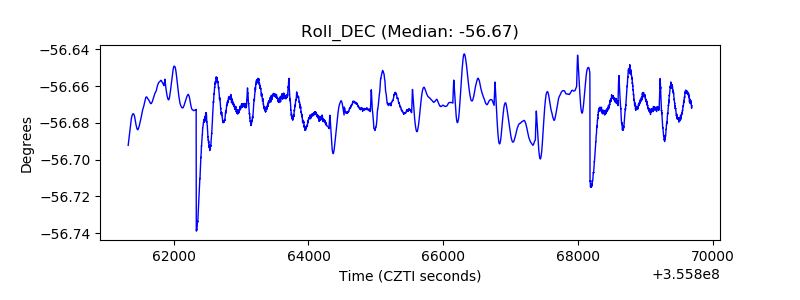 |
| _Roll_RA | 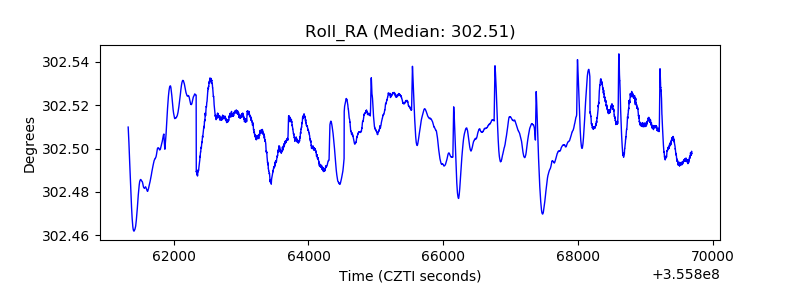 |
| Veto Counter | 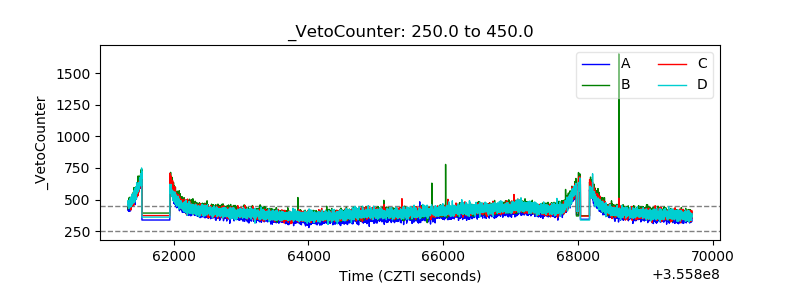 |