| Param | Original file | Final file |
|---|---|---|
| Filename | modeM0/AS1A10_058T01_9000004298_29940cztM0_level2.evt | modeM0/AS1A10_058T01_9000004298_29940cztM0_level2_quad_clean.evt |
| Size (bytes) | 800,277,120 | 102,493,440 |
| Size | 763.2 MB | 97.7 MB |
| Events in quadrant A | 4,040,455 | 665,925 |
| Events in quadrant B | 6,636,503 | 656,231 |
| Events in quadrant C | 5,434,953 | 608,637 |
| Events in quadrant D | 7,561,244 | 593,330 |
| Mode M9 | |||
|---|---|---|---|
| Quadrant | BADHDUFLAG | Total packets | Discarded packets |
| A | 0 | 5 | 0 |
| B | 0 | 5 | 0 |
| C | 0 | 5 | 0 |
| D | 0 | 5 | 0 |
| Mode M0 | |||
|---|---|---|---|
| Quadrant | BADHDUFLAG | Total packets | Discarded packets |
| A | 0 | 17401 | 2 |
| B | 0 | 25598 | 2 |
| C | 0 | 21517 | 2 |
| D | 0 | 28174 | 7 |
| Mode SS | |||
|---|---|---|---|
| Quadrant | BADHDUFLAG | Total packets | Discarded packets |
| A | 0 | 170 | 0 |
| B | 0 | 170 | 0 |
| C | 0 | 170 | 0 |
| D | 0 | 170 | 0 |
| Quadrant | Total seconds | Saturated seconds | Saturation percentage |
|---|---|---|---|
| A | 8344 | 125 | 1.498082% |
| B | 8345 | 275 | 3.295386% |
| C | 8345 | 663 | 7.944877% |
| D | 8344 | 952 | 11.409396% |
Noise dominated data is calculated using 1-second bins in cleaned event files. If a bin has >2000 counts, and if more than 50% of those come from <1% of pixels, then it is considered to be noise-dominated and hence unusable.
| Quadrant | # 1 sec bins | Bins with >0 counts | Bins with >2000 counts | High rate bins dominated by noise | Noise dominated (total time) | Noise dominated (detector-on time) | Marked lightcurve |
|---|---|---|---|---|---|---|---|
| A | 8844 | 8347 | 1 | 1 | 0.01% | 0.01% | 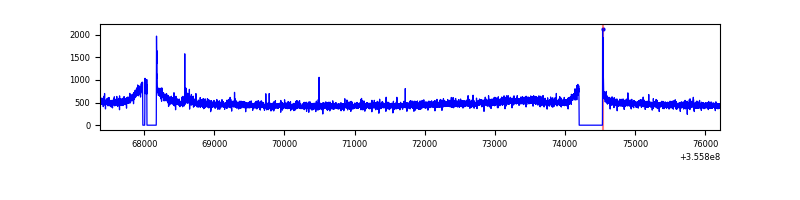 |
| B | 8845 | 8348 | 11 | 11 | 0.12% | 0.13% | 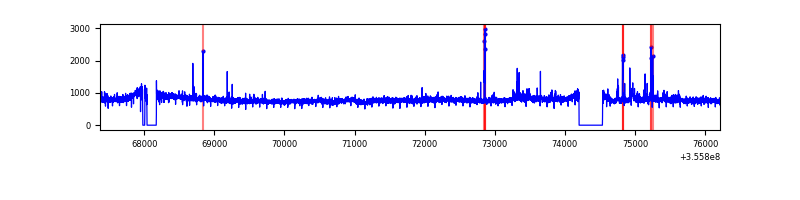 |
| C | 8845 | 8348 | 236 | 236 | 2.67% | 2.83% | 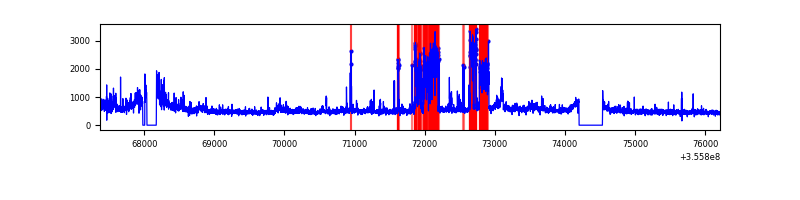 |
| D | 8844 | 8346 | 617 | 617 | 6.98% | 7.39% | 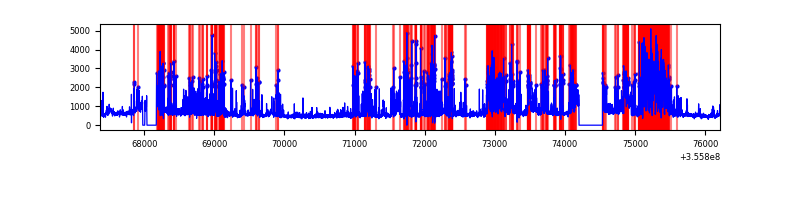 |
Top three noisy pixels from each quadrant. If the there are fewer than three noisy pixels in the level2.evt file, extra rows are filled as -1
| Pixel properties | Quadrant properties | ||||||
|---|---|---|---|---|---|---|---|
| Quadrant | DetID | PixID | Counts | Sigma | Mean | Median | Sigma |
| A | 8 | 192 | 27884 | 128.52 | 1035 | 1013 | 209.1 |
| A | 13 | 254 | 17448 | 78.61 | 1035 | 1013 | 209.1 |
| A | 15 | 174 | 16681 | 74.94 | 1035 | 1013 | 209.1 |
| B | 6 | 159 | 2490987 | 12877.58 | 1016 | 991 | 193.4 |
| B | 5 | 255 | 94673 | 484.5 | 1016 | 991 | 193.4 |
| B | 12 | 111 | 23873 | 118.34 | 1016 | 991 | 193.4 |
| C | 3 | 233 | 1388945 | 6163.44 | 959 | 963 | 225.2 |
| C | 14 | 238 | 203211 | 898.1 | 959 | 963 | 225.2 |
| C | 14 | 254 | 65484 | 286.51 | 959 | 963 | 225.2 |
| D | 7 | 80 | 2896549 | 12630.75 | 959 | 931 | 229.3 |
| D | 8 | 195 | 655932 | 2857.13 | 959 | 931 | 229.3 |
| D | 2 | 250 | 187298 | 812.94 | 959 | 931 | 229.3 |
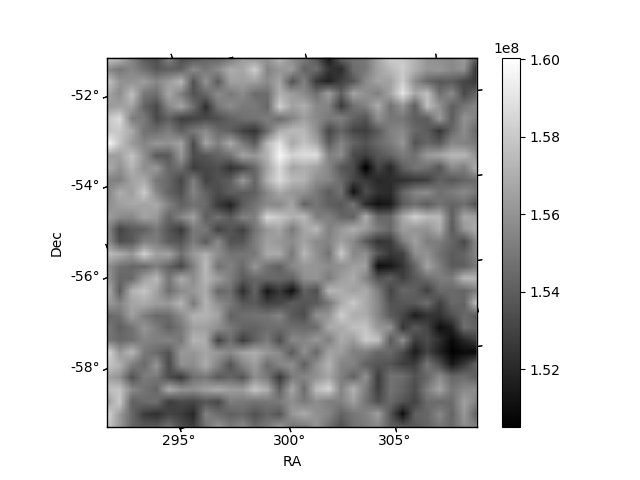
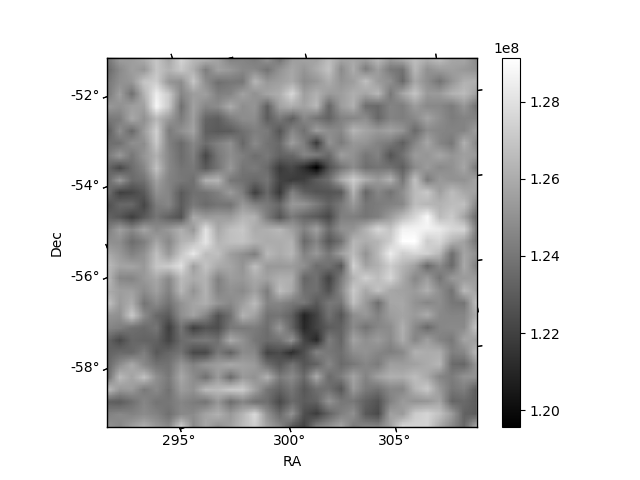
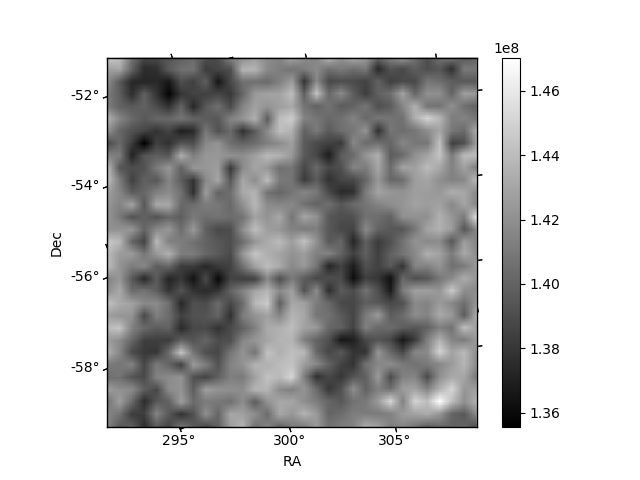
Histogram calculated using DETX and DETY for each event in the final _common_clean file
| Quadrant A | 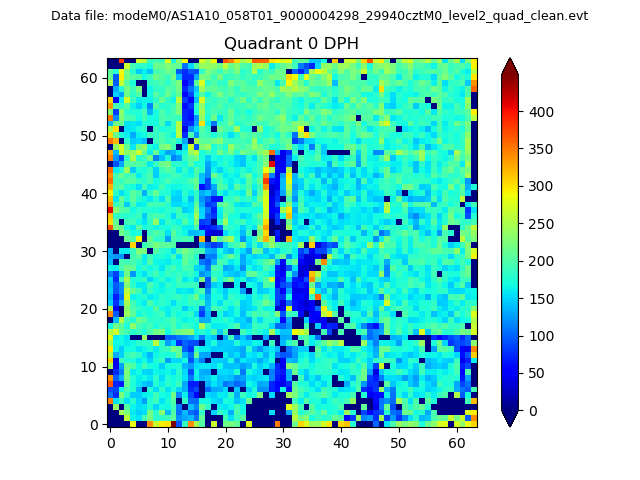 |
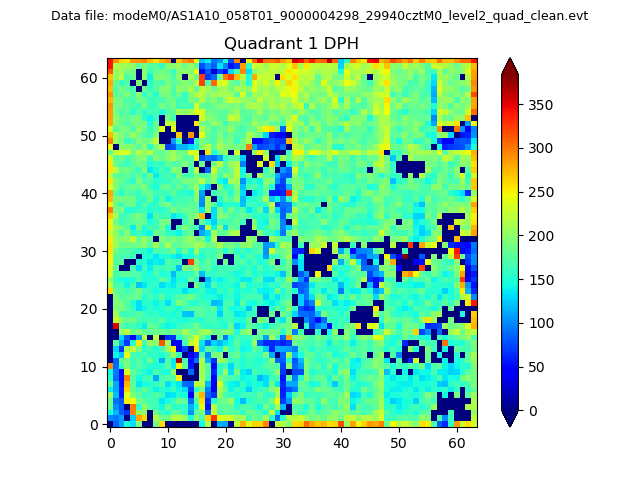 |
Quadrant B |
|---|---|---|---|
| Quadrant D | 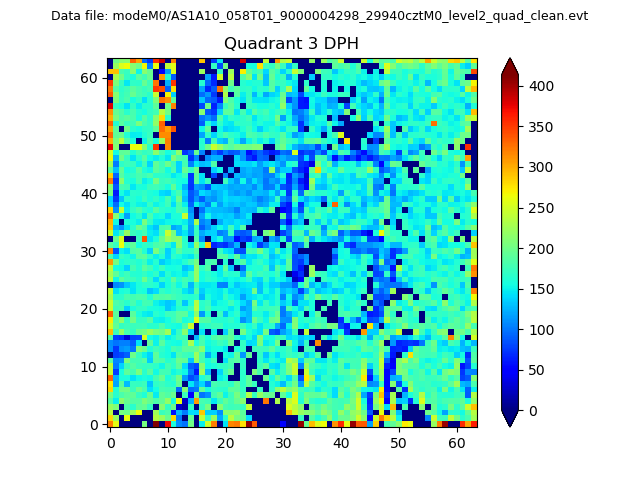 |
 |
Quadrant C |
| Plot type | Count rate plots | Images |
|---|---|---|
| Comparison with Poisson distribution Blue bars denote a histogram of data divided into 1 sec bins. Red curve is a Poisson curve with rate = median count rate of data. |
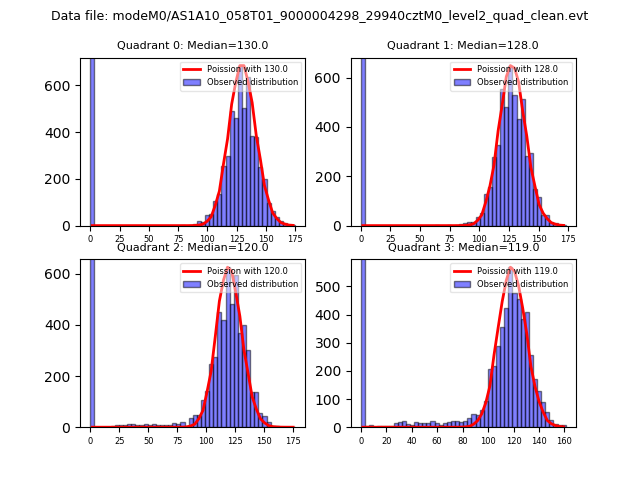 |
 |
| Quadrant-wise count rates Data is divided into 100 sec bins |
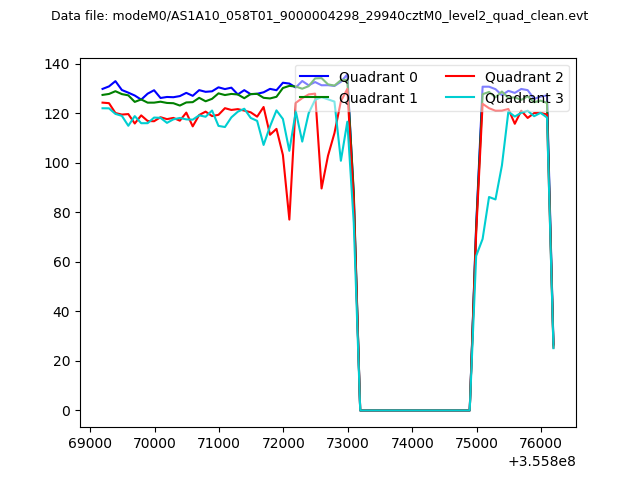 |
|
| Module-wise count rates for Quadrant A Data is divided into 100 sec bins |
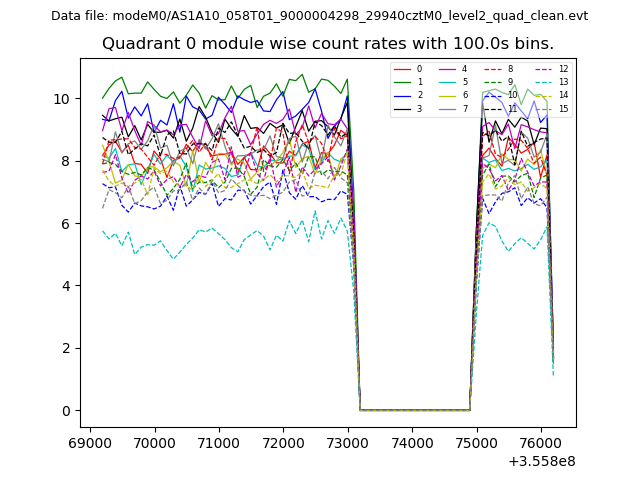 |
 |
| Module-wise count rates for Quadrant B Data is divided into 100 sec bins |
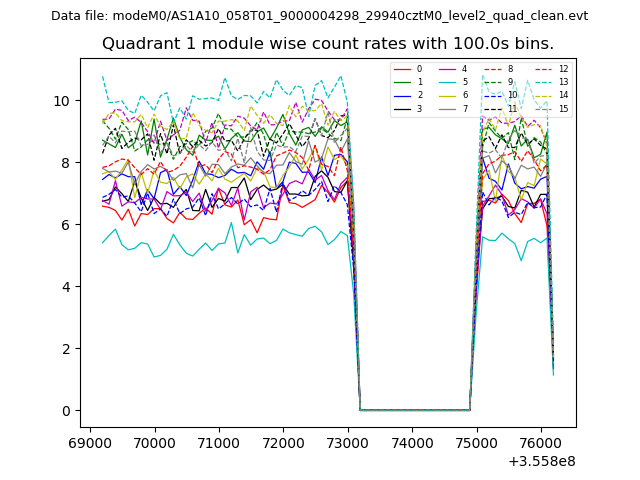 |
 |
| Module-wise count rates for Quadrant C Data is divided into 100 sec bins |
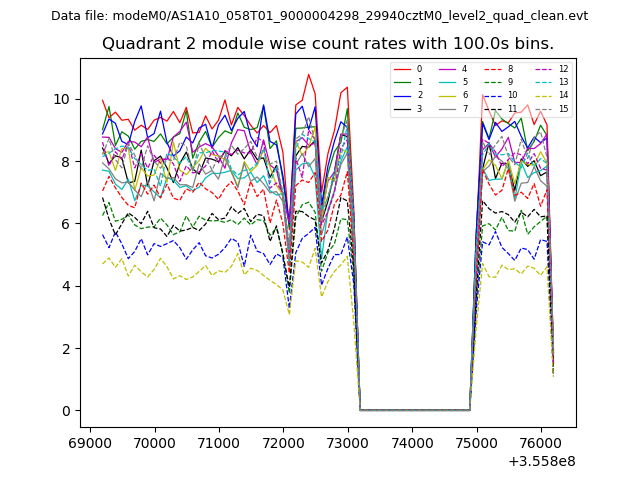 |
 |
| Module-wise count rates for Quadrant D Data is divided into 100 sec bins |
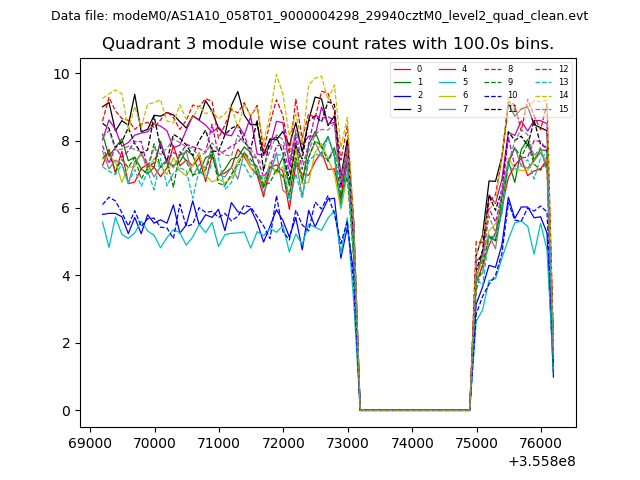 |
 |
| Parameter | Plot |
|---|---|
| CZT HV Monitor | 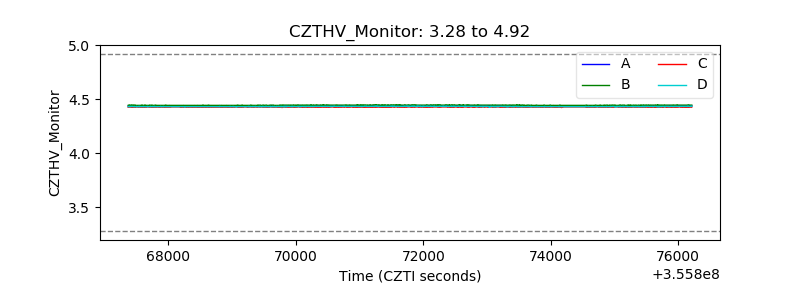 |
| D_VDD | 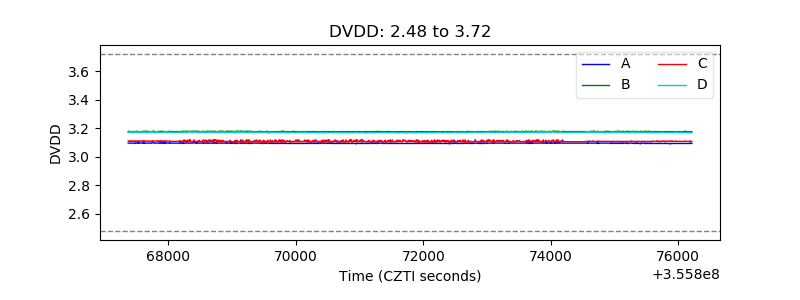 |
| Temperature 1 | 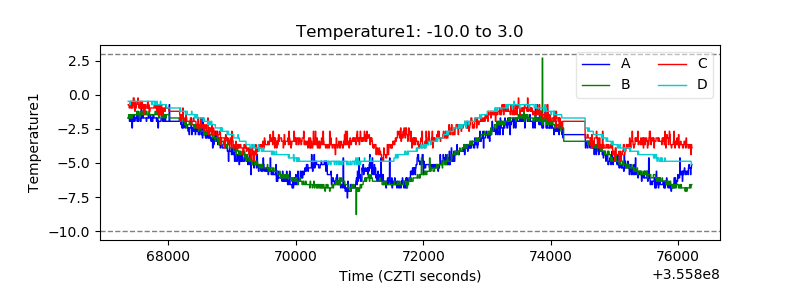 |
| Veto HV Monitor | 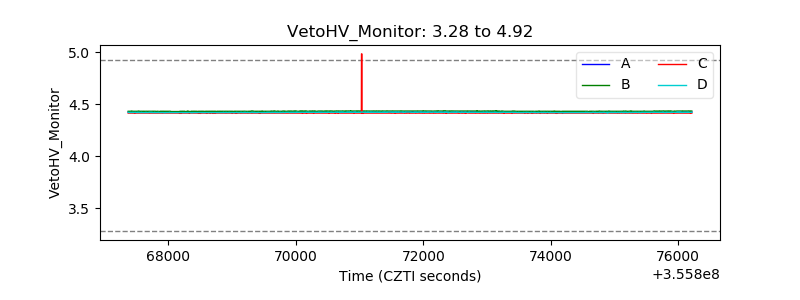 |
| Veto LLD | 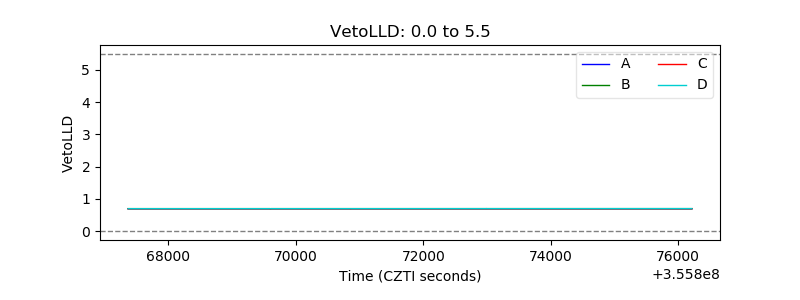 |
| Alpha Counter | 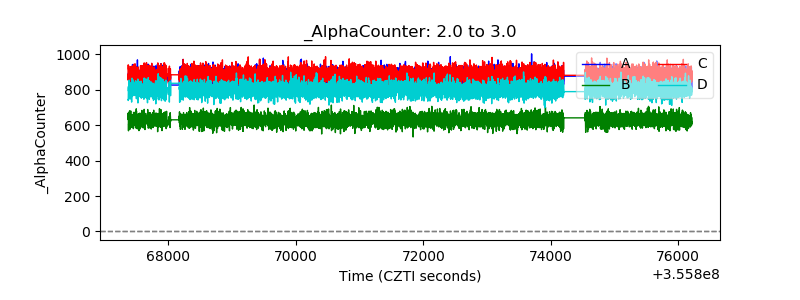 |
| _CPM_Rate | 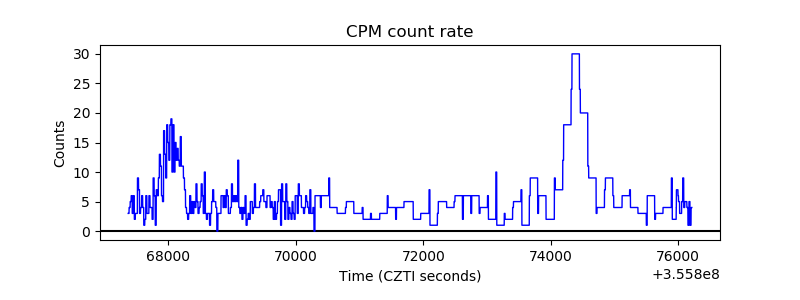 |
| CZT Counter | 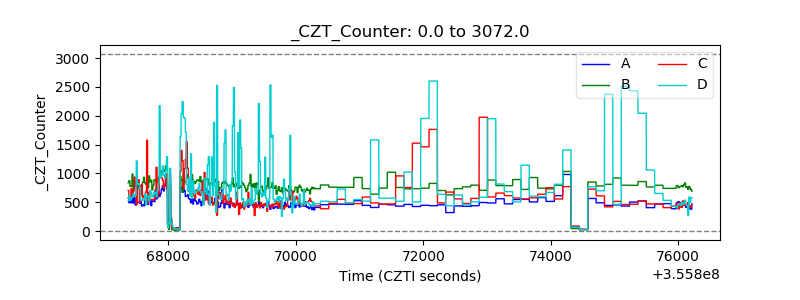 |
| +2.5 Volts monitor |  |
| +5 Volts monitor |  |
| _ROLL_ROT | 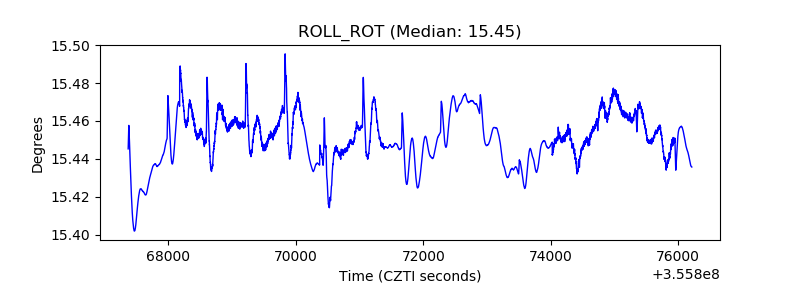 |
| _Roll_DEC | 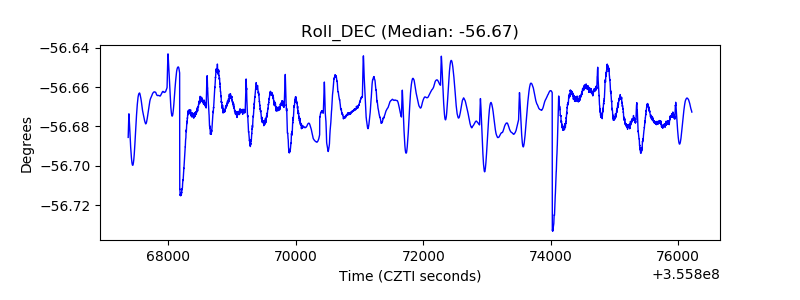 |
| _Roll_RA | 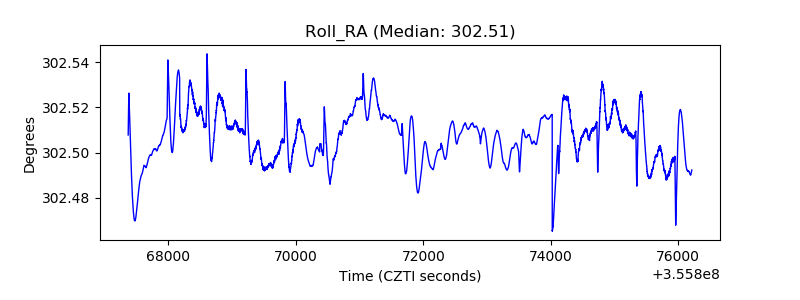 |
| Veto Counter | 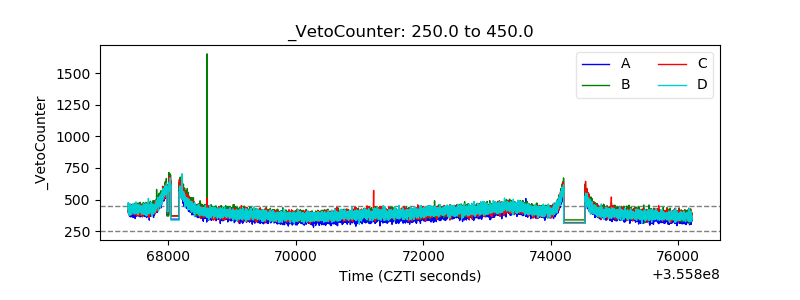 |