| Param | Original file | Final file |
|---|---|---|
| Filename | modeM0/AS1A10_058T01_9000004298_29946cztM0_level2.evt | modeM0/AS1A10_058T01_9000004298_29946cztM0_level2_quad_clean.evt |
| Size (bytes) | 889,585,920 | 151,263,360 |
| Size | 848.4 MB | 144.3 MB |
| Events in quadrant A | 5,241,772 | 973,467 |
| Events in quadrant B | 8,449,438 | 971,591 |
| Events in quadrant C | 6,399,627 | 945,863 |
| Events in quadrant D | 6,105,970 | 927,278 |
| Mode M9 | |||
|---|---|---|---|
| Quadrant | BADHDUFLAG | Total packets | Discarded packets |
| A | 0 | 18 | 0 |
| B | 0 | 18 | 0 |
| C | 0 | 18 | 0 |
| D | 0 | 18 | 0 |
| Mode M0 | |||
|---|---|---|---|
| Quadrant | BADHDUFLAG | Total packets | Discarded packets |
| A | 0 | 22547 | 2 |
| B | 0 | 33448 | 2 |
| C | 0 | 26110 | 2 |
| D | 0 | 24979 | 2 |
| Mode SS | |||
|---|---|---|---|
| Quadrant | BADHDUFLAG | Total packets | Discarded packets |
| A | 0 | 226 | 0 |
| B | 0 | 226 | 0 |
| C | 0 | 226 | 0 |
| D | 0 | 226 | 0 |
| Quadrant | Total seconds | Saturated seconds | Saturation percentage |
|---|---|---|---|
| A | 11016 | 64 | 0.580973% |
| B | 11017 | 145 | 1.316148% |
| C | 11017 | 191 | 1.733684% |
| D | 11017 | 93 | 0.844150% |
Noise dominated data is calculated using 1-second bins in cleaned event files. If a bin has >2000 counts, and if more than 50% of those come from <1% of pixels, then it is considered to be noise-dominated and hence unusable.
| Quadrant | # 1 sec bins | Bins with >0 counts | Bins with >2000 counts | High rate bins dominated by noise | Noise dominated (total time) | Noise dominated (detector-on time) | Marked lightcurve |
|---|---|---|---|---|---|---|---|
| A | 12856 | 11017 | 0 | 0 | 0.00% | 0.00% | 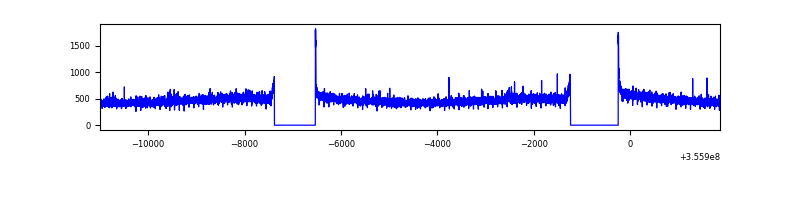 |
| B | 12857 | 11018 | 7 | 7 | 0.05% | 0.06% | 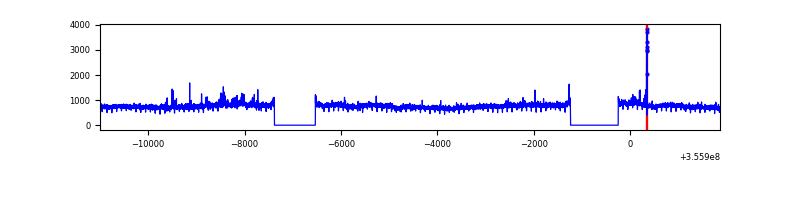 |
| C | 12857 | 11017 | 2 | 2 | 0.02% | 0.02% | 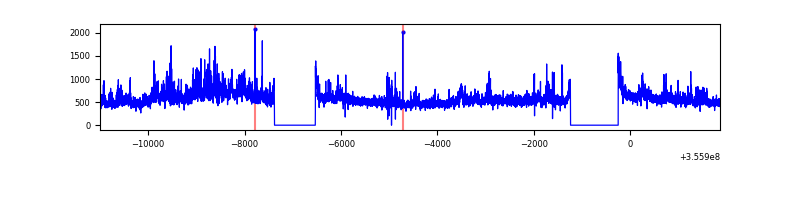 |
| D | 12857 | 11018 | 29 | 29 | 0.23% | 0.26% | 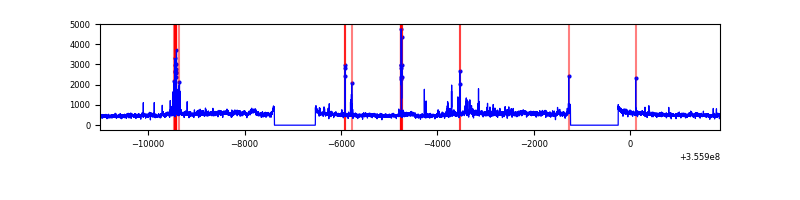 |
Top three noisy pixels from each quadrant. If the there are fewer than three noisy pixels in the level2.evt file, extra rows are filled as -1
| Pixel properties | Quadrant properties | ||||||
|---|---|---|---|---|---|---|---|
| Quadrant | DetID | PixID | Counts | Sigma | Mean | Median | Sigma |
| A | 8 | 192 | 23870 | 84.01 | 1348 | 1320 | 268.4 |
| A | 13 | 254 | 21090 | 73.65 | 1348 | 1320 | 268.4 |
| A | 3 | 137 | 13064 | 43.75 | 1348 | 1320 | 268.4 |
| B | 6 | 159 | 3083077 | 12317.31 | 1325 | 1291 | 250.2 |
| B | 5 | 255 | 137909 | 546.03 | 1325 | 1291 | 250.2 |
| B | 12 | 111 | 31255 | 119.76 | 1325 | 1291 | 250.2 |
| C | 3 | 233 | 1050562 | 3471.87 | 1299 | 1305 | 302.2 |
| C | 14 | 238 | 227440 | 748.26 | 1299 | 1305 | 302.2 |
| C | 14 | 254 | 30016 | 95.0 | 1299 | 1305 | 302.2 |
| D | 8 | 195 | 827561 | 2647.91 | 1321 | 1287 | 312.0 |
| D | 2 | 250 | 161049 | 511.98 | 1321 | 1287 | 312.0 |
| D | 13 | 189 | 46659 | 145.4 | 1321 | 1287 | 312.0 |
Histogram calculated using DETX and DETY for each event in the final _common_clean file
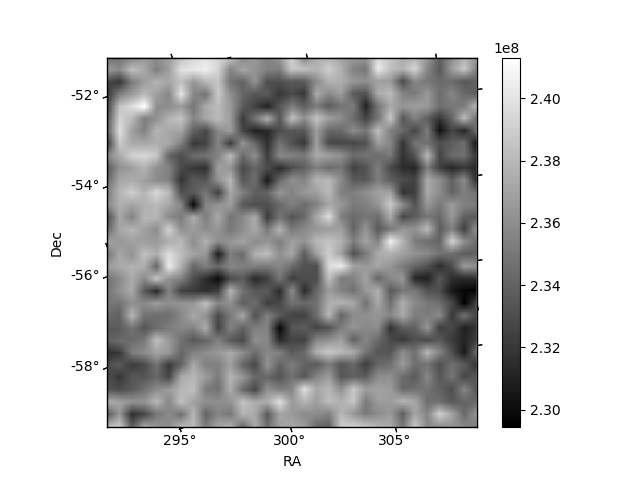
| Quadrant A |  |
 |
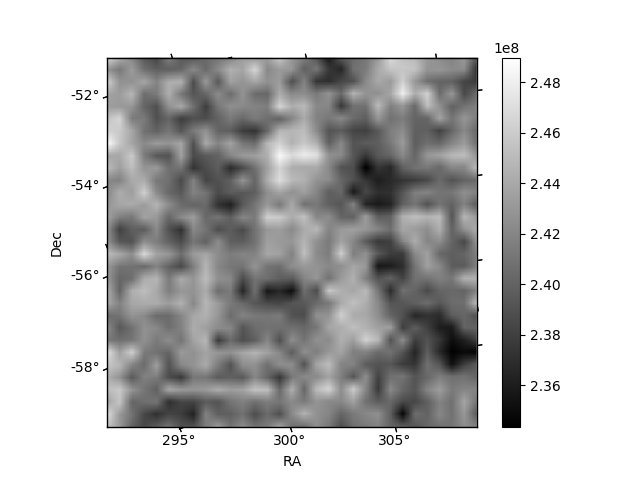
Quadrant B |
|---|---|---|---|
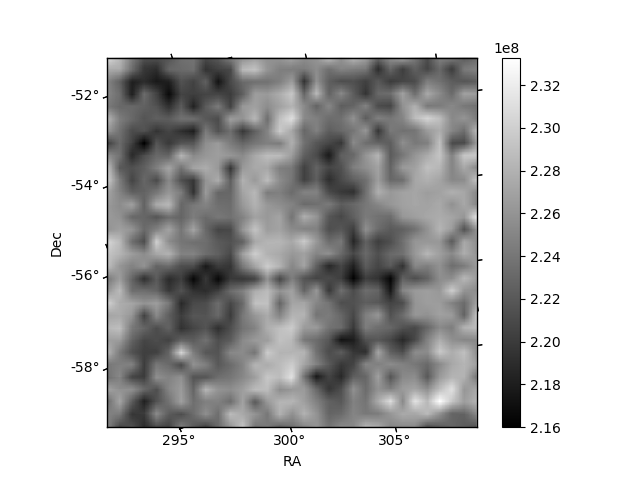
| Quadrant D | 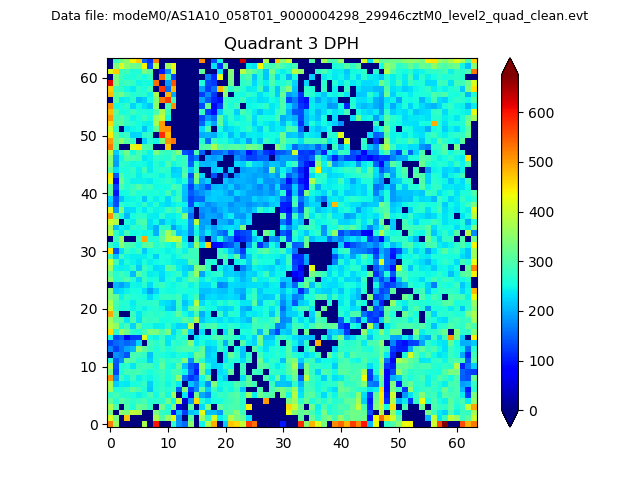 |
 |
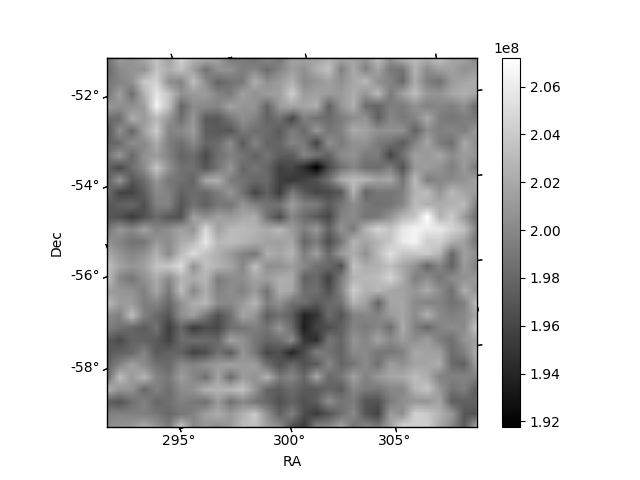
Quadrant C |
| Plot type | Count rate plots | Images |
|---|---|---|
| Comparison with Poisson distribution Blue bars denote a histogram of data divided into 1 sec bins. Red curve is a Poisson curve with rate = median count rate of data. |
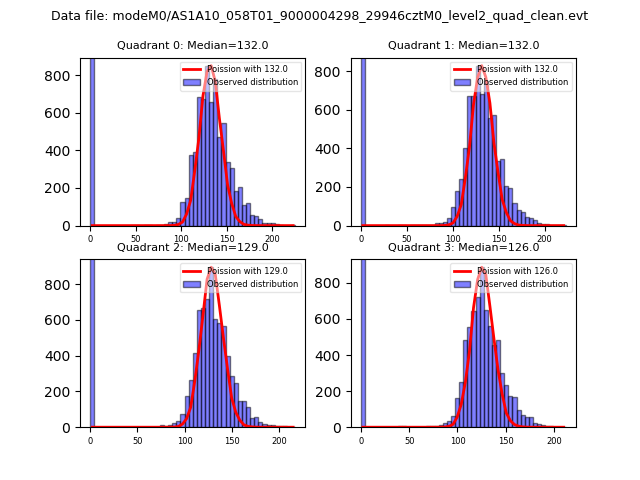 |
 |
| Quadrant-wise count rates Data is divided into 100 sec bins |
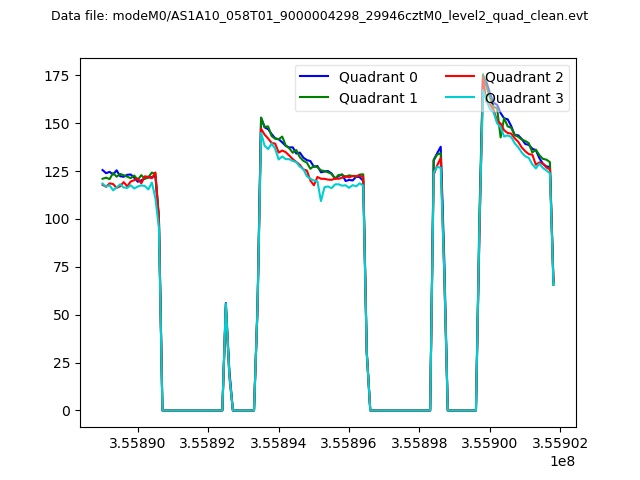 |
|
| Module-wise count rates for Quadrant A Data is divided into 100 sec bins |
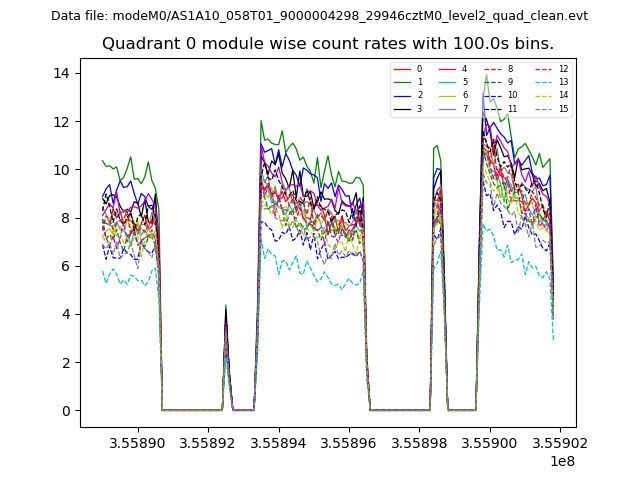 |
 |
| Module-wise count rates for Quadrant B Data is divided into 100 sec bins |
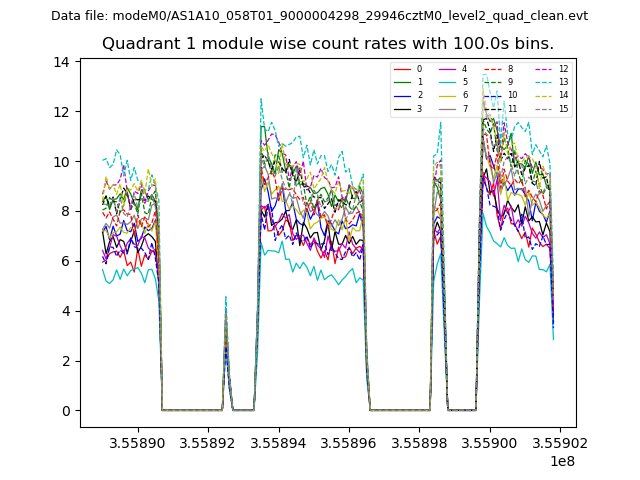 |
 |
| Module-wise count rates for Quadrant C Data is divided into 100 sec bins |
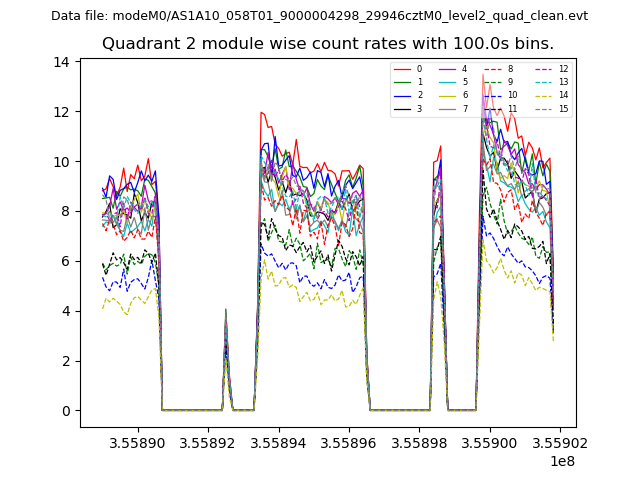 |
 |
| Module-wise count rates for Quadrant D Data is divided into 100 sec bins |
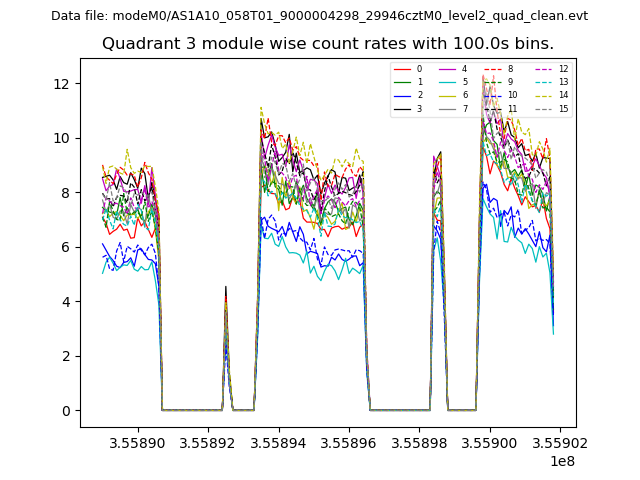 |
 |
| Parameter | Plot |
|---|---|
| CZT HV Monitor | 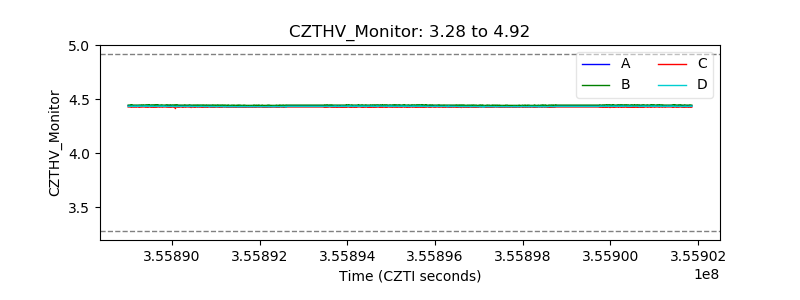 |
| D_VDD | 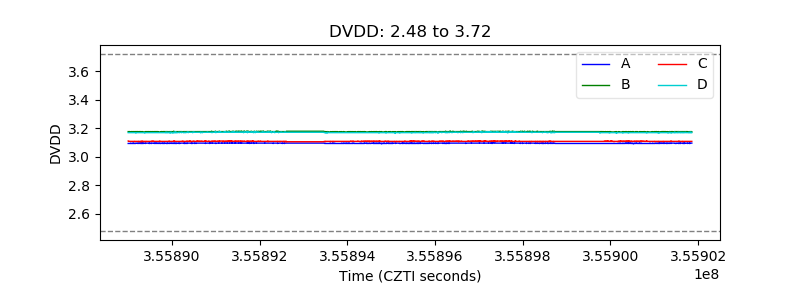 |
| Temperature 1 | 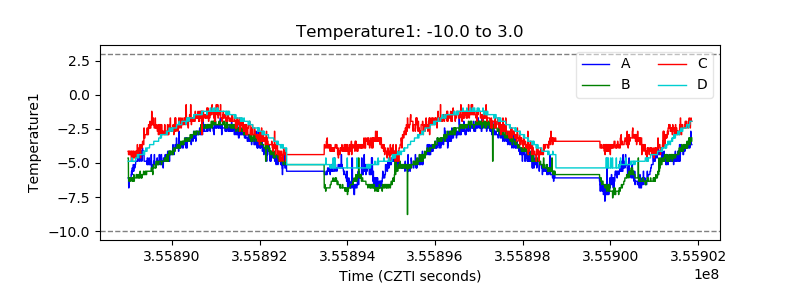 |
| Veto HV Monitor | 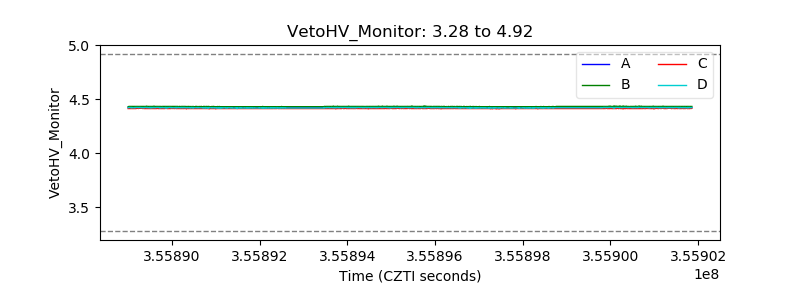 |
| Veto LLD | 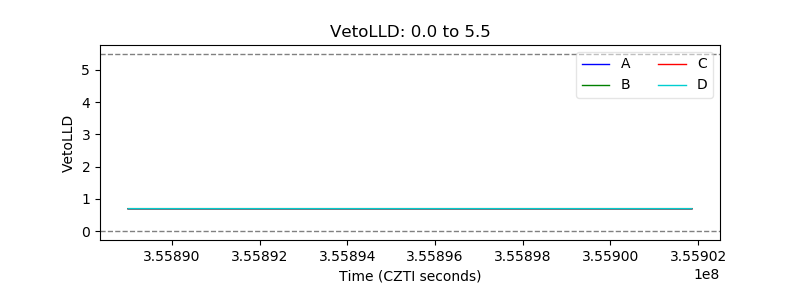 |
| Alpha Counter | 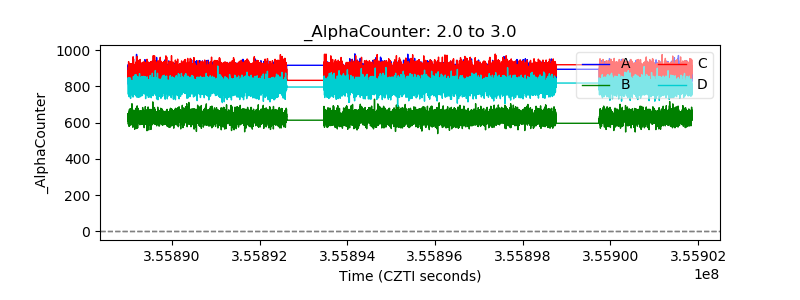 |
| _CPM_Rate | 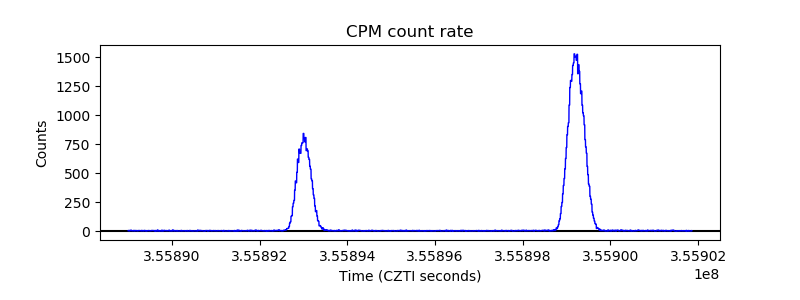 |
| CZT Counter | 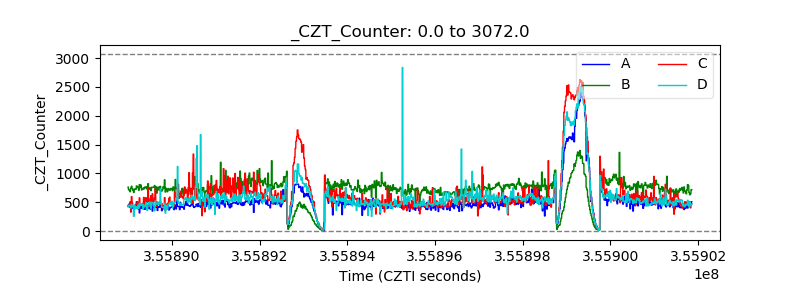 |
| +2.5 Volts monitor |  |
| +5 Volts monitor |  |
| _ROLL_ROT | 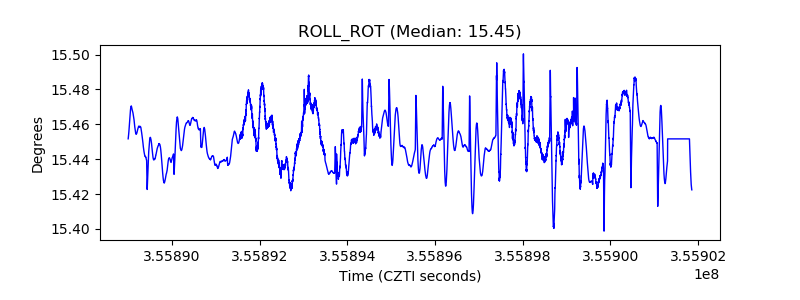 |
| _Roll_DEC | 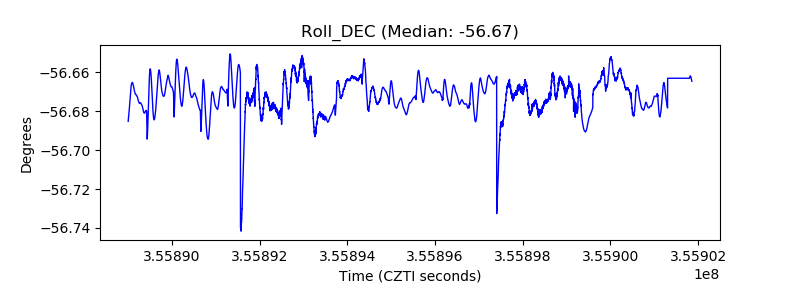 |
| _Roll_RA | 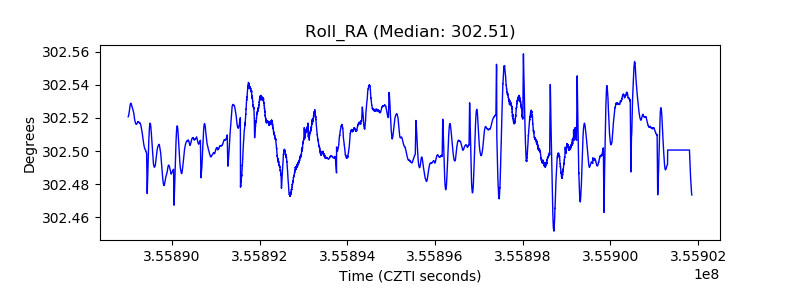 |
| Veto Counter | 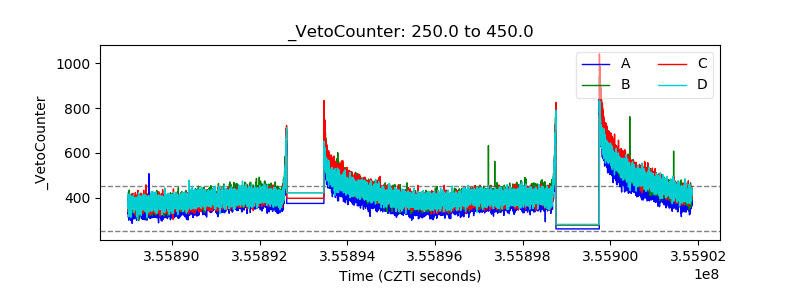 |