| Param | Original file | Final file |
|---|---|---|
| Filename | modeM0/AS1A10_058T01_9000004298_29947cztM0_level2.evt | modeM0/AS1A10_058T01_9000004298_29947cztM0_level2_quad_clean.evt |
| Size (bytes) | 837,299,520 | 151,459,200 |
| Size | 798.5 MB | 144.4 MB |
| Events in quadrant A | 5,168,427 | 997,806 |
| Events in quadrant B | 8,025,853 | 986,695 |
| Events in quadrant C | 5,558,111 | 957,302 |
| Events in quadrant D | 5,923,592 | 946,014 |
| Mode M9 | |||
|---|---|---|---|
| Quadrant | BADHDUFLAG | Total packets | Discarded packets |
| A | 0 | 23 | 0 |
| B | 0 | 23 | 0 |
| C | 0 | 23 | 0 |
| D | 0 | 23 | 0 |
| Mode M0 | |||
|---|---|---|---|
| Quadrant | BADHDUFLAG | Total packets | Discarded packets |
| A | 0 | 21588 | 2 |
| B | 0 | 30768 | 2 |
| C | 0 | 22621 | 2 |
| D | 0 | 23843 | 2 |
| Mode SS | |||
|---|---|---|---|
| Quadrant | BADHDUFLAG | Total packets | Discarded packets |
| A | 0 | 208 | 0 |
| B | 0 | 208 | 0 |
| C | 0 | 208 | 0 |
| D | 0 | 208 | 0 |
| Quadrant | Total seconds | Saturated seconds | Saturation percentage |
|---|---|---|---|
| A | 10089 | 86 | 0.852414% |
| B | 10089 | 125 | 1.238973% |
| C | 10089 | 247 | 2.448211% |
| D | 10088 | 76 | 0.753370% |
Noise dominated data is calculated using 1-second bins in cleaned event files. If a bin has >2000 counts, and if more than 50% of those come from <1% of pixels, then it is considered to be noise-dominated and hence unusable.
| Quadrant | # 1 sec bins | Bins with >0 counts | Bins with >2000 counts | High rate bins dominated by noise | Noise dominated (total time) | Noise dominated (detector-on time) | Marked lightcurve |
|---|---|---|---|---|---|---|---|
| A | 12483 | 10090 | 4 | 4 | 0.03% | 0.04% |  |
| B | 12484 | 10091 | 4 | 4 | 0.03% | 0.04% |  |
| C | 12483 | 10090 | 2 | 2 | 0.02% | 0.02% | 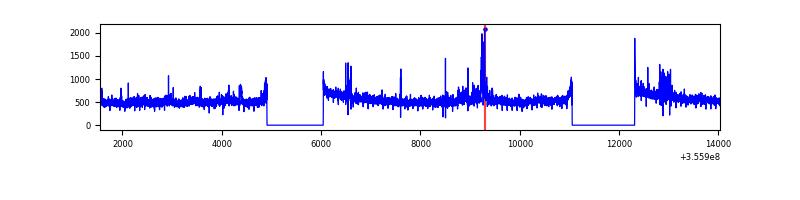 |
| D | 12483 | 10090 | 15 | 15 | 0.12% | 0.15% | 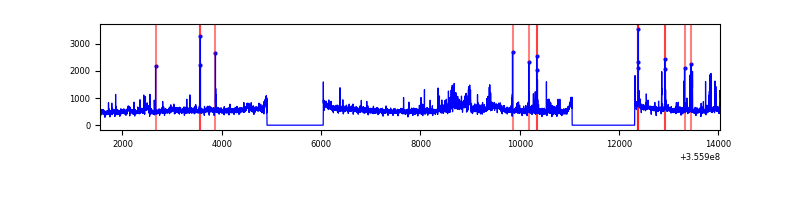 |
Top three noisy pixels from each quadrant. If the there are fewer than three noisy pixels in the level2.evt file, extra rows are filled as -1
| Pixel properties | Quadrant properties | ||||||
|---|---|---|---|---|---|---|---|
| Quadrant | DetID | PixID | Counts | Sigma | Mean | Median | Sigma |
| A | 8 | 192 | 28550 | 104.26 | 1331 | 1307 | 261.3 |
| A | 13 | 254 | 18414 | 65.47 | 1331 | 1307 | 261.3 |
| A | 3 | 137 | 12088 | 41.26 | 1331 | 1307 | 261.3 |
| B | 6 | 159 | 2850173 | 11863.68 | 1296 | 1264 | 240.1 |
| B | 5 | 255 | 43745 | 176.9 | 1296 | 1264 | 240.1 |
| B | 12 | 111 | 28650 | 114.04 | 1296 | 1264 | 240.1 |
| C | 3 | 233 | 300431 | 1036.53 | 1265 | 1275 | 288.6 |
| C | 14 | 238 | 243558 | 839.47 | 1265 | 1275 | 288.6 |
| C | 14 | 254 | 53462 | 180.82 | 1265 | 1275 | 288.6 |
| D | 8 | 195 | 614203 | 2040.36 | 1300 | 1272 | 300.4 |
| D | 12 | 233 | 192177 | 635.5 | 1300 | 1272 | 300.4 |
| D | 6 | 112 | 56633 | 184.29 | 1300 | 1272 | 300.4 |
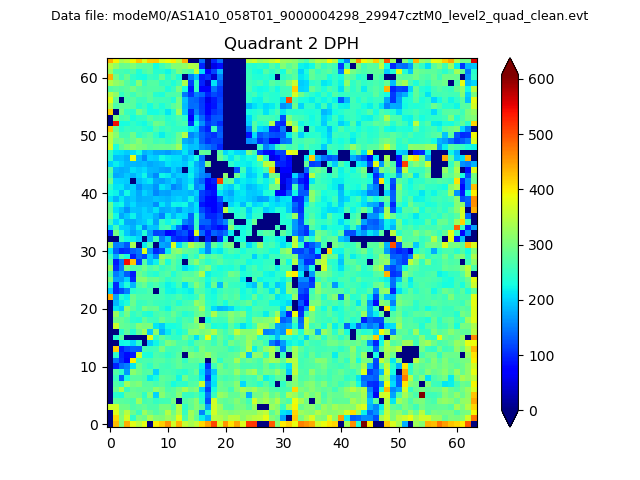
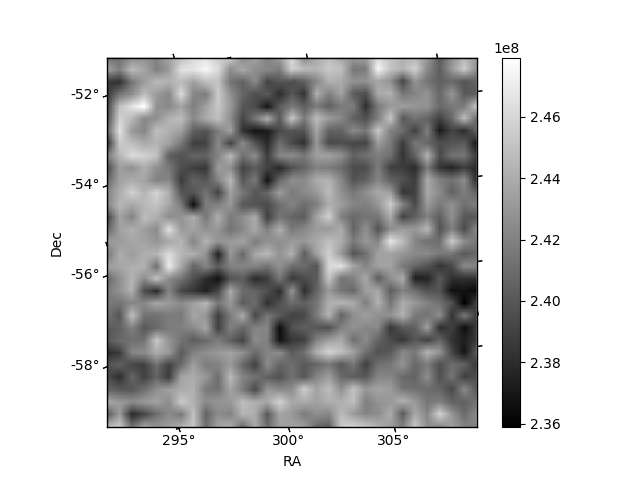
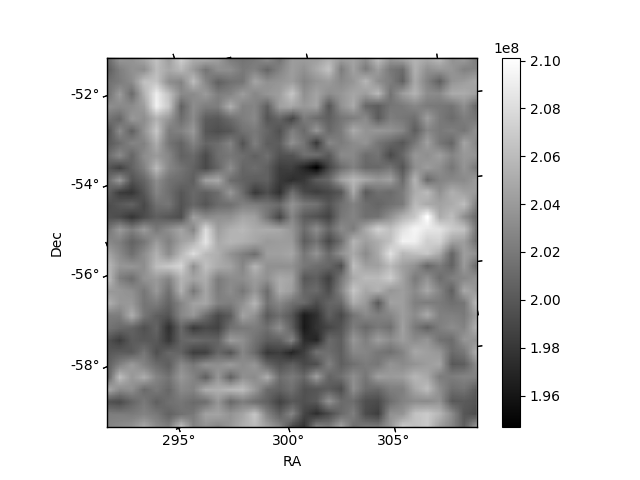
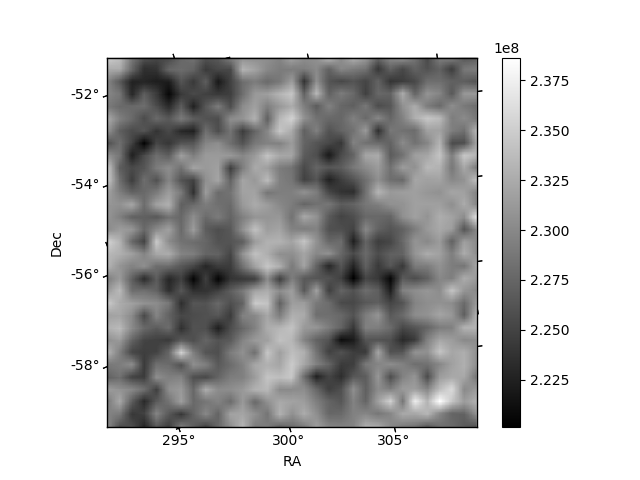
Histogram calculated using DETX and DETY for each event in the final _common_clean file
| Quadrant A | 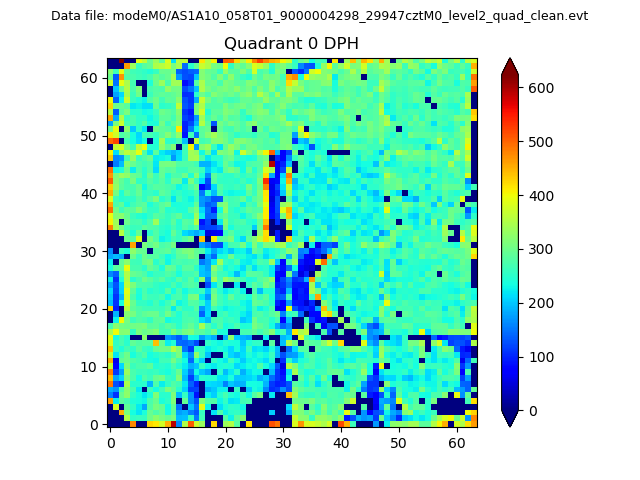 |
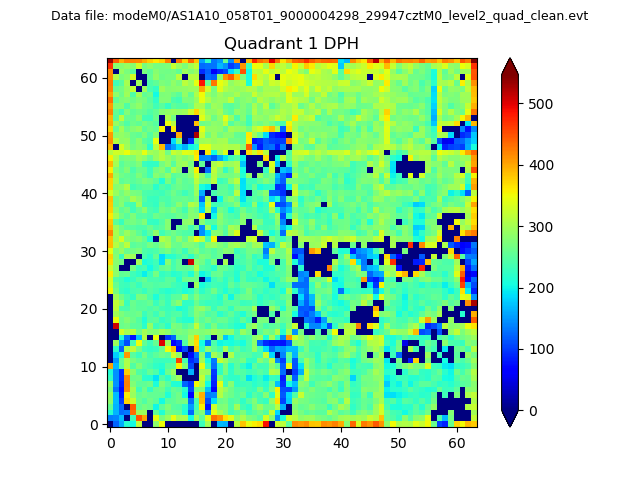 |
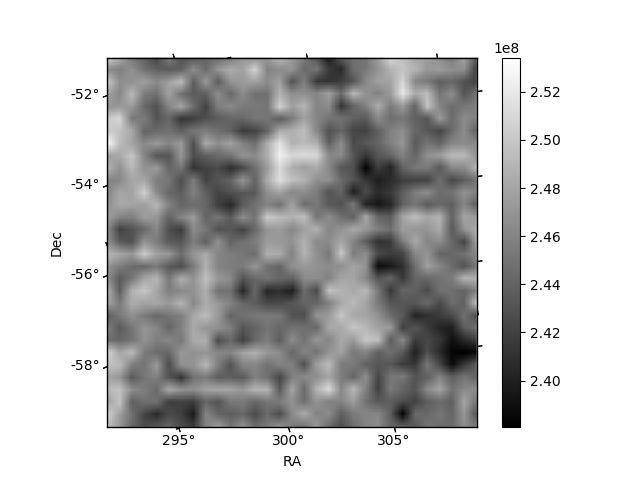
Quadrant B |
|---|---|---|---|
| Quadrant D | 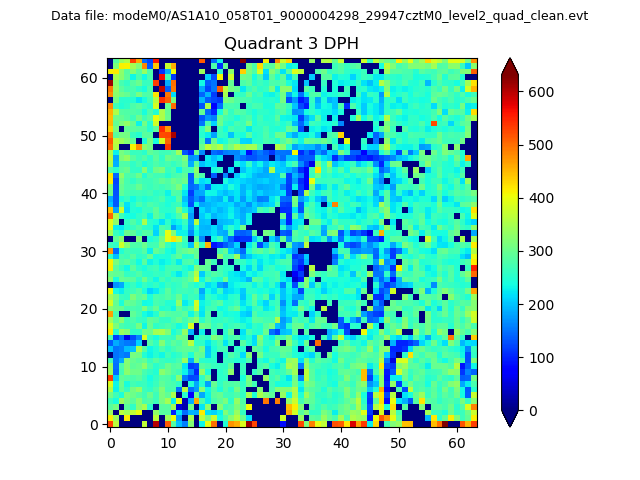 |
 |
Quadrant C |
| Plot type | Count rate plots | Images |
|---|---|---|
| Comparison with Poisson distribution Blue bars denote a histogram of data divided into 1 sec bins. Red curve is a Poisson curve with rate = median count rate of data. |
 |
 |
| Quadrant-wise count rates Data is divided into 100 sec bins |
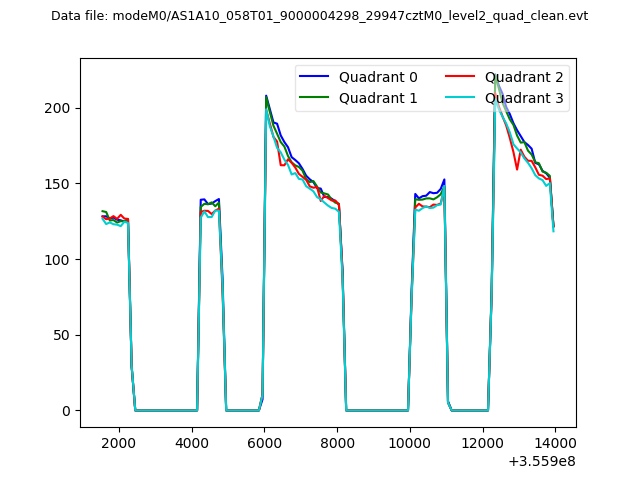 |
|
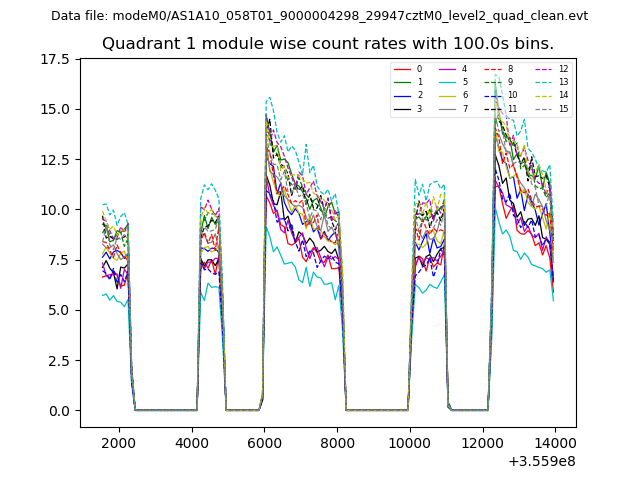
| Module-wise count rates for Quadrant A Data is divided into 100 sec bins |
 |
 |
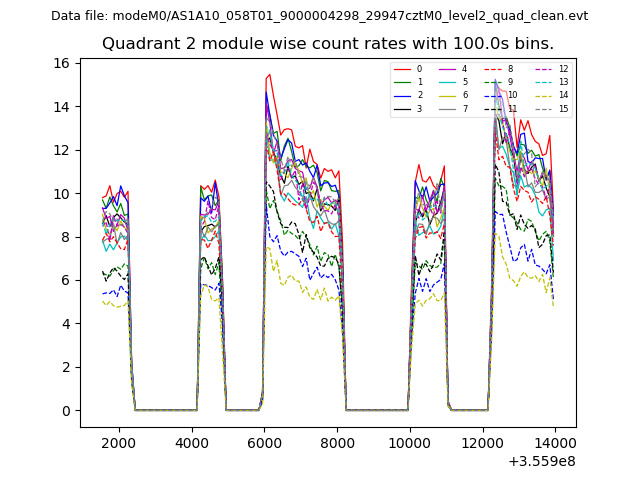
| Module-wise count rates for Quadrant B Data is divided into 100 sec bins |
 |
 |
| Module-wise count rates for Quadrant C Data is divided into 100 sec bins |
 |
 |
| Module-wise count rates for Quadrant D Data is divided into 100 sec bins |
 |
 |
| Parameter | Plot |
|---|---|
| CZT HV Monitor | 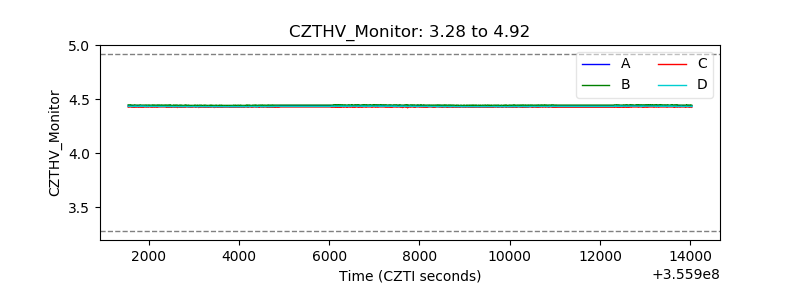 |
| D_VDD | 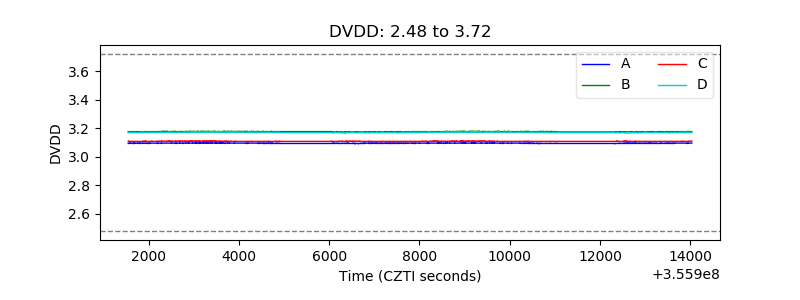 |
| Temperature 1 | 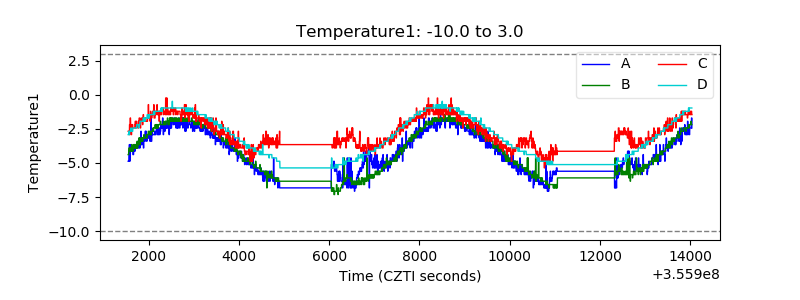 |
| Veto HV Monitor | 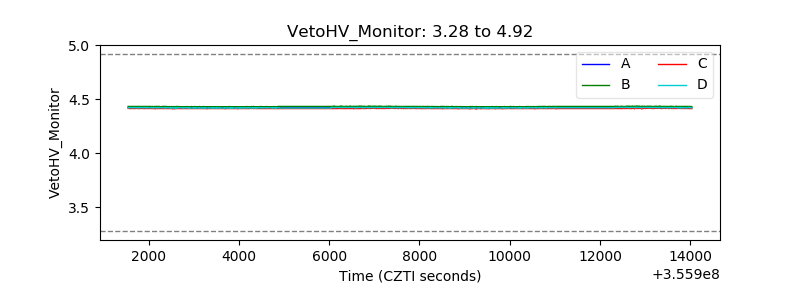 |
| Veto LLD |  |
| Alpha Counter | 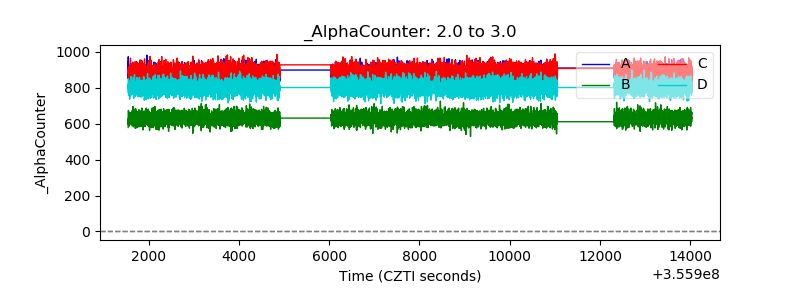 |
| _CPM_Rate | 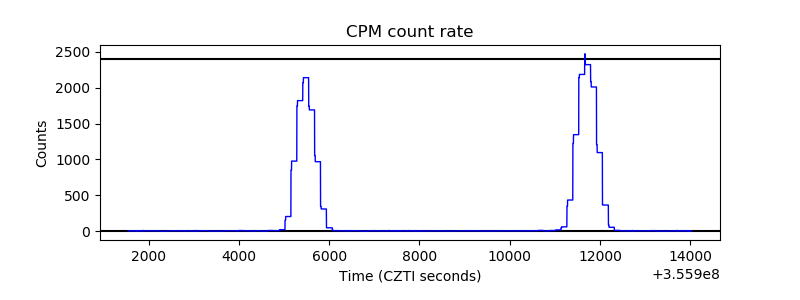 |
| CZT Counter | 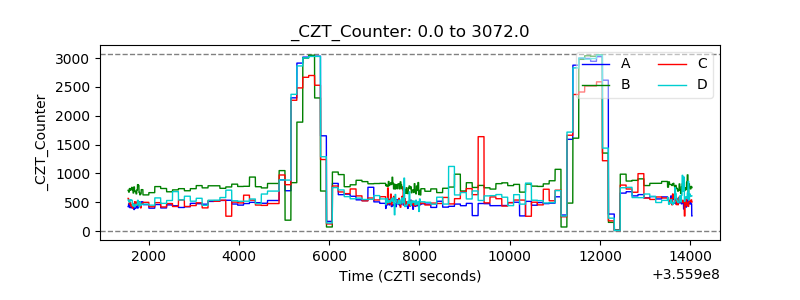 |
| +2.5 Volts monitor |  |
| +5 Volts monitor |  |
| _ROLL_ROT | 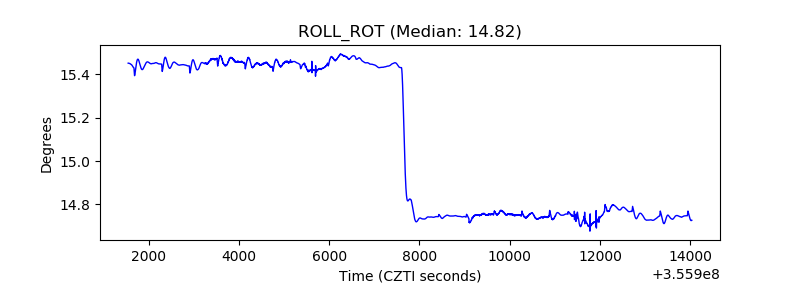 |
| _Roll_DEC | 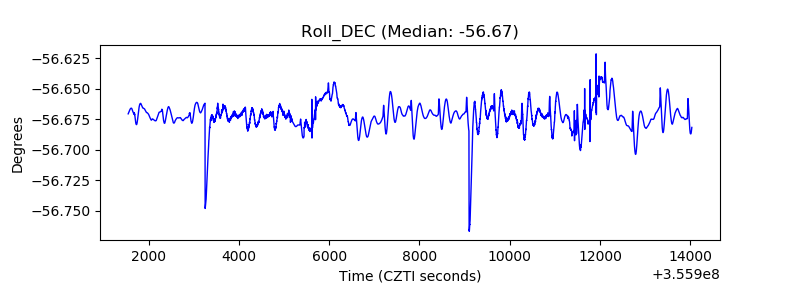 |
| _Roll_RA | 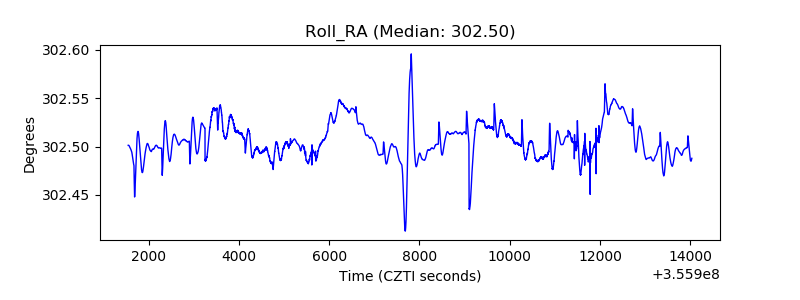 |
| Veto Counter |  |