| Param | Original file | Final file |
|---|---|---|
| Filename | modeM0/AS1A10_058T01_9000004298_29948cztM0_level2.evt | modeM0/AS1A10_058T01_9000004298_29948cztM0_level2_quad_clean.evt |
| Size (bytes) | 490,069,440 | 86,376,960 |
| Size | 467.4 MB | 82.4 MB |
| Events in quadrant A | 2,996,849 | 577,295 |
| Events in quadrant B | 4,652,762 | 568,751 |
| Events in quadrant C | 3,358,138 | 541,070 |
| Events in quadrant D | 3,457,824 | 540,009 |
| Mode M9 | |||
|---|---|---|---|
| Quadrant | BADHDUFLAG | Total packets | Discarded packets |
| A | 0 | 13 | 0 |
| B | 0 | 13 | 0 |
| C | 0 | 13 | 0 |
| D | 0 | 13 | 0 |
| Mode M0 | |||
|---|---|---|---|
| Quadrant | BADHDUFLAG | Total packets | Discarded packets |
| A | 0 | 12163 | 1 |
| B | 0 | 17454 | 1 |
| C | 0 | 13417 | 1 |
| D | 0 | 13854 | 1 |
| Mode SS | |||
|---|---|---|---|
| Quadrant | BADHDUFLAG | Total packets | Discarded packets |
| A | 0 | 114 | 0 |
| B | 0 | 114 | 0 |
| C | 0 | 114 | 0 |
| D | 0 | 114 | 0 |
| Quadrant | Total seconds | Saturated seconds | Saturation percentage |
|---|---|---|---|
| A | 5552 | 70 | 1.260807% |
| B | 5553 | 110 | 1.980911% |
| C | 5553 | 161 | 2.899334% |
| D | 5552 | 74 | 1.332853% |
Noise dominated data is calculated using 1-second bins in cleaned event files. If a bin has >2000 counts, and if more than 50% of those come from <1% of pixels, then it is considered to be noise-dominated and hence unusable.
| Quadrant | # 1 sec bins | Bins with >0 counts | Bins with >2000 counts | High rate bins dominated by noise | Noise dominated (total time) | Noise dominated (detector-on time) | Marked lightcurve |
|---|---|---|---|---|---|---|---|
| A | 6862 | 5553 | 1 | 1 | 0.01% | 0.02% | 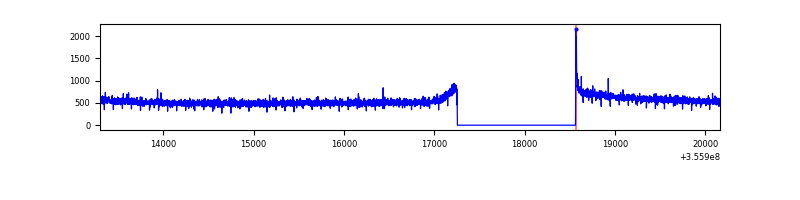 |
| B | 6863 | 5554 | 10 | 10 | 0.15% | 0.18% | 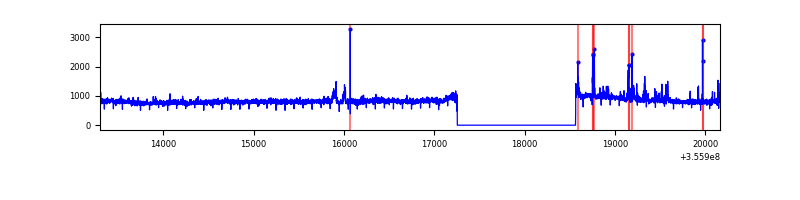 |
| C | 6863 | 5554 | 0 | 0 | 0.00% | 0.00% | 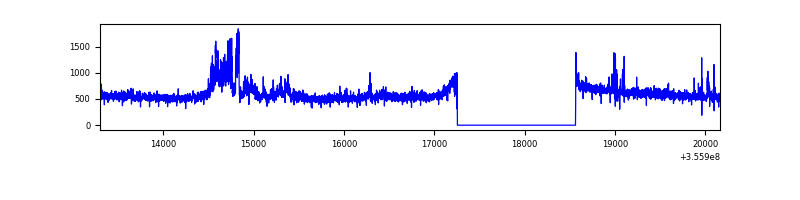 |
| D | 6862 | 5553 | 18 | 18 | 0.26% | 0.32% | 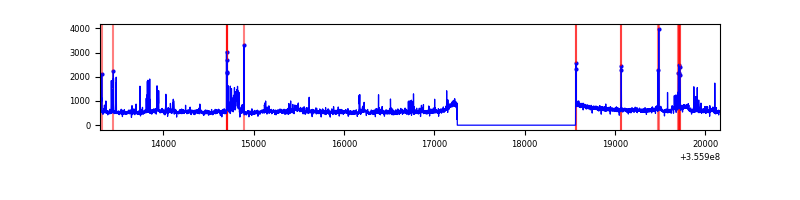 |
Top three noisy pixels from each quadrant. If the there are fewer than three noisy pixels in the level2.evt file, extra rows are filled as -1
| Pixel properties | Quadrant properties | ||||||
|---|---|---|---|---|---|---|---|
| Quadrant | DetID | PixID | Counts | Sigma | Mean | Median | Sigma |
| A | 8 | 192 | 11246 | 68.66 | 773 | 760 | 152.7 |
| A | 13 | 254 | 10566 | 64.2 | 773 | 760 | 152.7 |
| A | 0 | 226 | 6694 | 38.85 | 773 | 760 | 152.7 |
| B | 6 | 159 | 1588256 | 11276.44 | 748 | 731 | 140.8 |
| B | 3 | 64 | 79480 | 559.37 | 748 | 731 | 140.8 |
| B | 3 | 209 | 41955 | 292.82 | 748 | 731 | 140.8 |
| C | 3 | 233 | 363247 | 2195.92 | 723 | 729 | 165.1 |
| C | 14 | 238 | 137571 | 828.91 | 723 | 729 | 165.1 |
| C | 14 | 254 | 25080 | 147.5 | 723 | 729 | 165.1 |
| D | 8 | 195 | 369473 | 2138.04 | 748 | 733 | 172.5 |
| D | 7 | 80 | 64215 | 368.08 | 748 | 733 | 172.5 |
| D | 2 | 250 | 47139 | 269.07 | 748 | 733 | 172.5 |
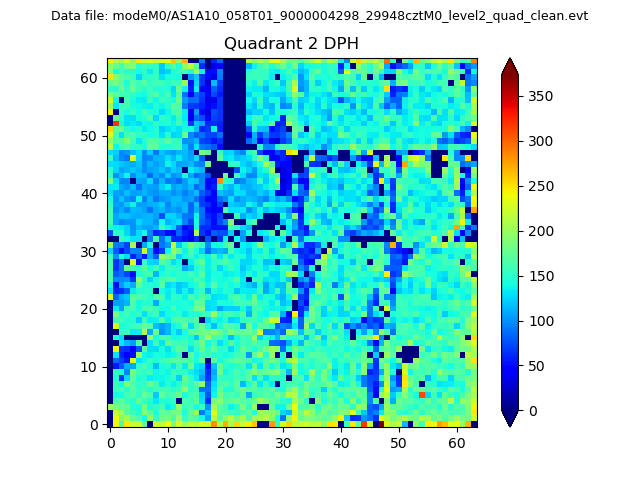
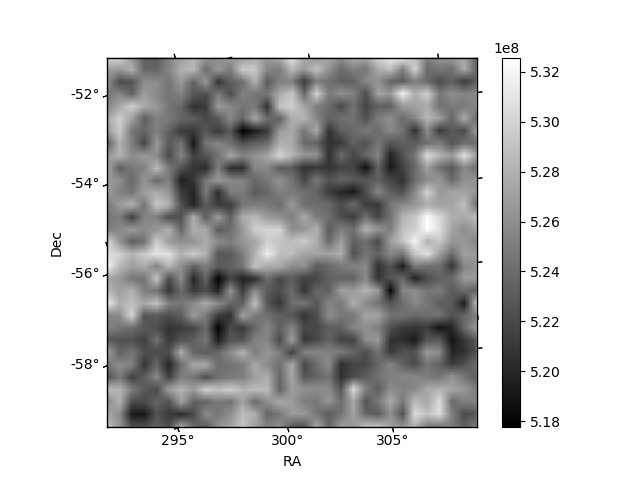
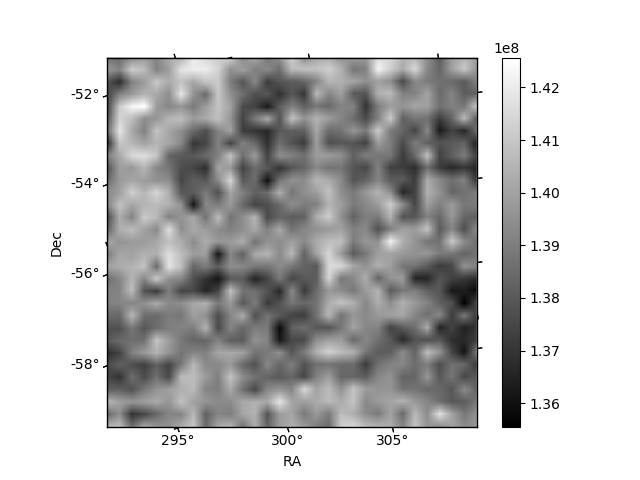
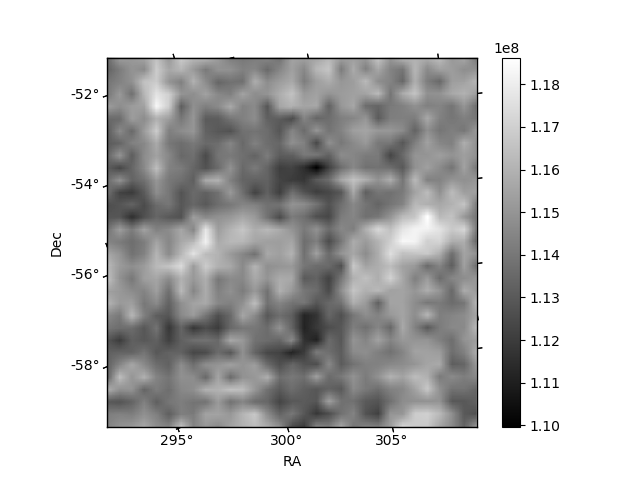
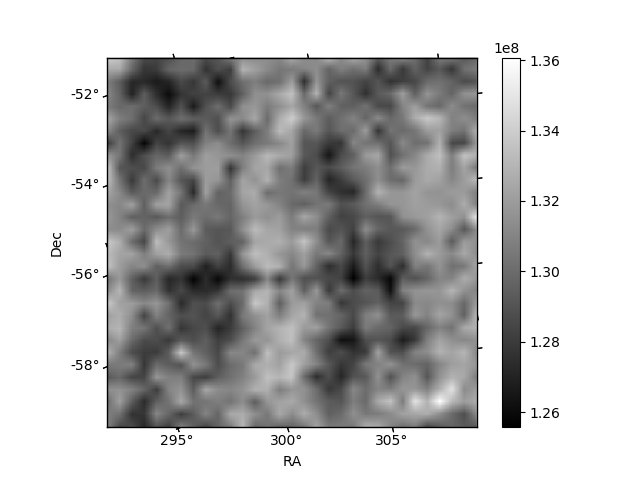
Histogram calculated using DETX and DETY for each event in the final _common_clean file
| Quadrant A | 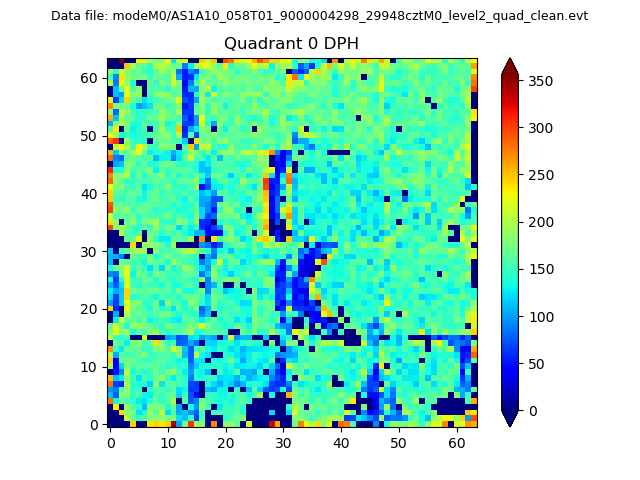 |
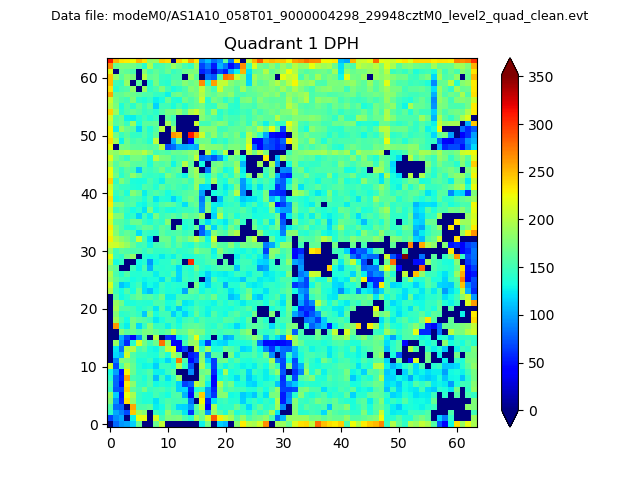 |
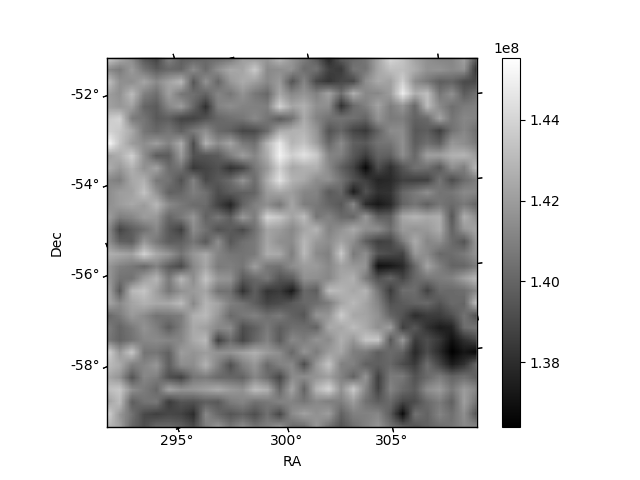
Quadrant B |
|---|---|---|---|
| Quadrant D | 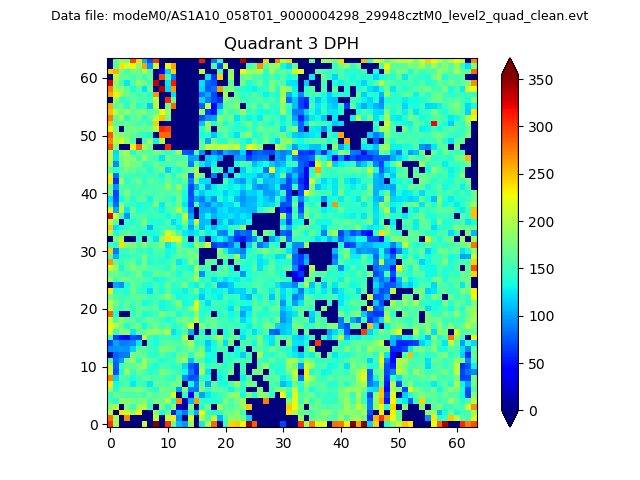 |
 |
Quadrant C |
| Plot type | Count rate plots | Images |
|---|---|---|
| Comparison with Poisson distribution Blue bars denote a histogram of data divided into 1 sec bins. Red curve is a Poisson curve with rate = median count rate of data. |
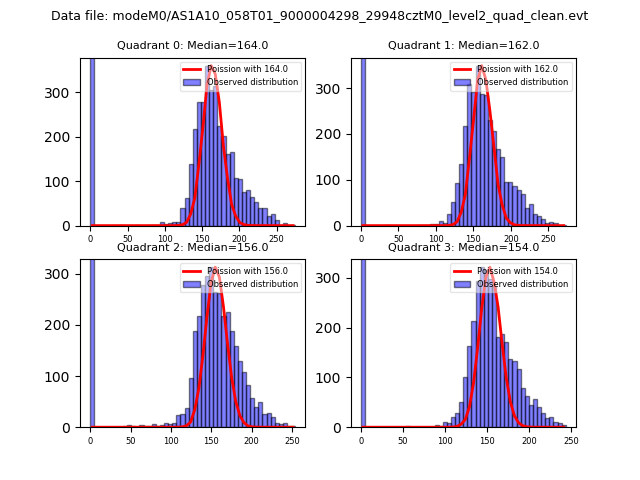 |
 |
| Quadrant-wise count rates Data is divided into 100 sec bins |
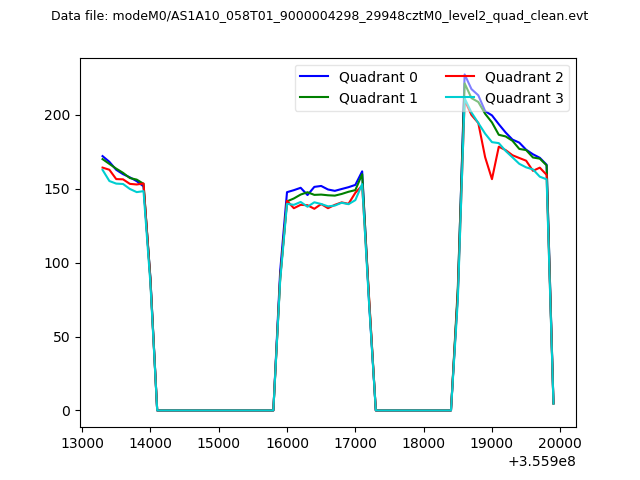 |
|
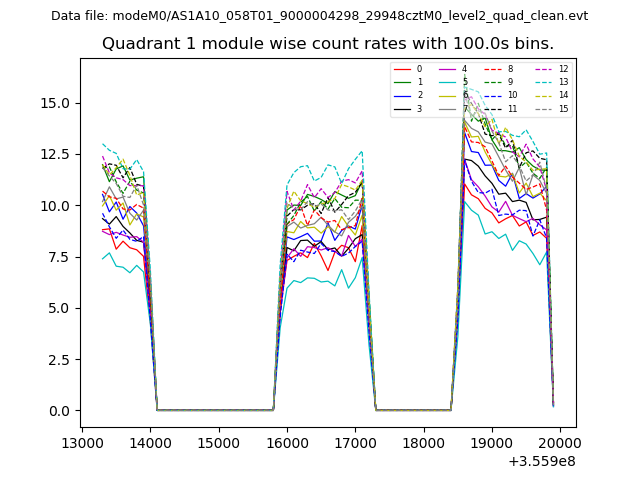
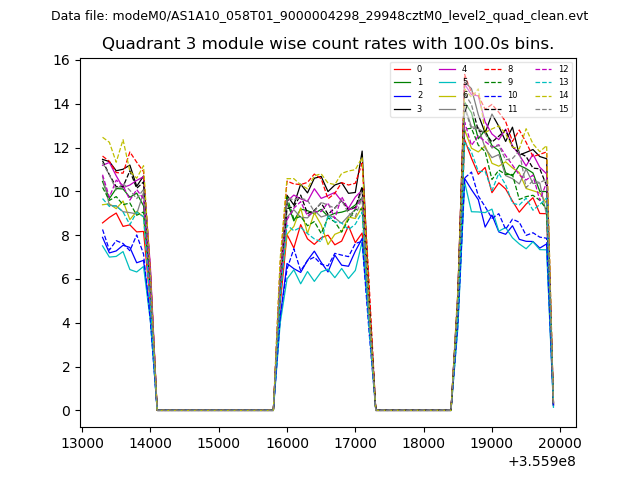
| Module-wise count rates for Quadrant A Data is divided into 100 sec bins |
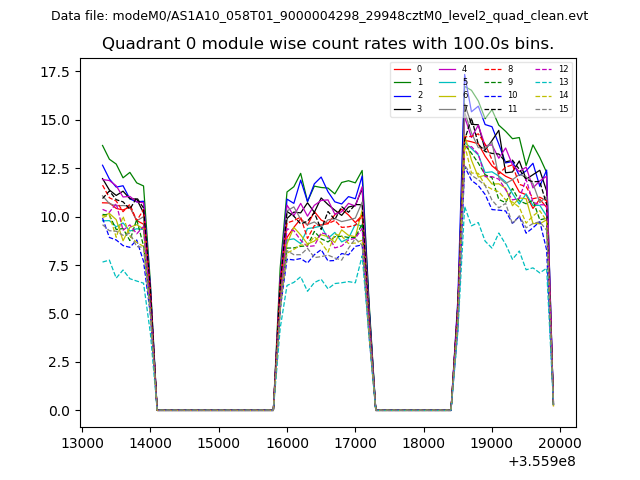 |
 |
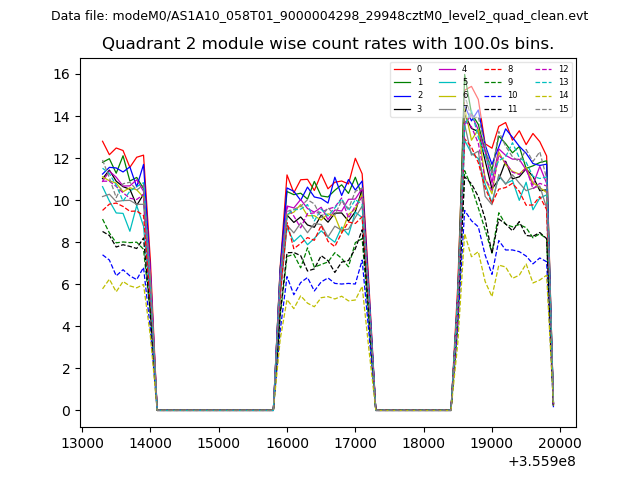
| Module-wise count rates for Quadrant B Data is divided into 100 sec bins |
 |
 |
| Module-wise count rates for Quadrant C Data is divided into 100 sec bins |
 |
 |
| Module-wise count rates for Quadrant D Data is divided into 100 sec bins |
 |
 |
| Parameter | Plot |
|---|---|
| CZT HV Monitor | 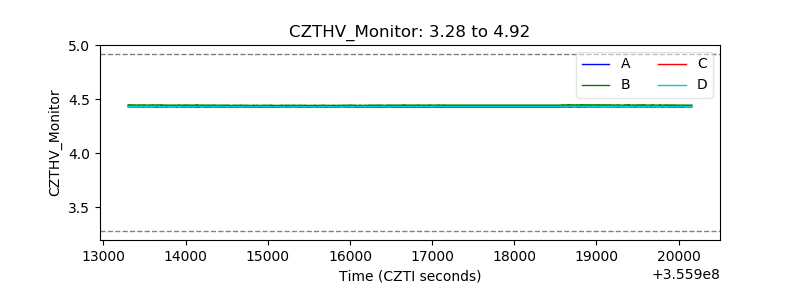 |
| D_VDD | 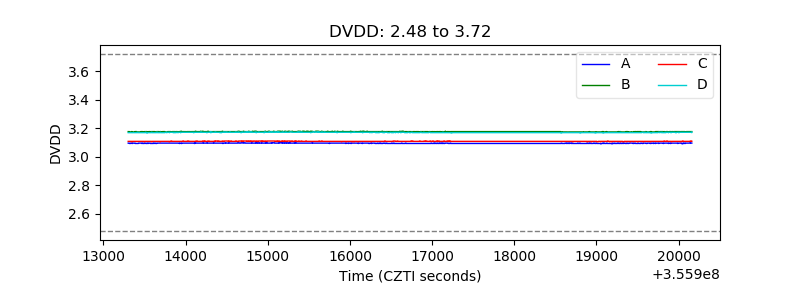 |
| Temperature 1 | 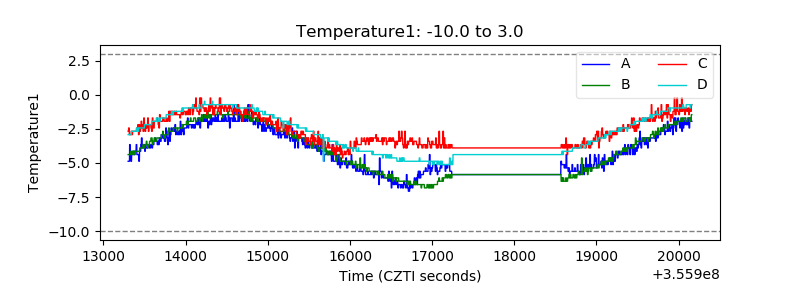 |
| Veto HV Monitor | 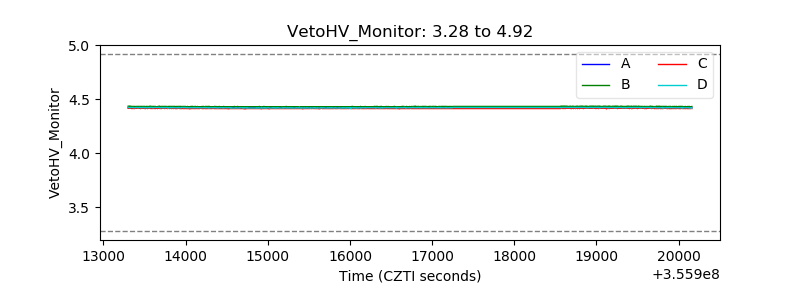 |
| Veto LLD | 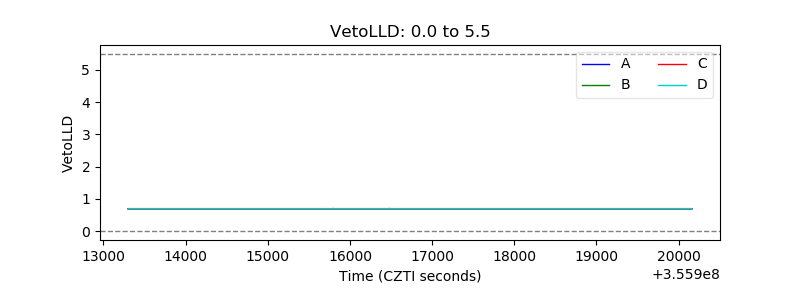 |
| Alpha Counter | 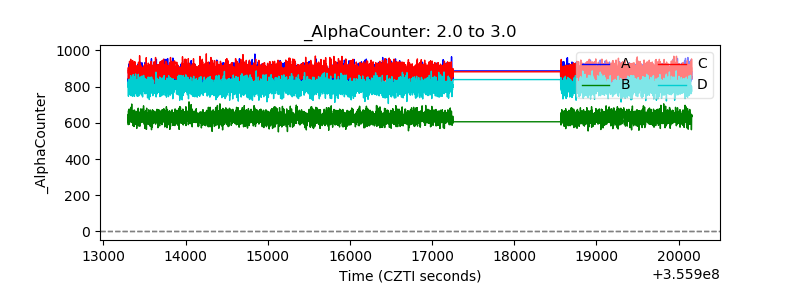 |
| _CPM_Rate | 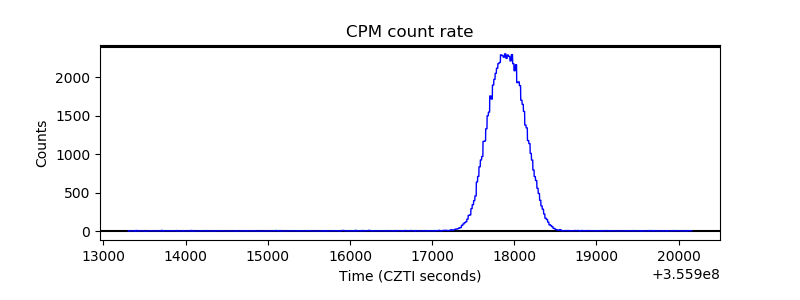 |
| CZT Counter | 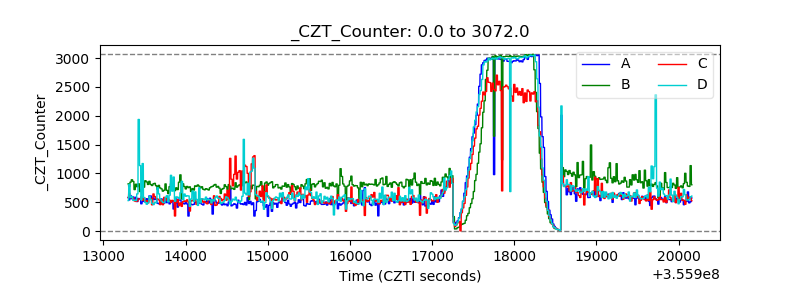 |
| +2.5 Volts monitor | 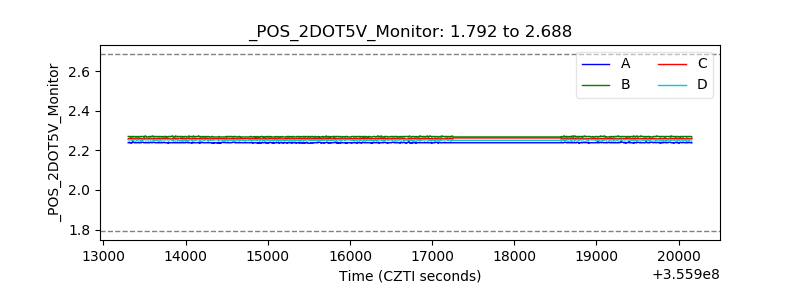 |
| +5 Volts monitor | 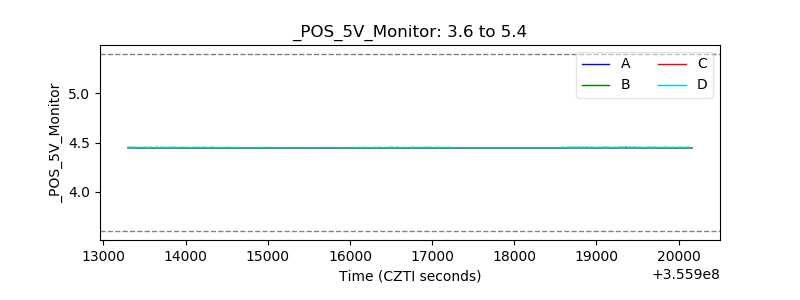 |
| _ROLL_ROT | 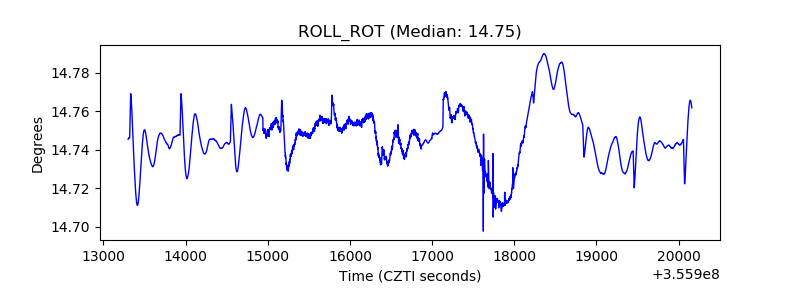 |
| _Roll_DEC | 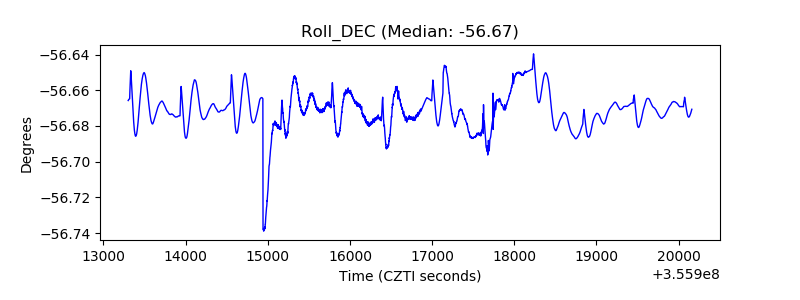 |
| _Roll_RA | 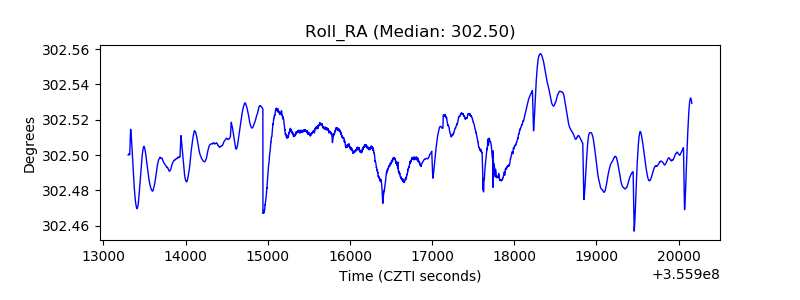 |
| Veto Counter | 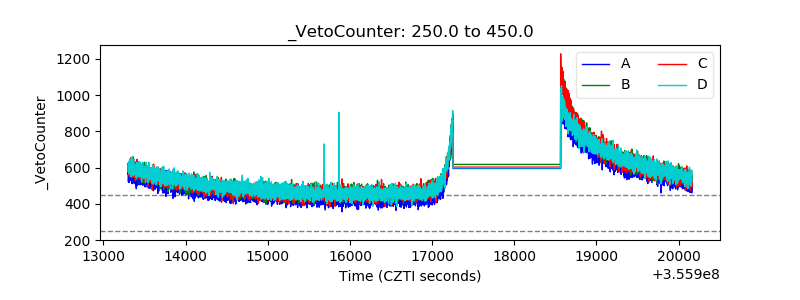 |