| Param | Original file | Final file |
|---|---|---|
| Filename | modeM0/AS1A10_058T01_9000004298_29949cztM0_level2.evt | modeM0/AS1A10_058T01_9000004298_29949cztM0_level2_quad_clean.evt |
| Size (bytes) | 575,925,120 | 98,127,360 |
| Size | 549.2 MB | 93.6 MB |
| Events in quadrant A | 3,506,099 | 658,947 |
| Events in quadrant B | 5,571,931 | 646,666 |
| Events in quadrant C | 3,863,505 | 609,746 |
| Events in quadrant D | 4,068,825 | 611,117 |
| Mode M9 | |||
|---|---|---|---|
| Quadrant | BADHDUFLAG | Total packets | Discarded packets |
| A | 0 | 13 | 0 |
| B | 0 | 13 | 0 |
| C | 0 | 13 | 0 |
| D | 0 | 13 | 0 |
| Mode M0 | |||
|---|---|---|---|
| Quadrant | BADHDUFLAG | Total packets | Discarded packets |
| A | 0 | 14247 | 1 |
| B | 0 | 20629 | 1 |
| C | 0 | 15816 | 2 |
| D | 0 | 16668 | 1 |
| Mode SS | |||
|---|---|---|---|
| Quadrant | BADHDUFLAG | Total packets | Discarded packets |
| A | 0 | 130 | 0 |
| B | 0 | 130 | 0 |
| C | 0 | 130 | 0 |
| D | 0 | 130 | 0 |
| Quadrant | Total seconds | Saturated seconds | Saturation percentage |
|---|---|---|---|
| A | 6378 | 93 | 1.458137% |
| B | 6378 | 230 | 3.606146% |
| C | 6378 | 237 | 3.715898% |
| D | 6378 | 83 | 1.301348% |
Noise dominated data is calculated using 1-second bins in cleaned event files. If a bin has >2000 counts, and if more than 50% of those come from <1% of pixels, then it is considered to be noise-dominated and hence unusable.
| Quadrant | # 1 sec bins | Bins with >0 counts | Bins with >2000 counts | High rate bins dominated by noise | Noise dominated (total time) | Noise dominated (detector-on time) | Marked lightcurve |
|---|---|---|---|---|---|---|---|
| A | 7687 | 6378 | 0 | 0 | 0.00% | 0.00% | 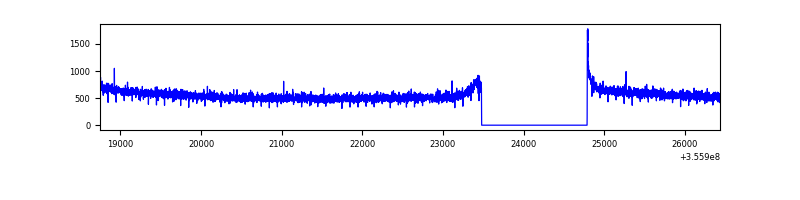 |
| B | 7687 | 6378 | 71 | 71 | 0.92% | 1.11% | 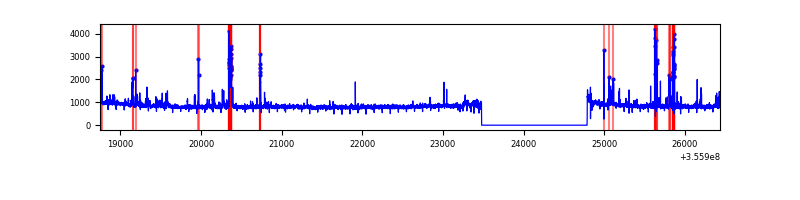 |
| C | 7688 | 6379 | 0 | 0 | 0.00% | 0.00% | 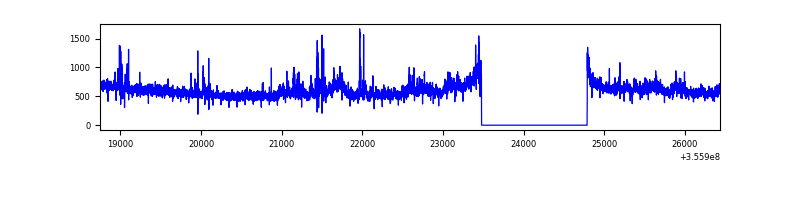 |
| D | 7688 | 6379 | 20 | 20 | 0.26% | 0.31% | 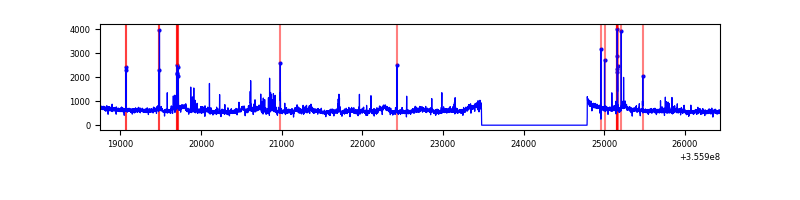 |
Top three noisy pixels from each quadrant. If the there are fewer than three noisy pixels in the level2.evt file, extra rows are filled as -1
| Pixel properties | Quadrant properties | ||||||
|---|---|---|---|---|---|---|---|
| Quadrant | DetID | PixID | Counts | Sigma | Mean | Median | Sigma |
| A | 13 | 254 | 12458 | 65.54 | 905 | 890 | 176.5 |
| A | 8 | 192 | 10928 | 56.87 | 905 | 890 | 176.5 |
| A | 0 | 226 | 7993 | 40.24 | 905 | 890 | 176.5 |
| B | 6 | 159 | 1786526 | 11115.23 | 870 | 852 | 160.7 |
| B | 3 | 64 | 357469 | 2219.82 | 870 | 852 | 160.7 |
| B | 12 | 111 | 18222 | 108.12 | 870 | 852 | 160.7 |
| C | 3 | 233 | 349583 | 1818.26 | 839 | 847 | 191.8 |
| C | 14 | 238 | 169307 | 878.33 | 839 | 847 | 191.8 |
| C | 14 | 254 | 41218 | 210.49 | 839 | 847 | 191.8 |
| D | 8 | 195 | 537128 | 2654.17 | 874 | 854 | 202.0 |
| D | 2 | 250 | 41835 | 202.83 | 874 | 854 | 202.0 |
| D | 1 | 52 | 39547 | 191.5 | 874 | 854 | 202.0 |
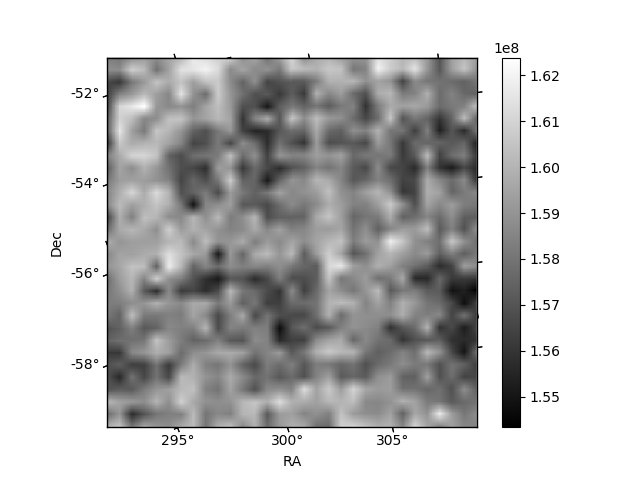
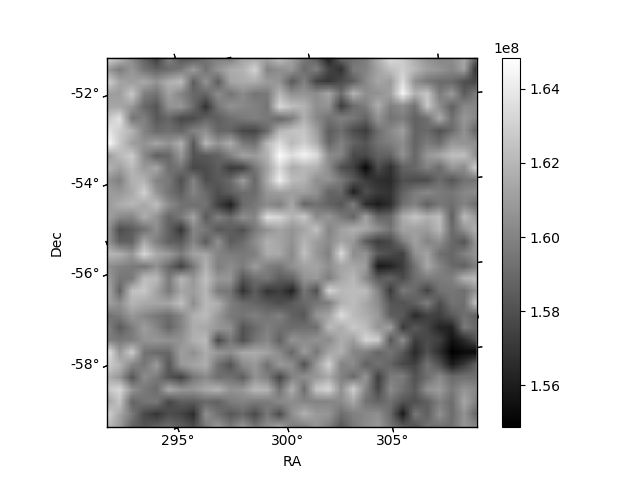
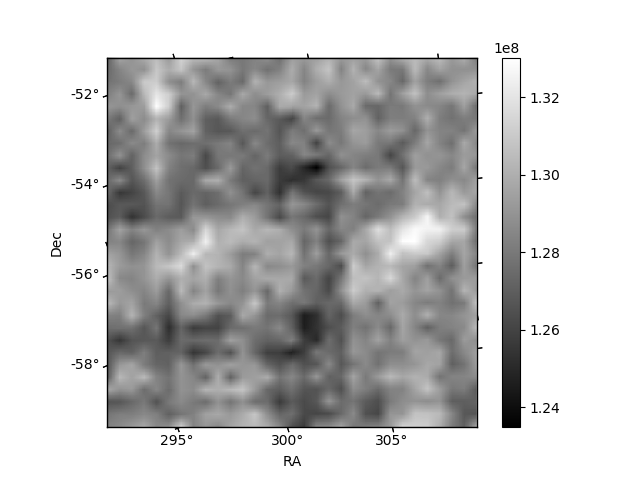
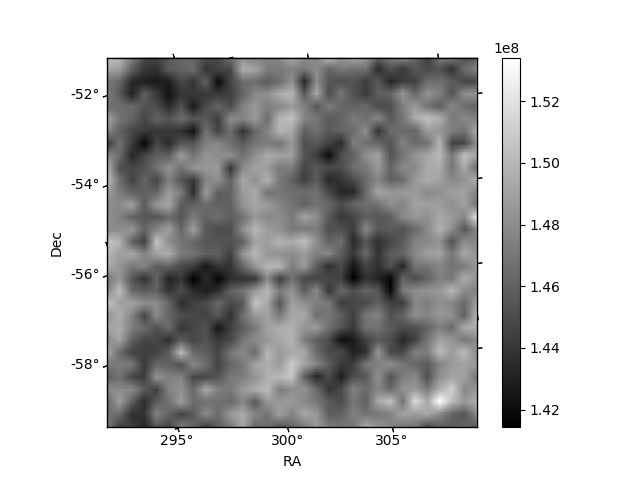
Histogram calculated using DETX and DETY for each event in the final _common_clean file
| Quadrant A |  |
 |
Quadrant B |
|---|---|---|---|
| Quadrant D |  |
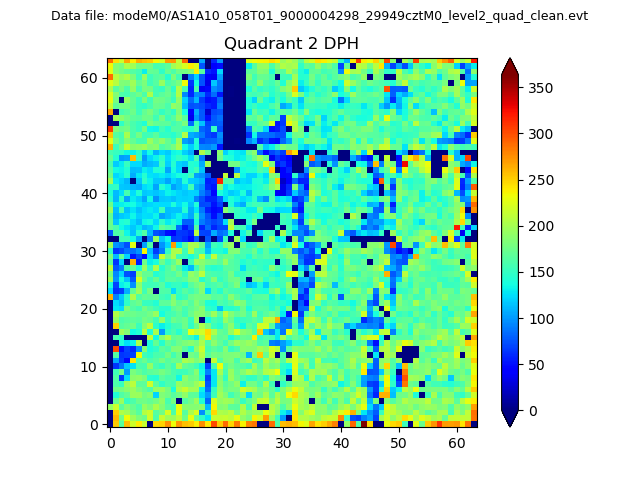 |
Quadrant C |
| Plot type | Count rate plots | Images |
|---|---|---|
| Comparison with Poisson distribution Blue bars denote a histogram of data divided into 1 sec bins. Red curve is a Poisson curve with rate = median count rate of data. |
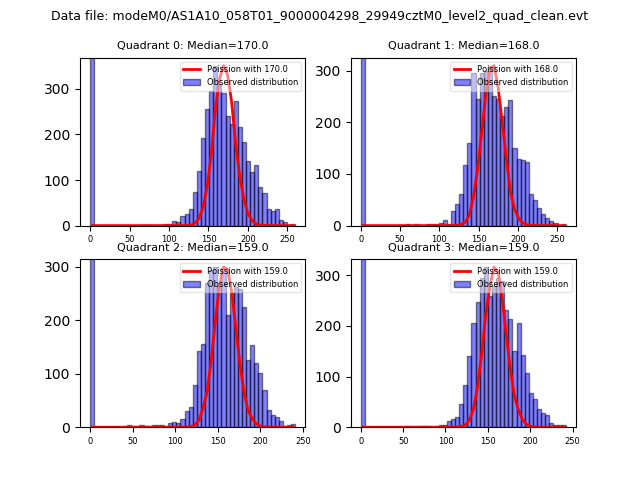 |
 |
| Quadrant-wise count rates Data is divided into 100 sec bins |
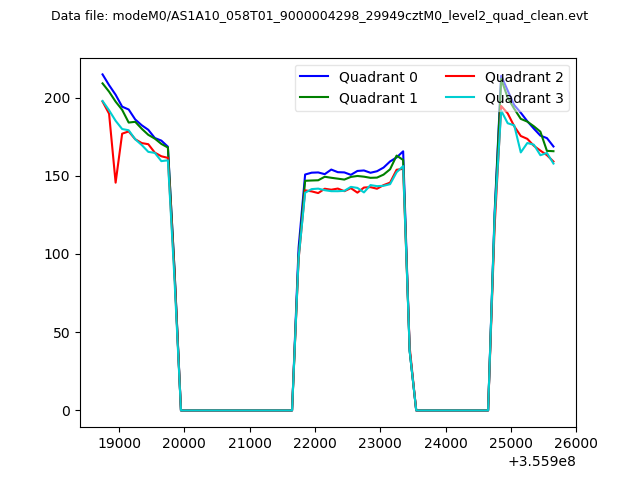 |
|
| Module-wise count rates for Quadrant A Data is divided into 100 sec bins |
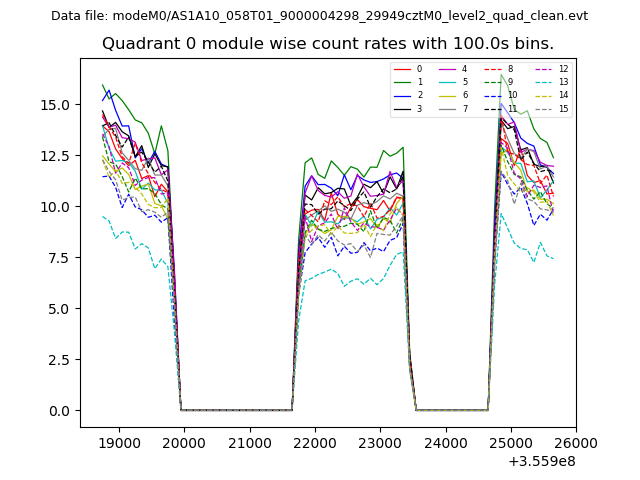 |
 |
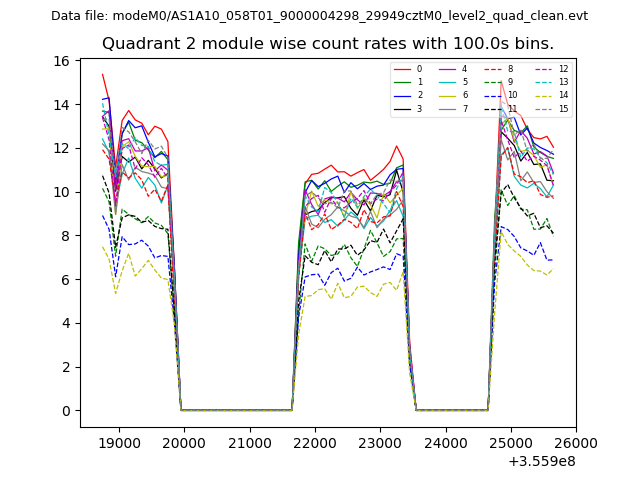
| Module-wise count rates for Quadrant B Data is divided into 100 sec bins |
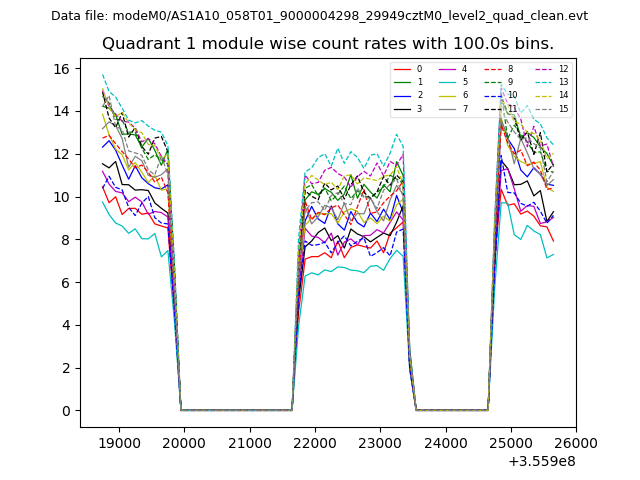 |
 |
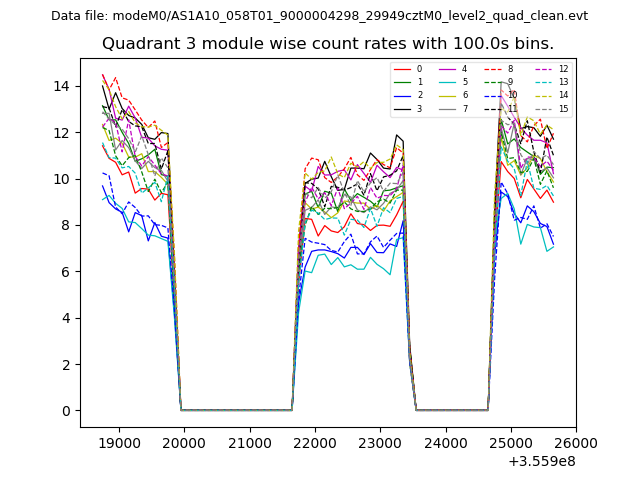
| Module-wise count rates for Quadrant C Data is divided into 100 sec bins |
 |
 |
| Module-wise count rates for Quadrant D Data is divided into 100 sec bins |
 |
 |
| Parameter | Plot |
|---|---|
| CZT HV Monitor |  |
| D_VDD | 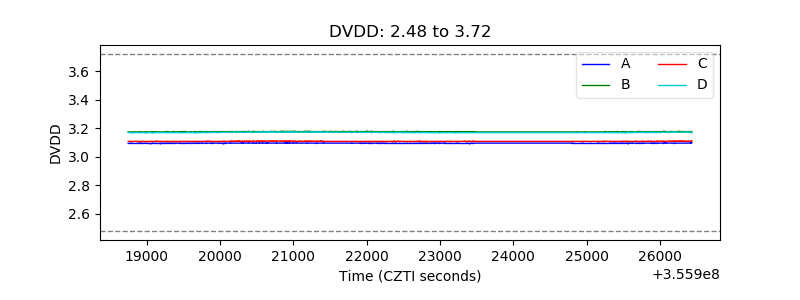 |
| Temperature 1 | 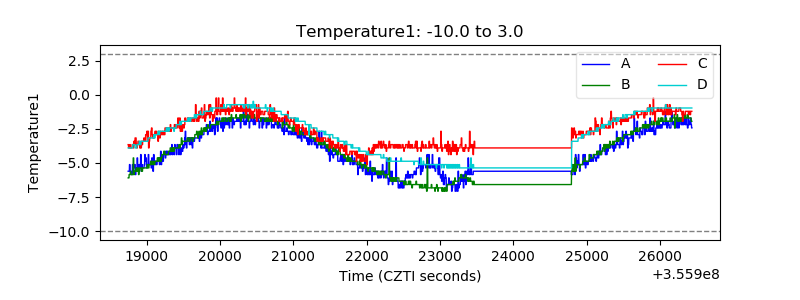 |
| Veto HV Monitor | 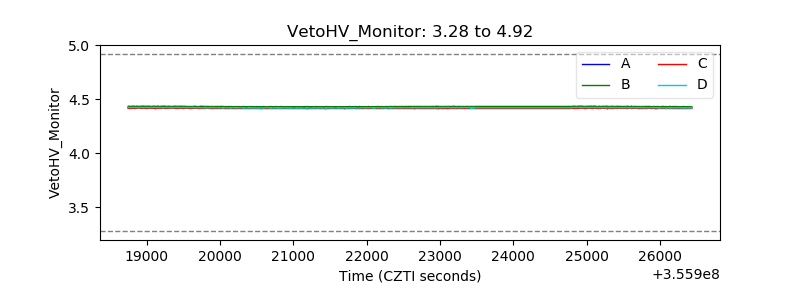 |
| Veto LLD | 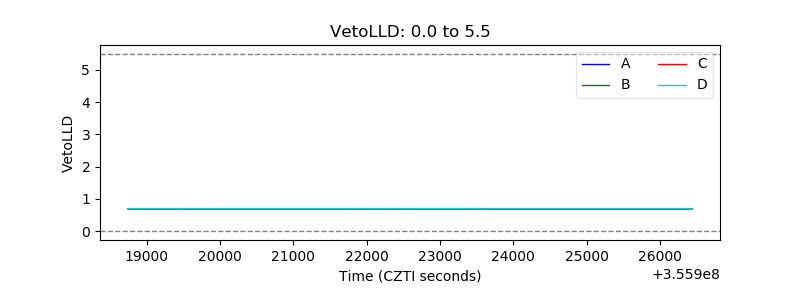 |
| Alpha Counter | 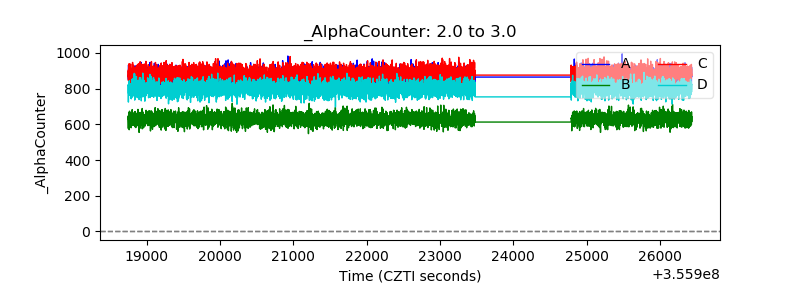 |
| _CPM_Rate | 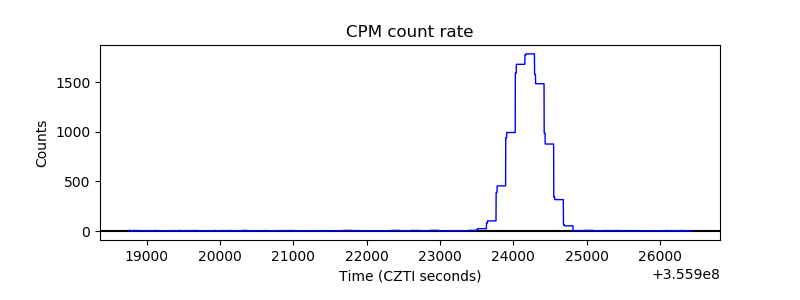 |
| CZT Counter | 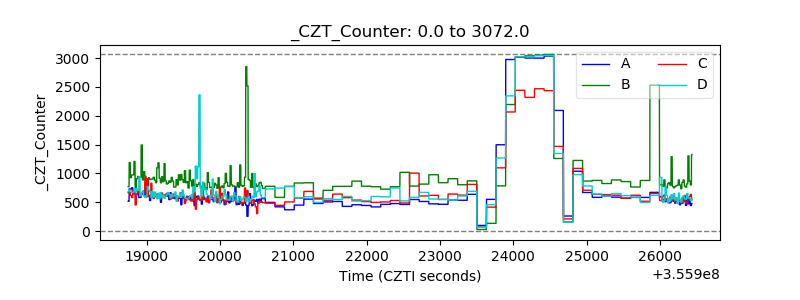 |
| +2.5 Volts monitor |  |
| +5 Volts monitor |  |
| _ROLL_ROT | 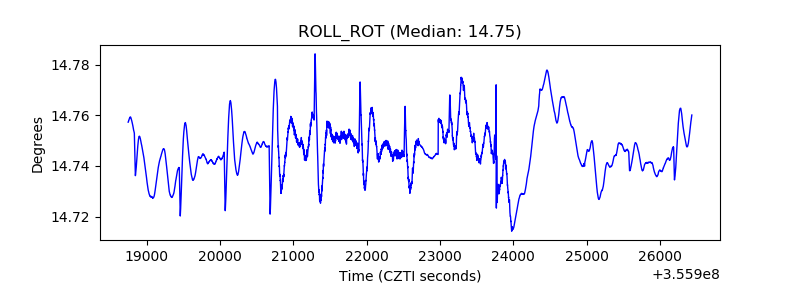 |
| _Roll_DEC | 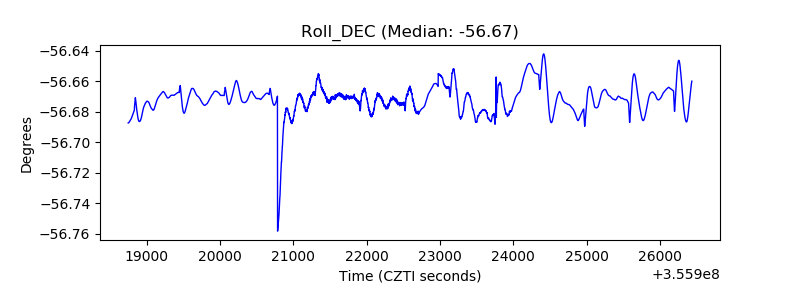 |
| _Roll_RA | 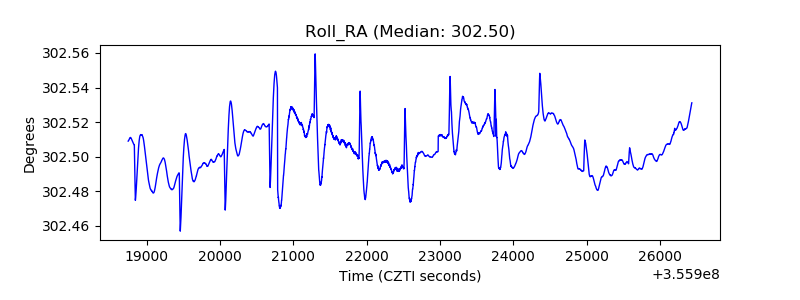 |
| Veto Counter | 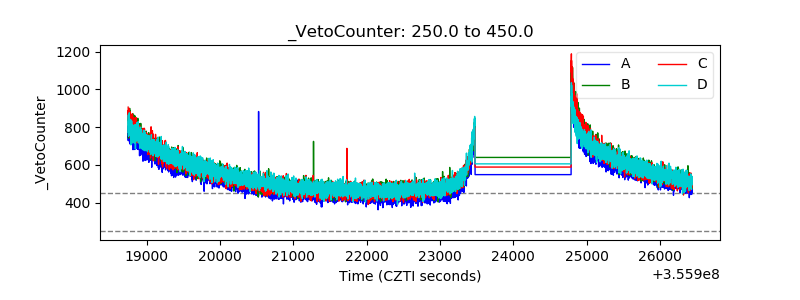 |