| Param | Original file | Final file |
|---|---|---|
| Filename | modeM0/AS1A10_058T01_9000004298_29951cztM0_level2.evt | modeM0/AS1A10_058T01_9000004298_29951cztM0_level2_quad_clean.evt |
| Size (bytes) | 552,283,200 | 78,658,560 |
| Size | 526.7 MB | 75.0 MB |
| Events in quadrant A | 3,322,474 | 499,980 |
| Events in quadrant B | 5,295,387 | 491,268 |
| Events in quadrant C | 3,544,729 | 469,876 |
| Events in quadrant D | 4,122,017 | 466,334 |
| Mode M9 | |||
|---|---|---|---|
| Quadrant | BADHDUFLAG | Total packets | Discarded packets |
| A | 0 | 10 | 0 |
| B | 0 | 10 | 0 |
| C | 0 | 10 | 0 |
| D | 0 | 10 | 0 |
| Mode M0 | |||
|---|---|---|---|
| Quadrant | BADHDUFLAG | Total packets | Discarded packets |
| A | 0 | 13680 | 1 |
| B | 0 | 20015 | 1 |
| C | 0 | 14529 | 1 |
| D | 0 | 16576 | 3 |
| Mode SS | |||
|---|---|---|---|
| Quadrant | BADHDUFLAG | Total packets | Discarded packets |
| A | 0 | 132 | 0 |
| B | 0 | 132 | 0 |
| C | 0 | 132 | 0 |
| D | 0 | 132 | 0 |
| Quadrant | Total seconds | Saturated seconds | Saturation percentage |
|---|---|---|---|
| A | 6515 | 94 | 1.442824% |
| B | 6516 | 192 | 2.946593% |
| C | 6516 | 138 | 2.117864% |
| D | 6515 | 132 | 2.026094% |
Noise dominated data is calculated using 1-second bins in cleaned event files. If a bin has >2000 counts, and if more than 50% of those come from <1% of pixels, then it is considered to be noise-dominated and hence unusable.
| Quadrant | # 1 sec bins | Bins with >0 counts | Bins with >2000 counts | High rate bins dominated by noise | Noise dominated (total time) | Noise dominated (detector-on time) | Marked lightcurve |
|---|---|---|---|---|---|---|---|
| A | 7535 | 6516 | 0 | 0 | 0.00% | 0.00% | 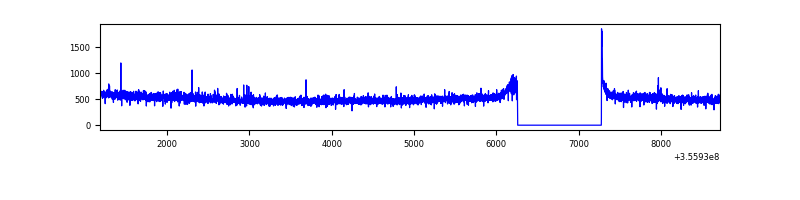 |
| B | 7536 | 6517 | 24 | 24 | 0.32% | 0.37% | 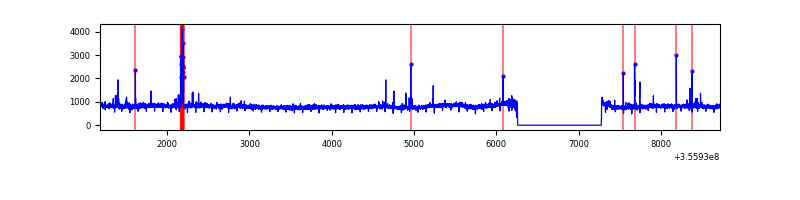 |
| C | 7536 | 6517 | 6 | 6 | 0.08% | 0.09% | 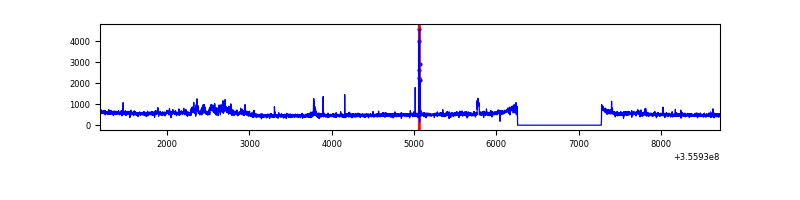 |
| D | 7535 | 6516 | 39 | 39 | 0.52% | 0.60% | 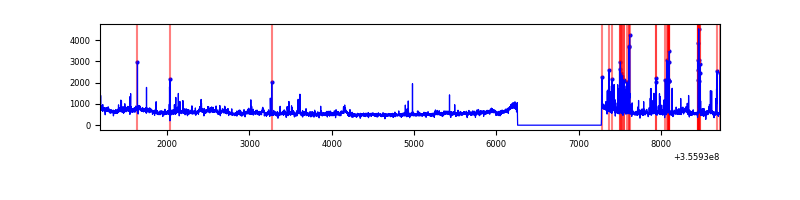 |
Top three noisy pixels from each quadrant. If the there are fewer than three noisy pixels in the level2.evt file, extra rows are filled as -1
| Pixel properties | Quadrant properties | ||||||
|---|---|---|---|---|---|---|---|
| Quadrant | DetID | PixID | Counts | Sigma | Mean | Median | Sigma |
| A | 3 | 1 | 13441 | 74.79 | 852 | 835 | 168.6 |
| A | 13 | 254 | 12915 | 71.66 | 852 | 835 | 168.6 |
| A | 8 | 192 | 12161 | 67.19 | 852 | 835 | 168.6 |
| B | 6 | 159 | 1885242 | 12074.2 | 830 | 812 | 156.1 |
| B | 3 | 64 | 107631 | 684.43 | 830 | 812 | 156.1 |
| B | 3 | 209 | 24443 | 151.41 | 830 | 812 | 156.1 |
| C | 3 | 233 | 235392 | 1264.31 | 802 | 807 | 185.5 |
| C | 14 | 238 | 134114 | 718.46 | 802 | 807 | 185.5 |
| C | 15 | 159 | 22275 | 115.7 | 802 | 807 | 185.5 |
| D | 8 | 195 | 654662 | 3402.0 | 819 | 798 | 192.2 |
| D | 12 | 233 | 246204 | 1276.83 | 819 | 798 | 192.2 |
| D | 5 | 233 | 35110 | 178.52 | 819 | 798 | 192.2 |
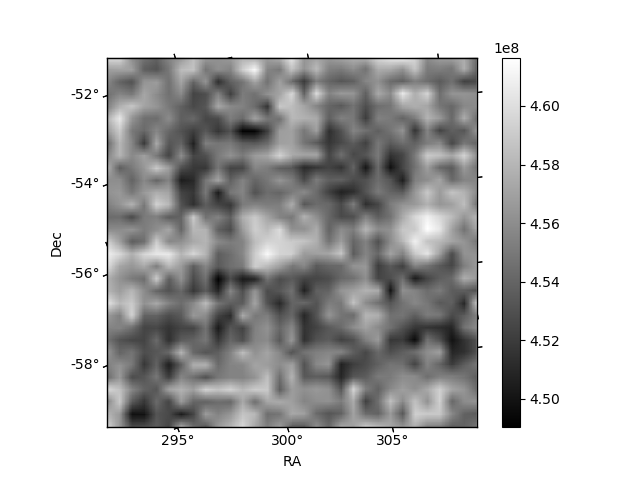
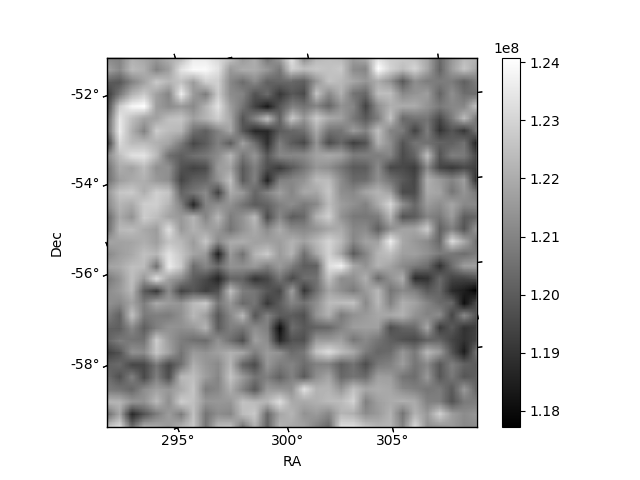
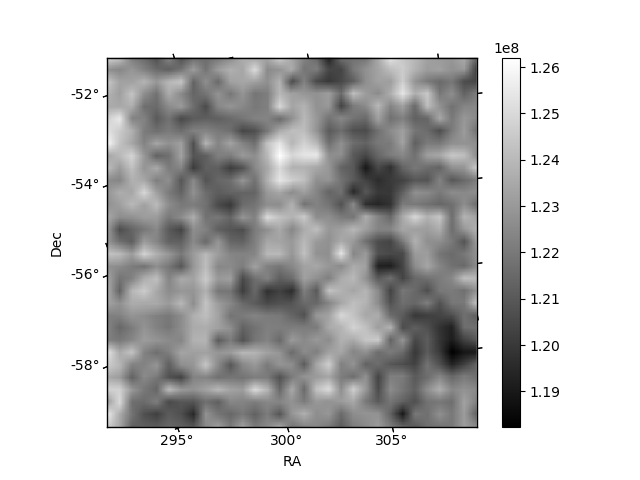
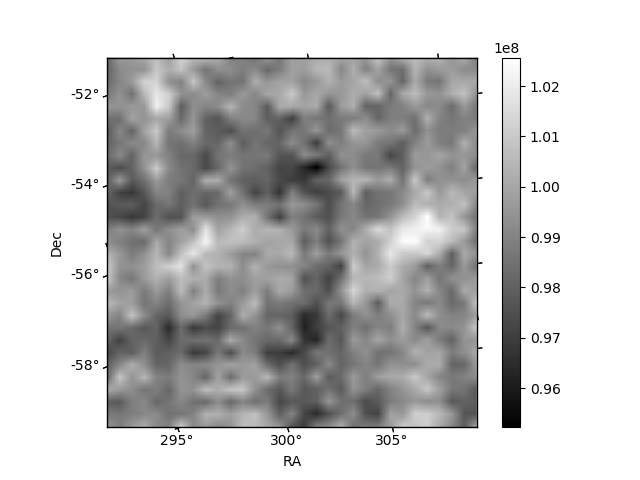
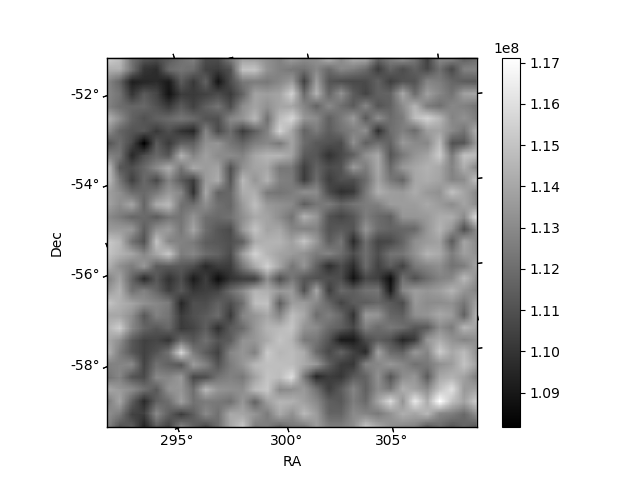
Histogram calculated using DETX and DETY for each event in the final _common_clean file
| Quadrant A | 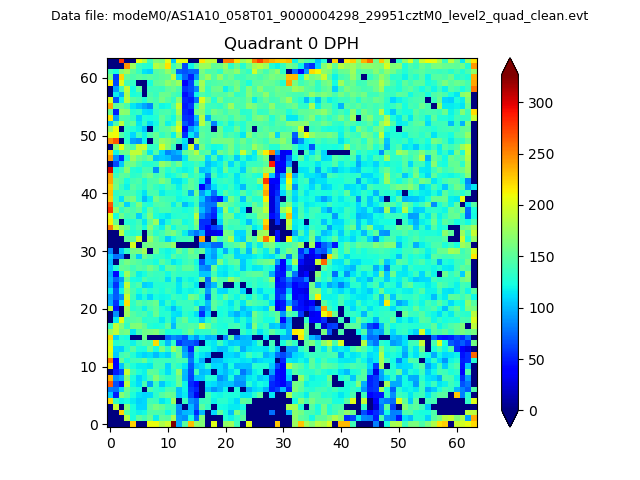 |
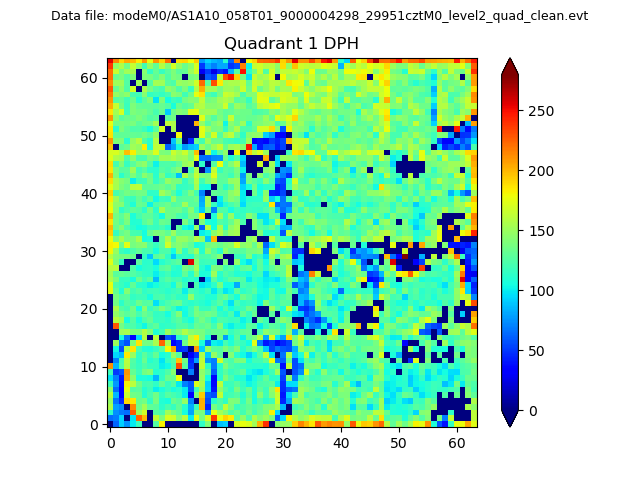 |
Quadrant B |
|---|---|---|---|
| Quadrant D | 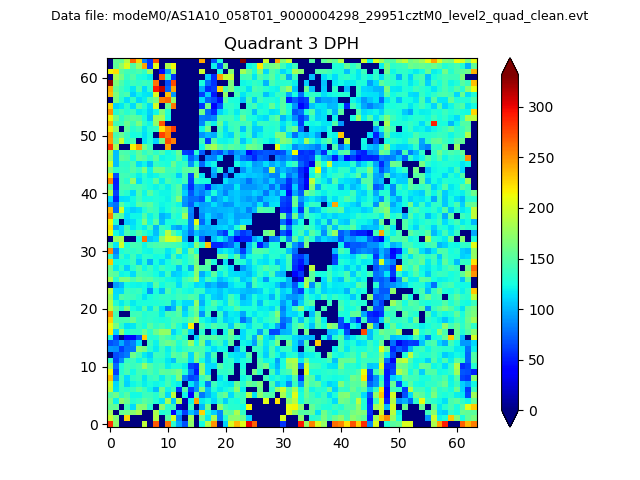 |
 |
Quadrant C |
| Plot type | Count rate plots | Images |
|---|---|---|
| Comparison with Poisson distribution Blue bars denote a histogram of data divided into 1 sec bins. Red curve is a Poisson curve with rate = median count rate of data. |
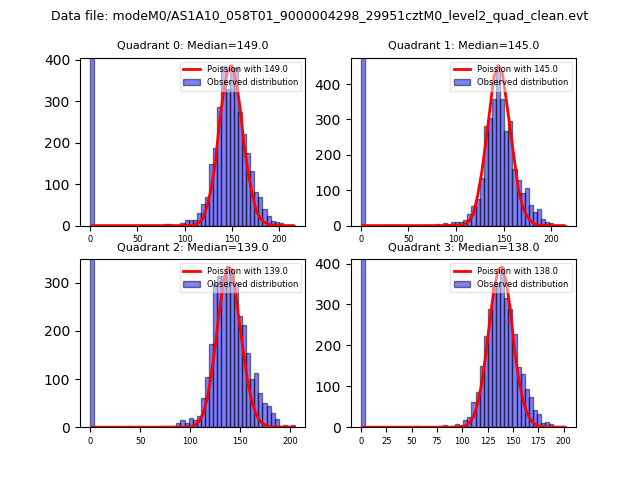 |
 |
| Quadrant-wise count rates Data is divided into 100 sec bins |
 |
|
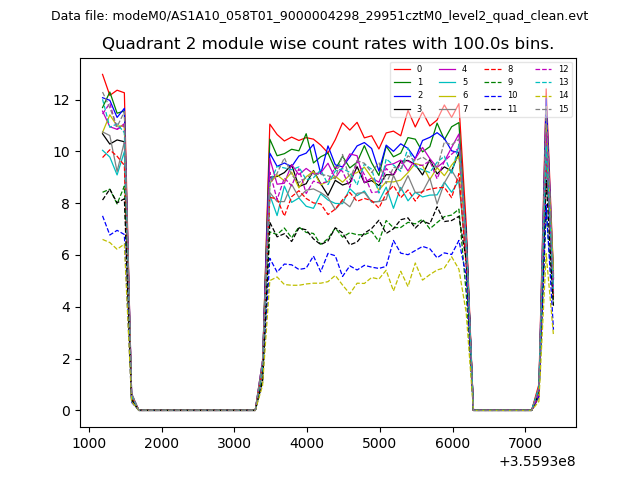
| Module-wise count rates for Quadrant A Data is divided into 100 sec bins |
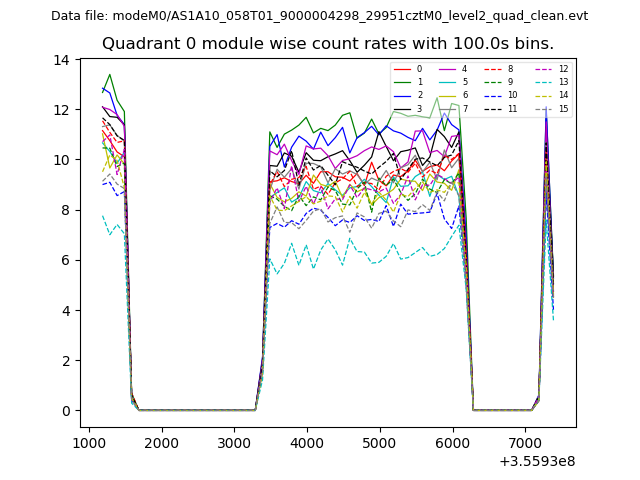 |
 |
| Module-wise count rates for Quadrant B Data is divided into 100 sec bins |
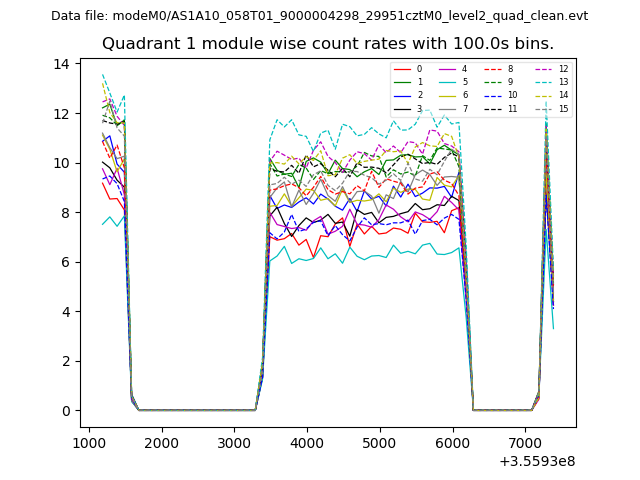 |
 |
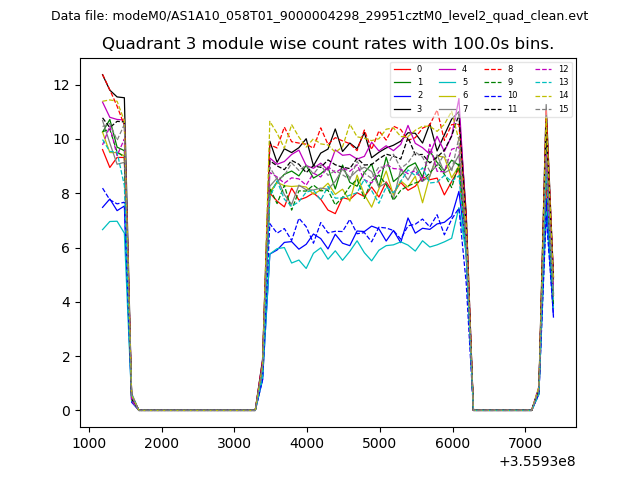
| Module-wise count rates for Quadrant C Data is divided into 100 sec bins |
 |
 |
| Module-wise count rates for Quadrant D Data is divided into 100 sec bins |
 |
 |
| Parameter | Plot |
|---|---|
| CZT HV Monitor | 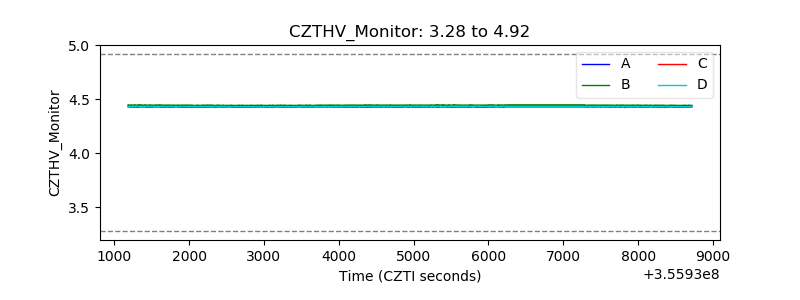 |
| D_VDD | 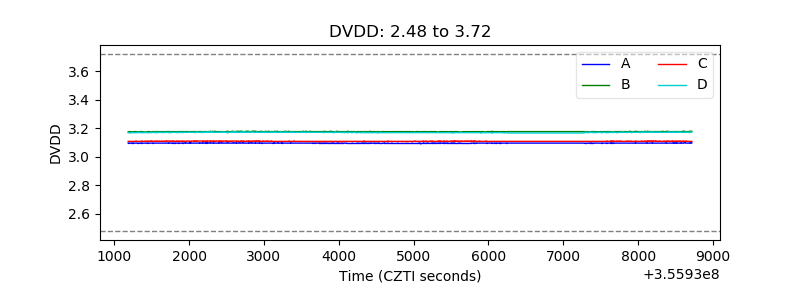 |
| Temperature 1 | 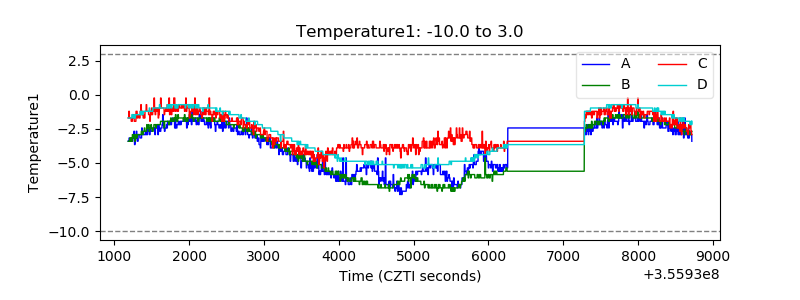 |
| Veto HV Monitor | 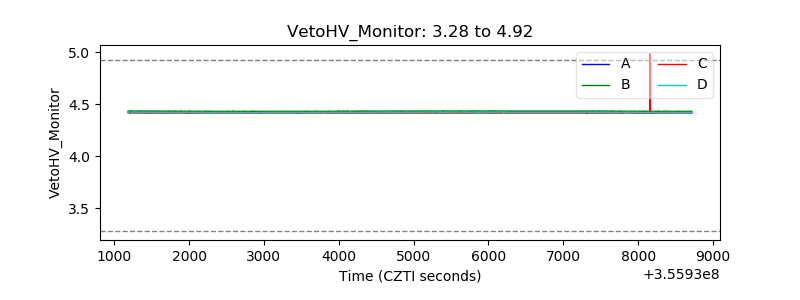 |
| Veto LLD | 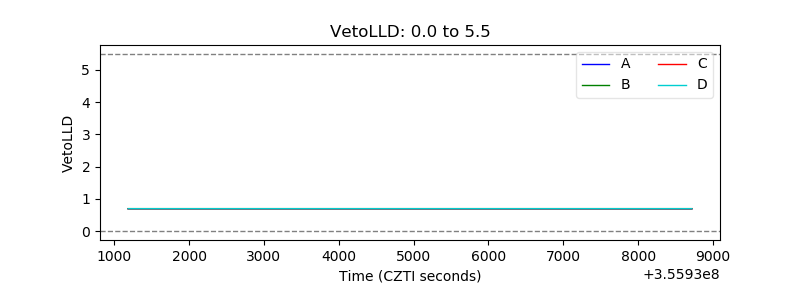 |
| Alpha Counter | 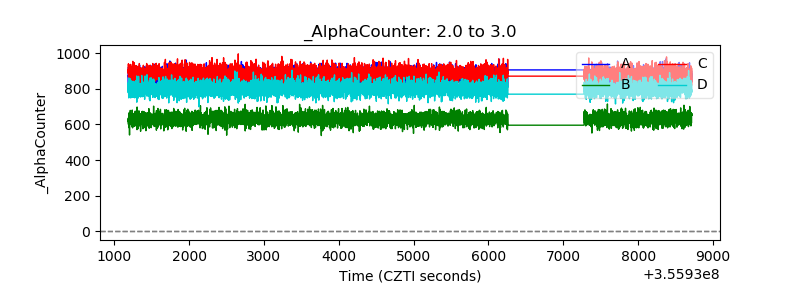 |
| _CPM_Rate | 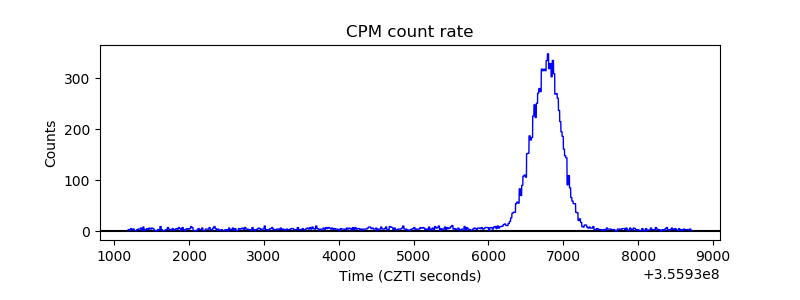 |
| CZT Counter |  |
| +2.5 Volts monitor |  |
| +5 Volts monitor |  |
| _ROLL_ROT | 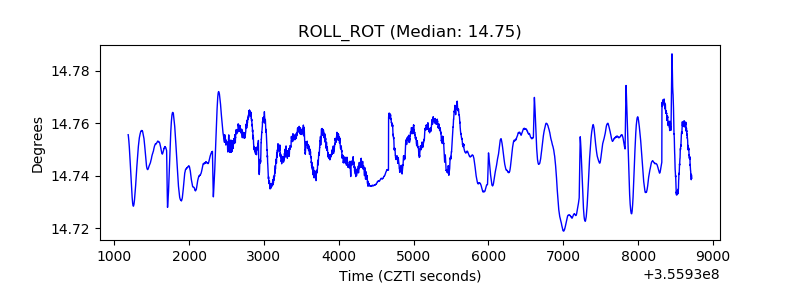 |
| _Roll_DEC | 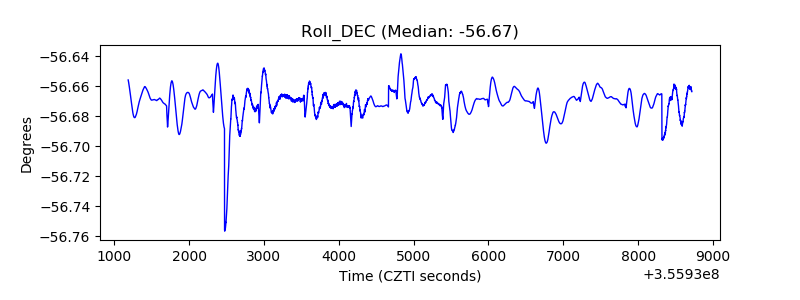 |
| _Roll_RA | 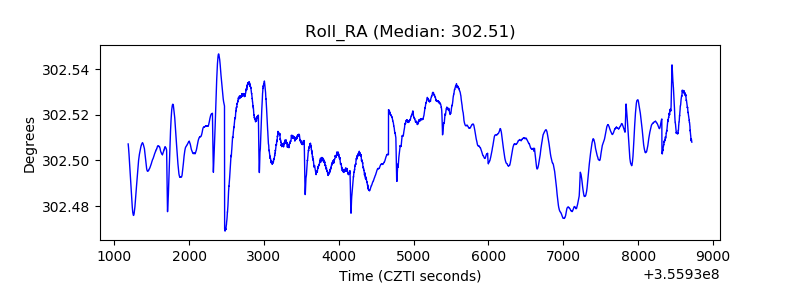 |
| Veto Counter | 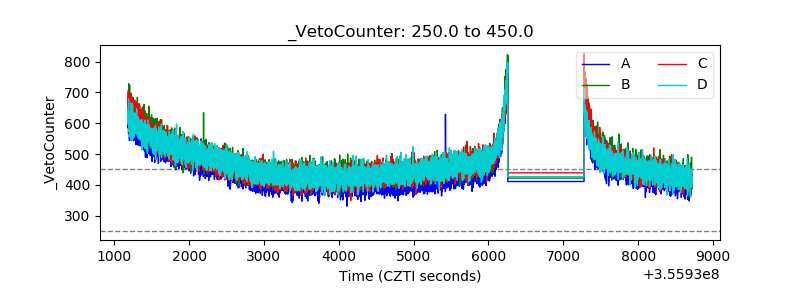 |