| Param | Original file | Final file |
|---|---|---|
| Filename | modeM0/AS1A10_058T01_9000004298_29952cztM0_level2.evt | modeM0/AS1A10_058T01_9000004298_29952cztM0_level2_quad_clean.evt |
| Size (bytes) | 588,741,120 | 78,465,600 |
| Size | 561.5 MB | 74.8 MB |
| Events in quadrant A | 3,366,937 | 492,966 |
| Events in quadrant B | 5,687,647 | 479,510 |
| Events in quadrant C | 3,905,333 | 461,324 |
| Events in quadrant D | 4,403,845 | 461,955 |
| Mode M9 | |||
|---|---|---|---|
| Quadrant | BADHDUFLAG | Total packets | Discarded packets |
| A | 0 | 6 | 0 |
| B | 0 | 6 | 0 |
| C | 0 | 6 | 0 |
| D | 0 | 6 | 0 |
| Mode M0 | |||
|---|---|---|---|
| Quadrant | BADHDUFLAG | Total packets | Discarded packets |
| A | 0 | 14252 | 1 |
| B | 0 | 21648 | 1 |
| C | 0 | 16206 | 1 |
| D | 0 | 17454 | 1 |
| Mode SS | |||
|---|---|---|---|
| Quadrant | BADHDUFLAG | Total packets | Discarded packets |
| A | 0 | 140 | 0 |
| B | 0 | 140 | 0 |
| C | 0 | 140 | 0 |
| D | 0 | 140 | 0 |
| Quadrant | Total seconds | Saturated seconds | Saturation percentage |
|---|---|---|---|
| A | 6891 | 106 | 1.538238% |
| B | 6891 | 243 | 3.526339% |
| C | 6891 | 165 | 2.394428% |
| D | 6891 | 186 | 2.699173% |
Noise dominated data is calculated using 1-second bins in cleaned event files. If a bin has >2000 counts, and if more than 50% of those come from <1% of pixels, then it is considered to be noise-dominated and hence unusable.
| Quadrant | # 1 sec bins | Bins with >0 counts | Bins with >2000 counts | High rate bins dominated by noise | Noise dominated (total time) | Noise dominated (detector-on time) | Marked lightcurve |
|---|---|---|---|---|---|---|---|
| A | 7521 | 6892 | 0 | 0 | 0.00% | 0.00% | 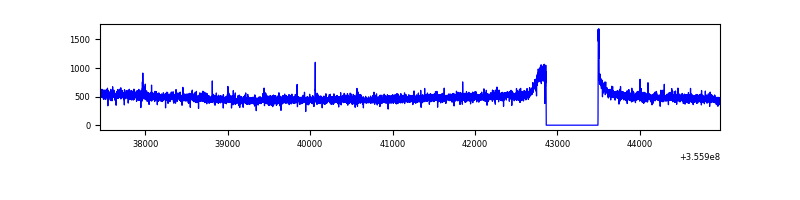 |
| B | 7521 | 6892 | 62 | 62 | 0.82% | 0.90% | 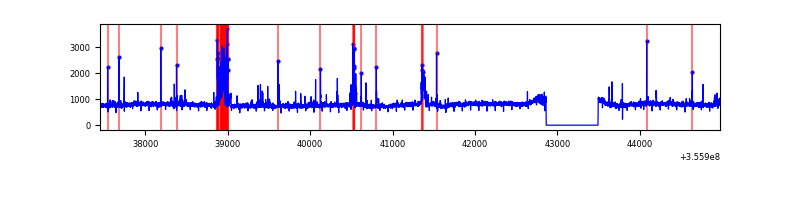 |
| C | 7521 | 6892 | 0 | 0 | 0.00% | 0.00% | 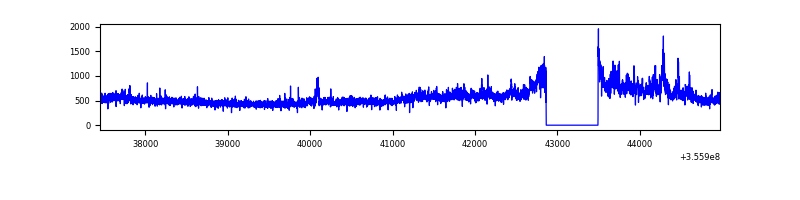 |
| D | 7521 | 6892 | 100 | 100 | 1.33% | 1.45% | 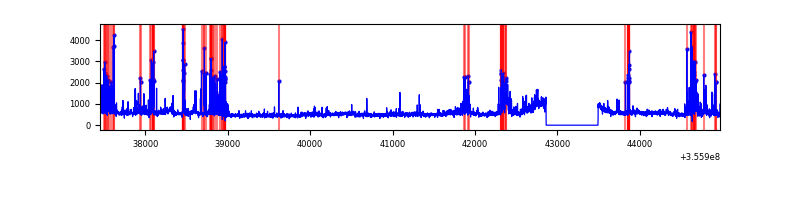 |
Top three noisy pixels from each quadrant. If the there are fewer than three noisy pixels in the level2.evt file, extra rows are filled as -1
| Pixel properties | Quadrant properties | ||||||
|---|---|---|---|---|---|---|---|
| Quadrant | DetID | PixID | Counts | Sigma | Mean | Median | Sigma |
| A | 13 | 254 | 13207 | 71.66 | 868 | 850 | 172.4 |
| A | 8 | 192 | 12687 | 68.64 | 868 | 850 | 172.4 |
| A | 3 | 137 | 8503 | 44.38 | 868 | 850 | 172.4 |
| B | 6 | 159 | 2034644 | 12510.54 | 846 | 824 | 162.6 |
| B | 3 | 64 | 306879 | 1882.62 | 846 | 824 | 162.6 |
| B | 12 | 111 | 19723 | 116.25 | 846 | 824 | 162.6 |
| C | 3 | 233 | 561674 | 2937.13 | 819 | 824 | 191.0 |
| C | 14 | 238 | 135528 | 705.44 | 819 | 824 | 191.0 |
| C | 2 | 114 | 16538 | 82.29 | 819 | 824 | 191.0 |
| D | 12 | 233 | 426725 | 2164.27 | 833 | 813 | 196.8 |
| D | 8 | 195 | 395371 | 2004.94 | 833 | 813 | 196.8 |
| D | 6 | 112 | 220174 | 1114.68 | 833 | 813 | 196.8 |
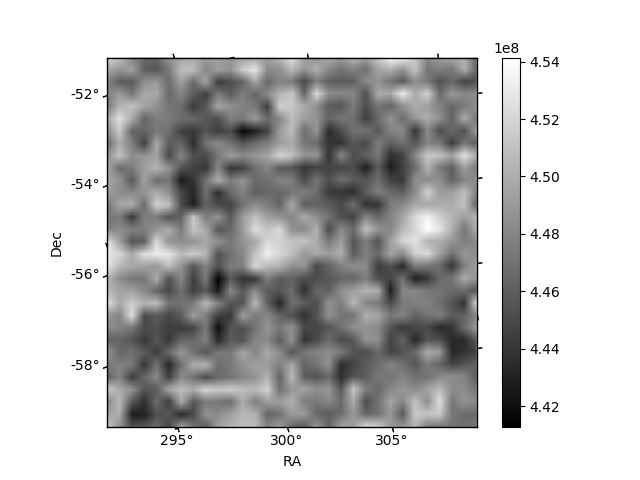
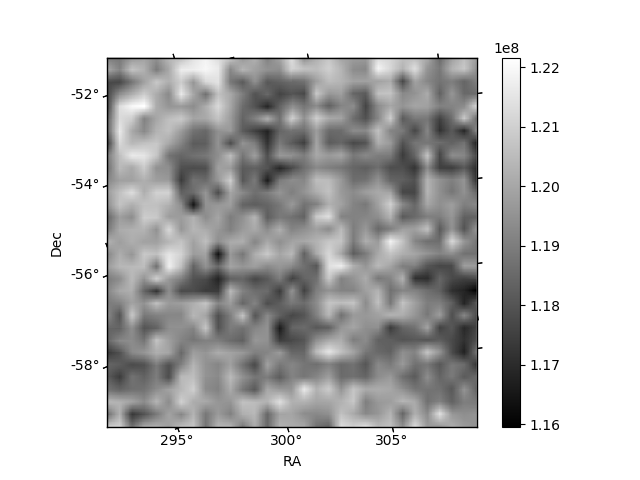
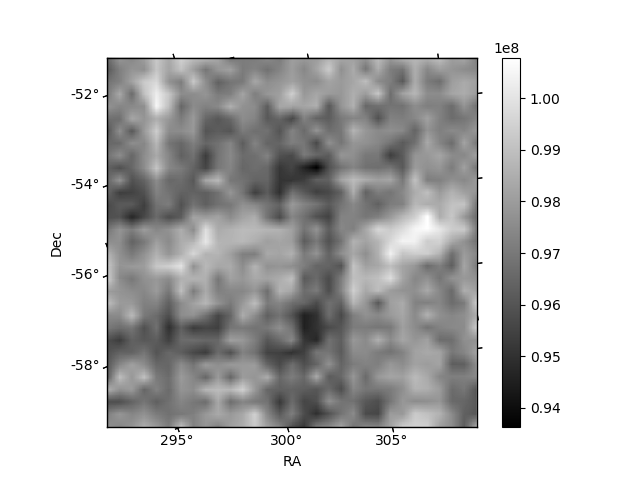
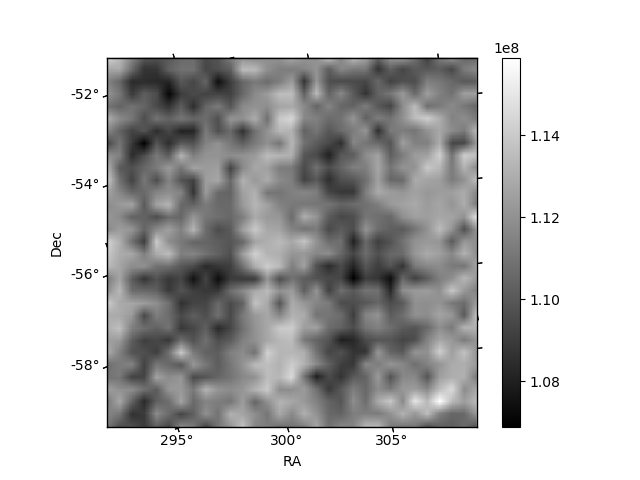
Histogram calculated using DETX and DETY for each event in the final _common_clean file
| Quadrant A | 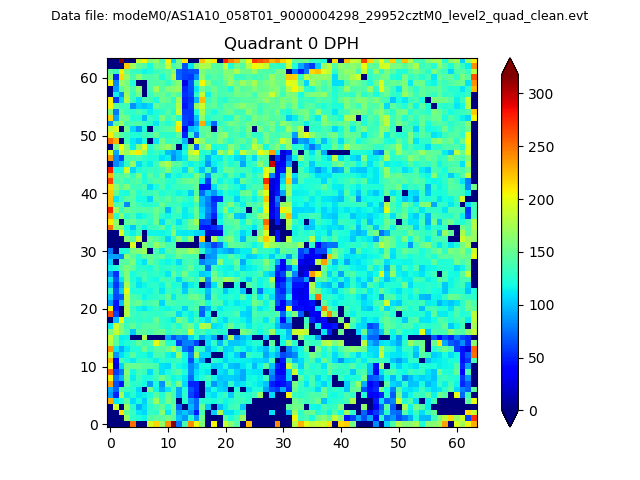 |
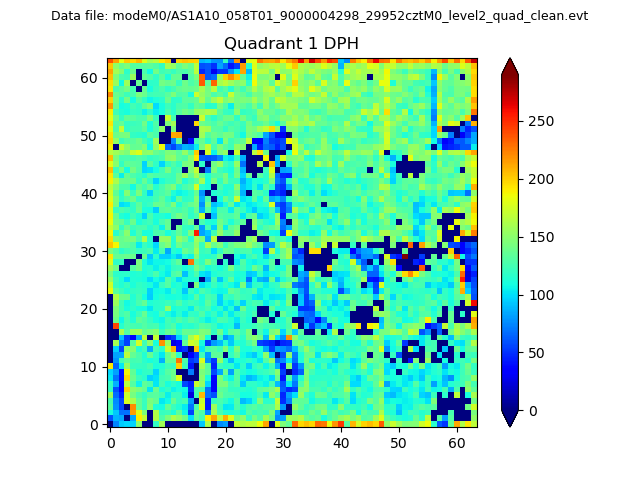 |
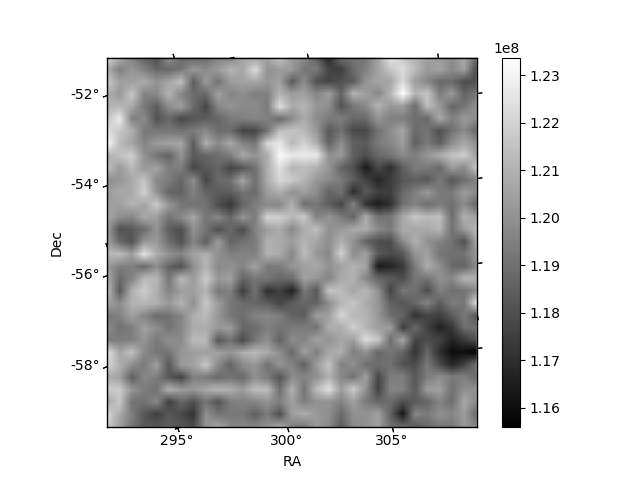
Quadrant B |
|---|---|---|---|
| Quadrant D | 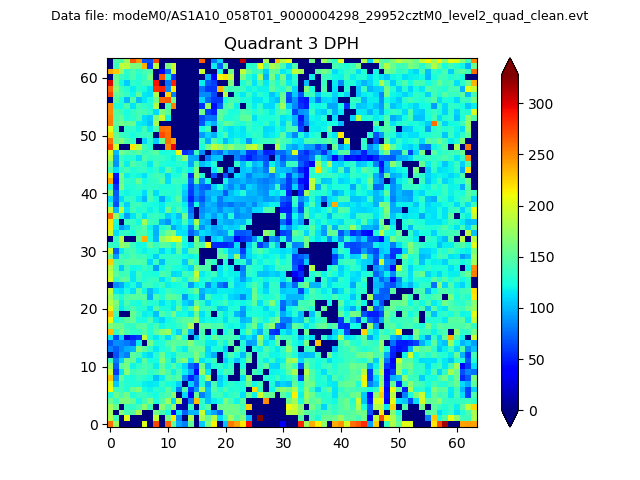 |
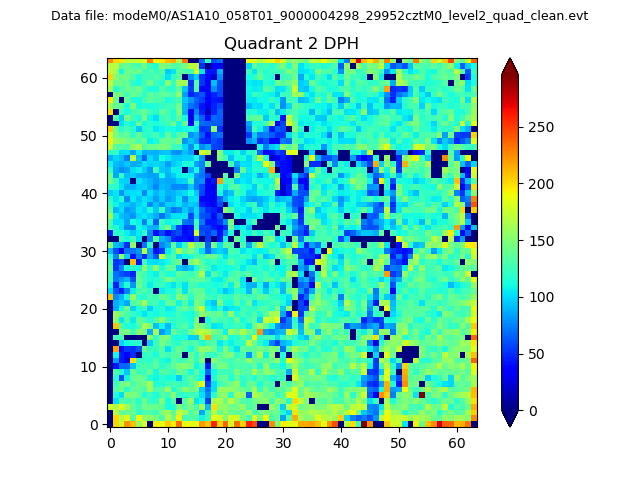 |
Quadrant C |
| Plot type | Count rate plots | Images |
|---|---|---|
| Comparison with Poisson distribution Blue bars denote a histogram of data divided into 1 sec bins. Red curve is a Poisson curve with rate = median count rate of data. |
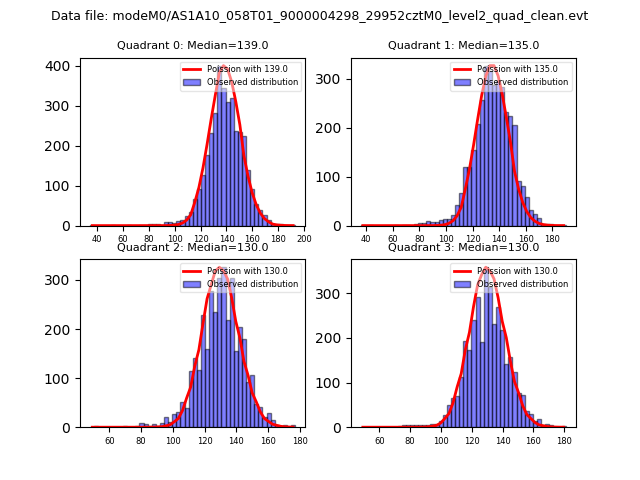 |
 |
| Quadrant-wise count rates Data is divided into 100 sec bins |
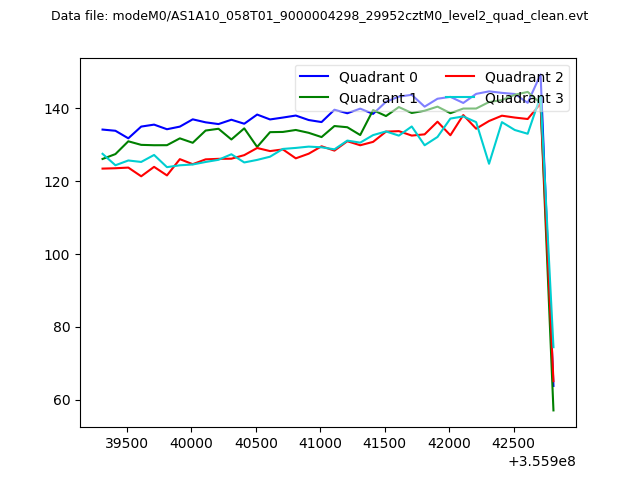 |
|
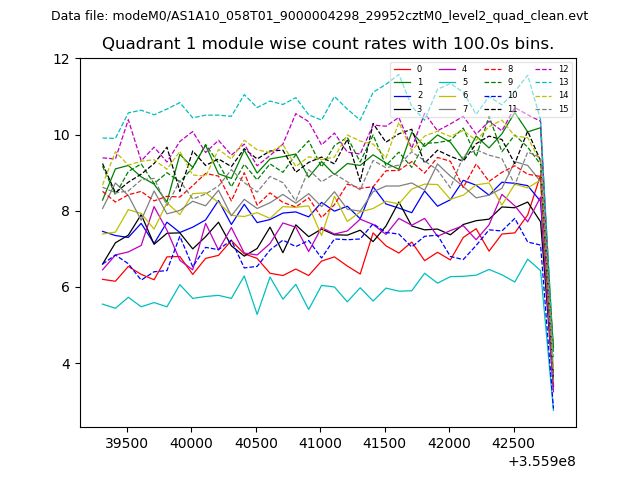
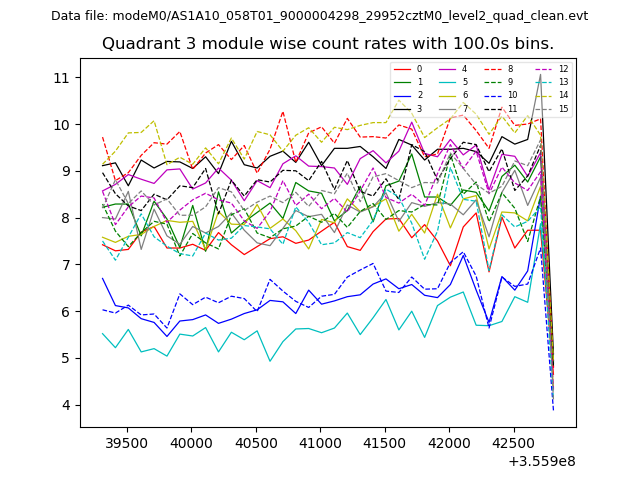
| Module-wise count rates for Quadrant A Data is divided into 100 sec bins |
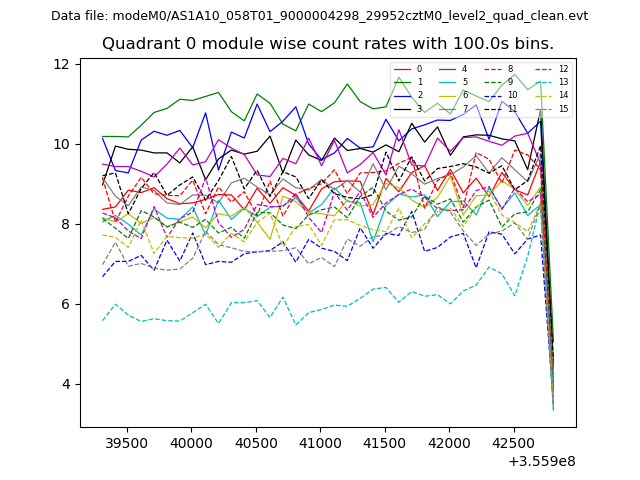 |
 |
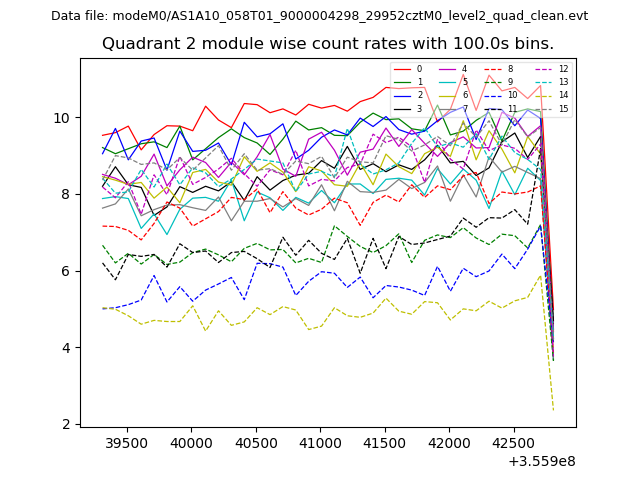
| Module-wise count rates for Quadrant B Data is divided into 100 sec bins |
 |
 |
| Module-wise count rates for Quadrant C Data is divided into 100 sec bins |
 |
 |
| Module-wise count rates for Quadrant D Data is divided into 100 sec bins |
 |
 |
| Parameter | Plot |
|---|---|
| CZT HV Monitor | 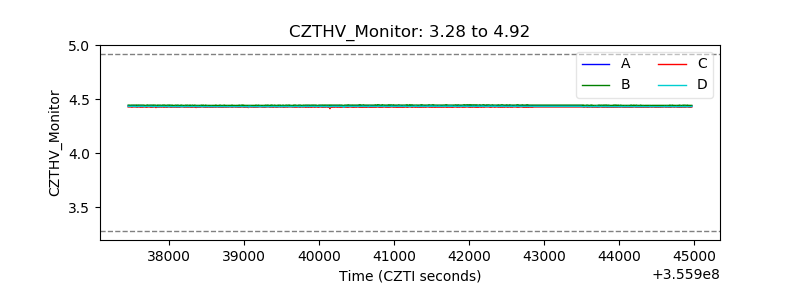 |
| D_VDD | 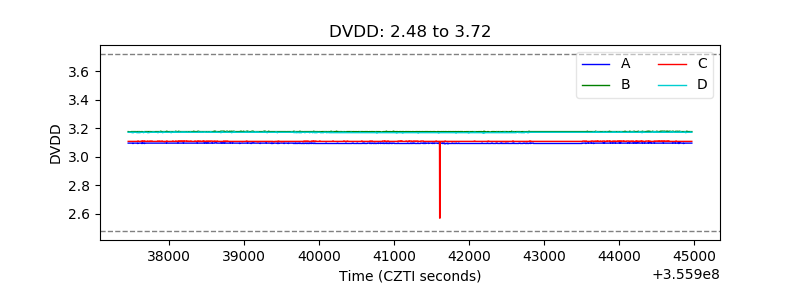 |
| Temperature 1 | 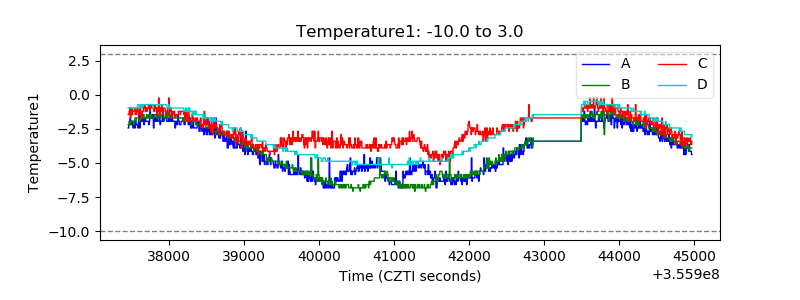 |
| Veto HV Monitor | 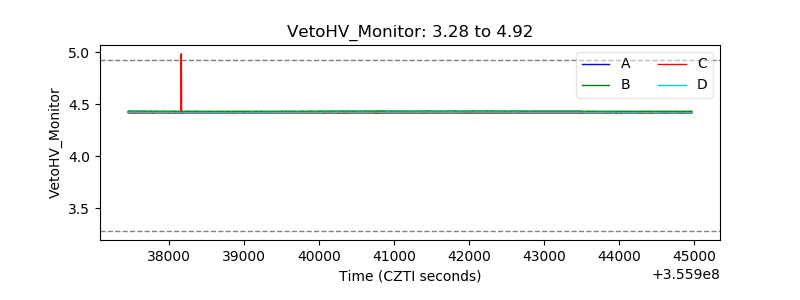 |
| Veto LLD | 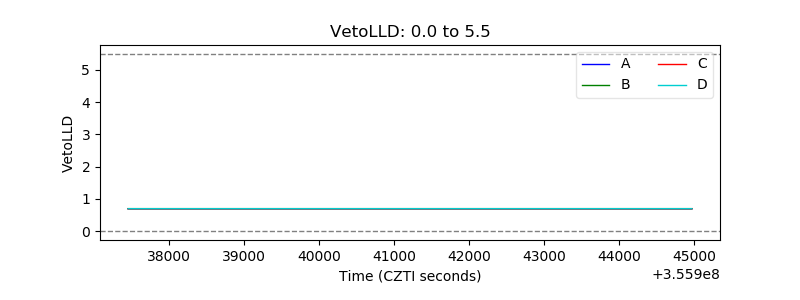 |
| Alpha Counter | 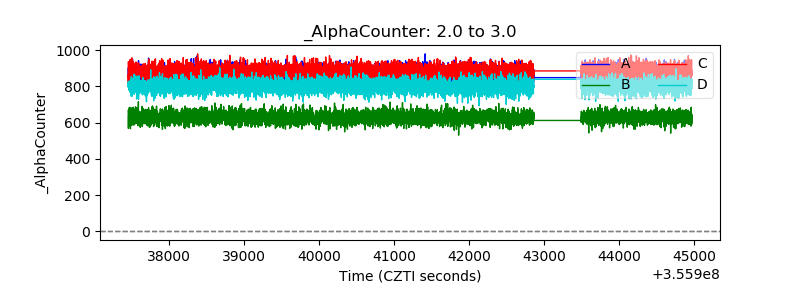 |
| _CPM_Rate | 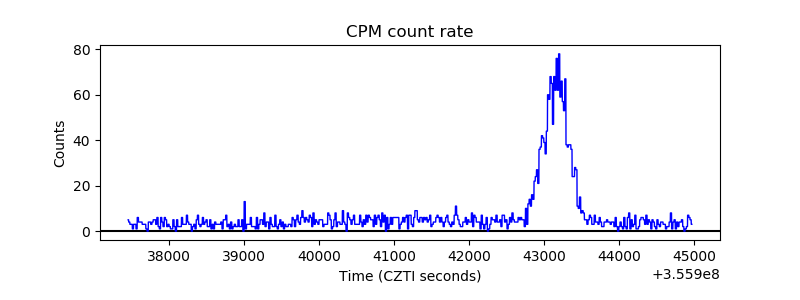 |
| CZT Counter | 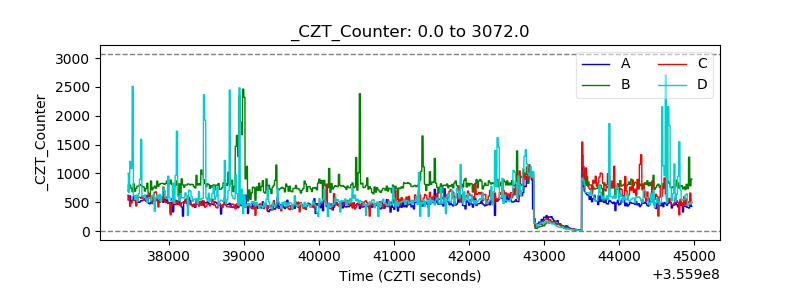 |
| +2.5 Volts monitor |  |
| +5 Volts monitor | 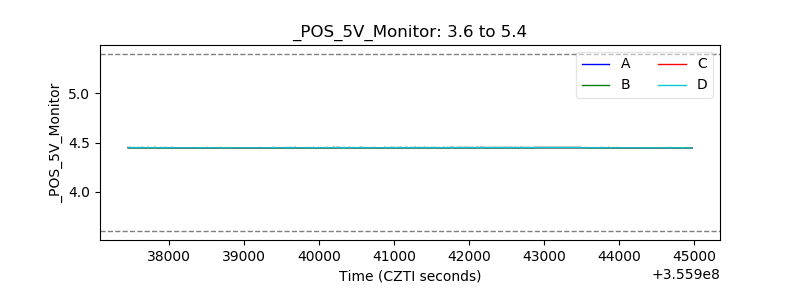 |
| _ROLL_ROT | 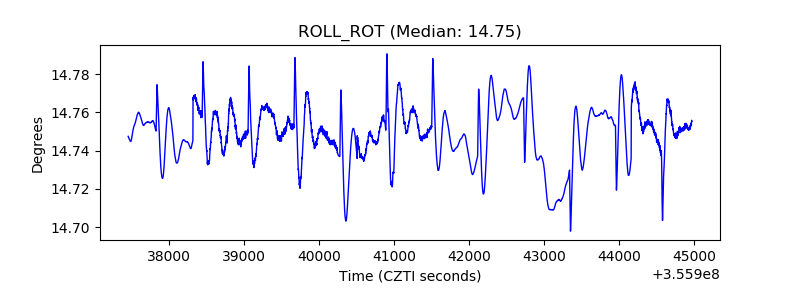 |
| _Roll_DEC | 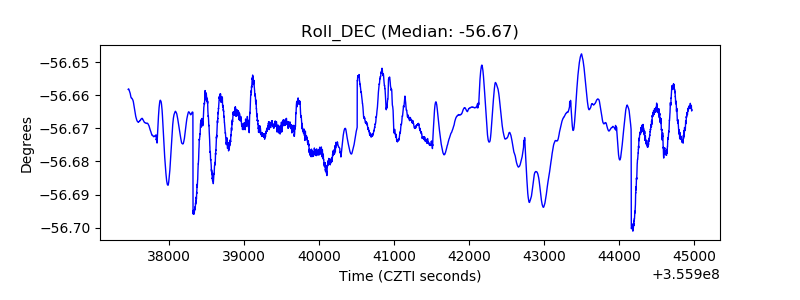 |
| _Roll_RA | 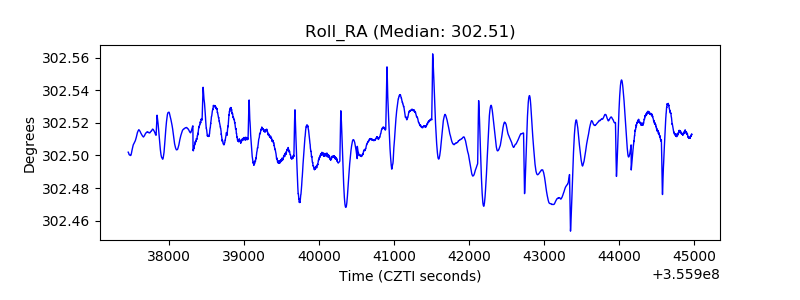 |
| Veto Counter | 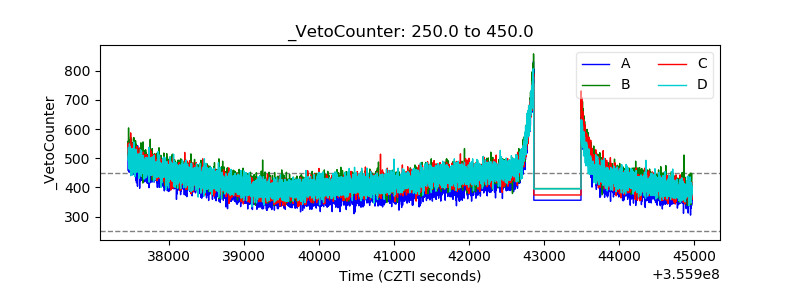 |