| Param | Original file | Final file |
|---|---|---|
| Filename | modeM0/AS1A10_058T01_9000004298_29957cztM0_level2.evt | modeM0/AS1A10_058T01_9000004298_29957cztM0_level2_quad_clean.evt |
| Size (bytes) | 630,273,600 | 89,285,760 |
| Size | 601.1 MB | 85.1 MB |
| Events in quadrant A | 3,181,794 | 580,834 |
| Events in quadrant B | 5,220,297 | 570,363 |
| Events in quadrant C | 6,252,996 | 536,626 |
| Events in quadrant D | 3,976,886 | 545,949 |
| Mode M9 | |||
|---|---|---|---|
| Quadrant | BADHDUFLAG | Total packets | Discarded packets |
| A | 0 | 4 | 0 |
| B | 0 | 4 | 0 |
| C | 0 | 4 | 0 |
| D | 0 | 4 | 0 |
| Mode M0 | |||
|---|---|---|---|
| Quadrant | BADHDUFLAG | Total packets | Discarded packets |
| A | 0 | 13776 | 2 |
| B | 0 | 20464 | 2 |
| C | 0 | 23433 | 2 |
| D | 0 | 16116 | 2 |
| Mode SS | |||
|---|---|---|---|
| Quadrant | BADHDUFLAG | Total packets | Discarded packets |
| A | 0 | 138 | 0 |
| B | 0 | 138 | 0 |
| C | 0 | 138 | 0 |
| D | 0 | 138 | 0 |
| Quadrant | Total seconds | Saturated seconds | Saturation percentage |
|---|---|---|---|
| A | 6740 | 36 | 0.534125% |
| B | 6740 | 117 | 1.735905% |
| C | 6740 | 589 | 8.738872% |
| D | 6741 | 134 | 1.987836% |
Noise dominated data is calculated using 1-second bins in cleaned event files. If a bin has >2000 counts, and if more than 50% of those come from <1% of pixels, then it is considered to be noise-dominated and hence unusable.
| Quadrant | # 1 sec bins | Bins with >0 counts | Bins with >2000 counts | High rate bins dominated by noise | Noise dominated (total time) | Noise dominated (detector-on time) | Marked lightcurve |
|---|---|---|---|---|---|---|---|
| A | 7165 | 6741 | 0 | 0 | 0.00% | 0.00% | 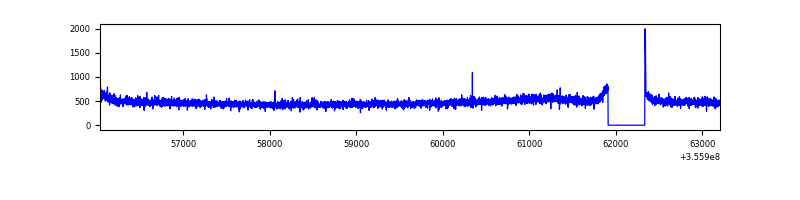 |
| B | 7165 | 6741 | 11 | 11 | 0.15% | 0.16% | 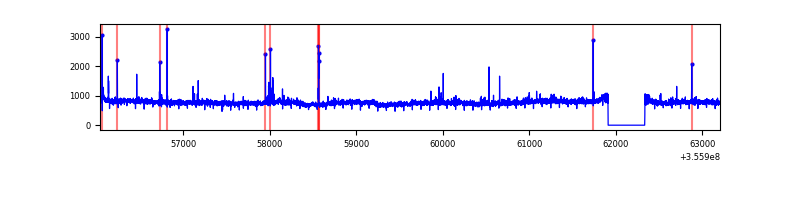 |
| C | 7165 | 6741 | 137 | 137 | 1.91% | 2.03% | 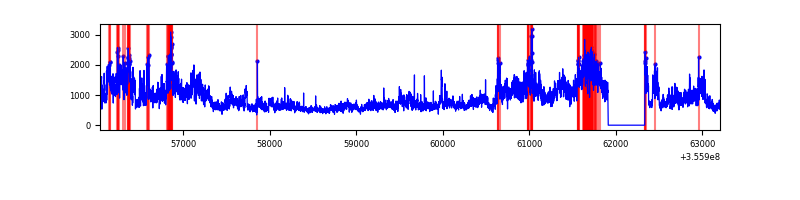 |
| D | 7166 | 6742 | 68 | 68 | 0.95% | 1.01% | 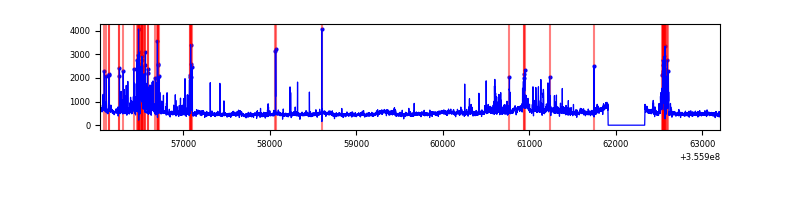 |
Top three noisy pixels from each quadrant. If the there are fewer than three noisy pixels in the level2.evt file, extra rows are filled as -1
| Pixel properties | Quadrant properties | ||||||
|---|---|---|---|---|---|---|---|
| Quadrant | DetID | PixID | Counts | Sigma | Mean | Median | Sigma |
| A | 13 | 254 | 13814 | 78.62 | 819 | 801 | 165.5 |
| A | 8 | 192 | 13243 | 75.17 | 819 | 801 | 165.5 |
| A | 3 | 137 | 8161 | 44.46 | 819 | 801 | 165.5 |
| B | 6 | 159 | 1961368 | 12662.76 | 806 | 785 | 154.8 |
| B | 3 | 64 | 53662 | 341.52 | 806 | 785 | 154.8 |
| B | 12 | 111 | 18828 | 116.53 | 806 | 785 | 154.8 |
| C | 3 | 233 | 3126353 | 17551.31 | 762 | 764 | 178.1 |
| C | 14 | 238 | 126632 | 706.79 | 762 | 764 | 178.1 |
| C | 2 | 114 | 15510 | 82.8 | 762 | 764 | 178.1 |
| D | 8 | 195 | 401697 | 2160.99 | 785 | 763 | 185.5 |
| D | 2 | 250 | 194125 | 1042.2 | 785 | 763 | 185.5 |
| D | 13 | 104 | 189925 | 1019.56 | 785 | 763 | 185.5 |
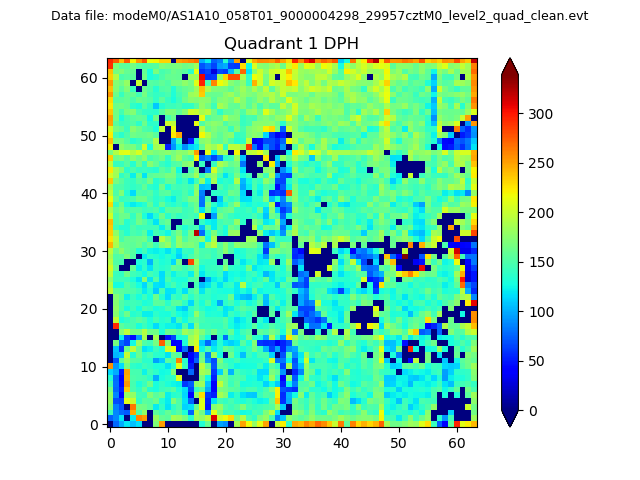
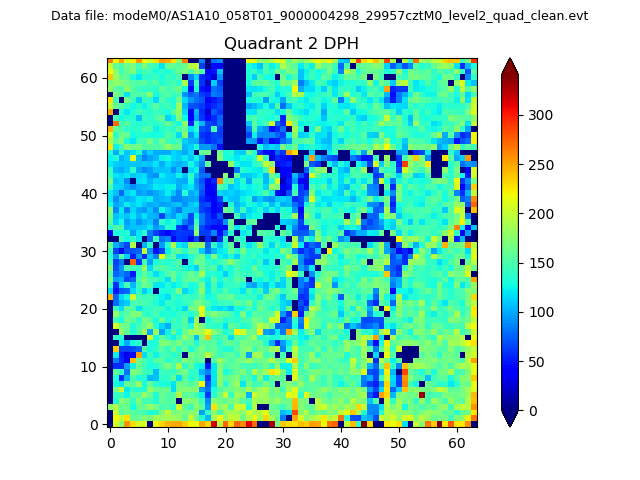
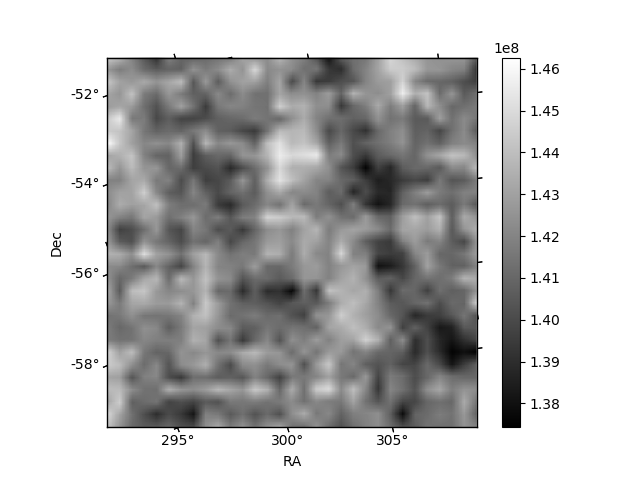
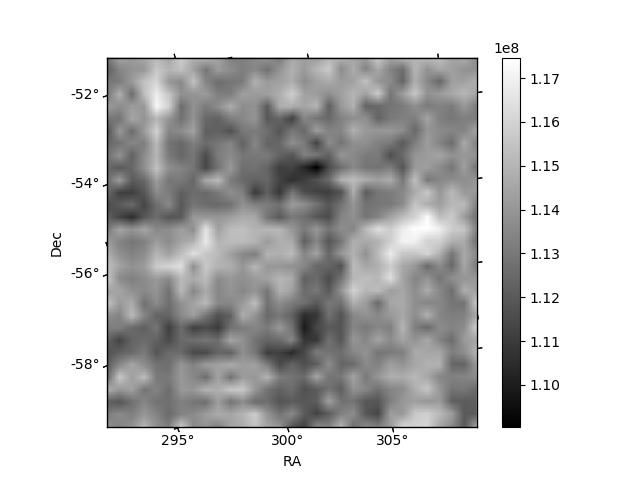
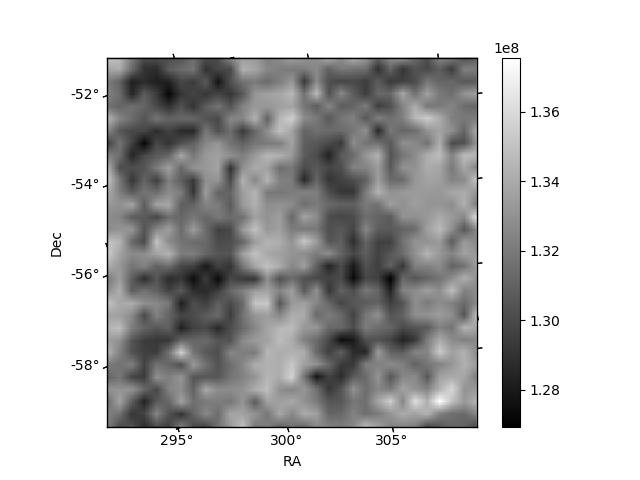
Histogram calculated using DETX and DETY for each event in the final _common_clean file
| Quadrant A |  |
 |
Quadrant B |
|---|---|---|---|
| Quadrant D |  |
 |
Quadrant C |
| Plot type | Count rate plots | Images |
|---|---|---|
| Comparison with Poisson distribution Blue bars denote a histogram of data divided into 1 sec bins. Red curve is a Poisson curve with rate = median count rate of data. |
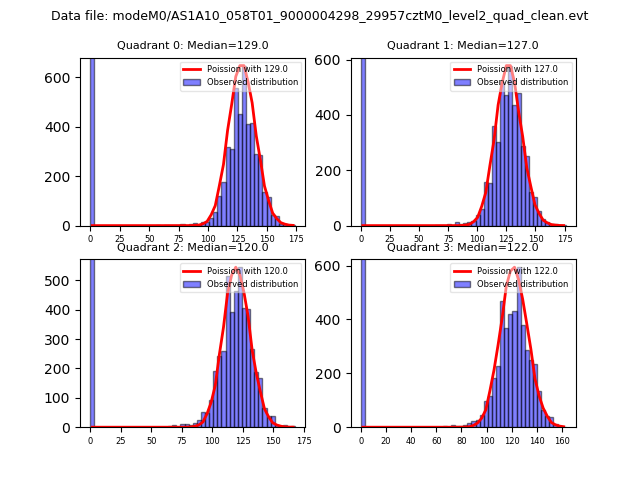 |
 |
| Quadrant-wise count rates Data is divided into 100 sec bins |
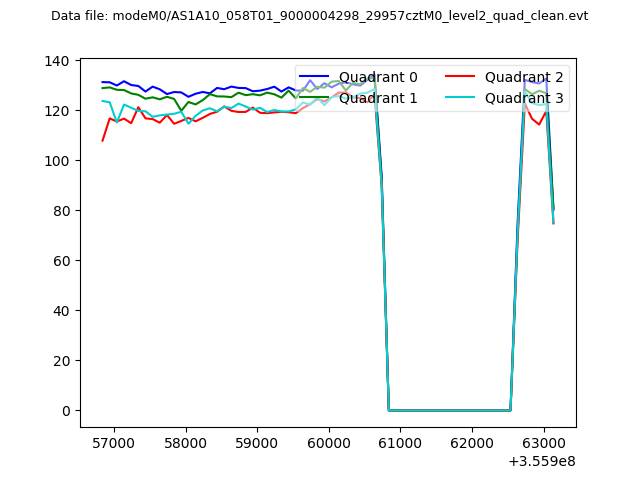 |
|
| Module-wise count rates for Quadrant A Data is divided into 100 sec bins |
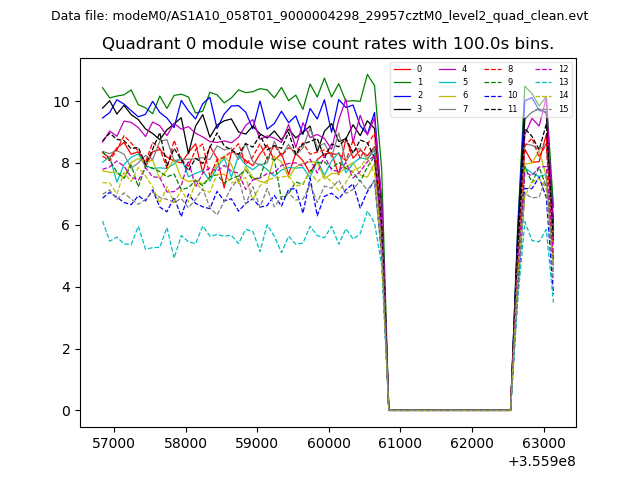 |
 |
| Module-wise count rates for Quadrant B Data is divided into 100 sec bins |
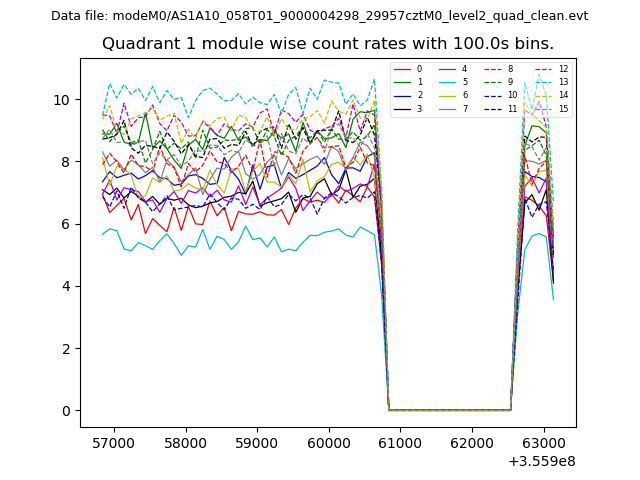 |
 |
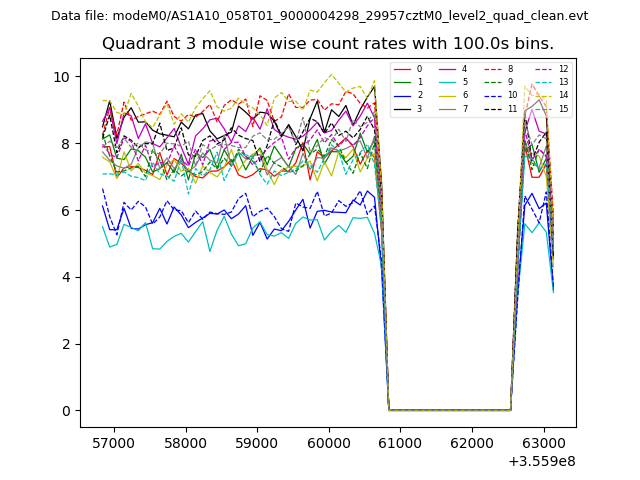
| Module-wise count rates for Quadrant C Data is divided into 100 sec bins |
 |
 |
| Module-wise count rates for Quadrant D Data is divided into 100 sec bins |
 |
 |
| Parameter | Plot |
|---|---|
| CZT HV Monitor |  |
| D_VDD | 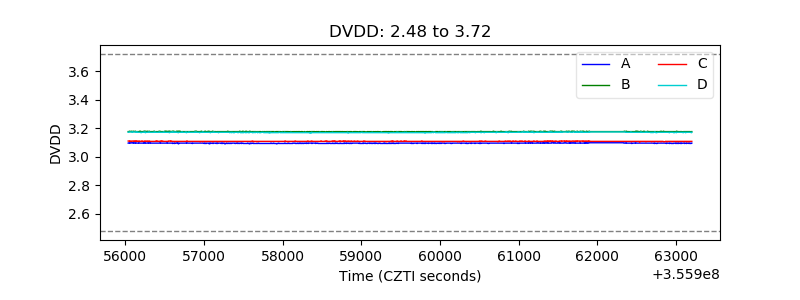 |
| Temperature 1 | 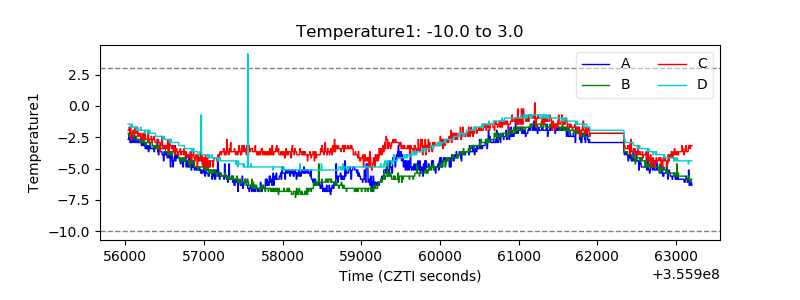 |
| Veto HV Monitor | 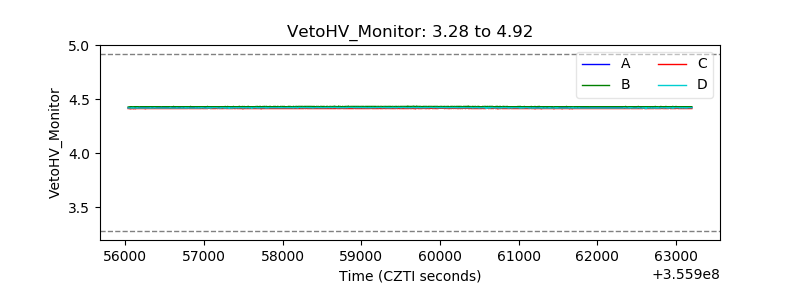 |
| Veto LLD | 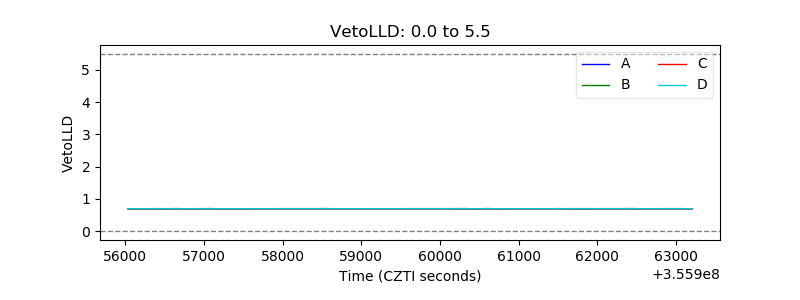 |
| Alpha Counter | 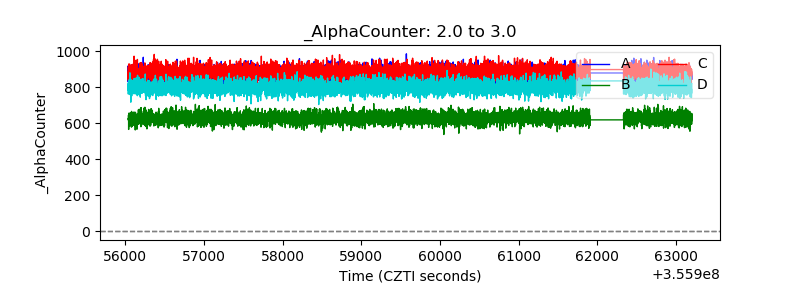 |
| _CPM_Rate | 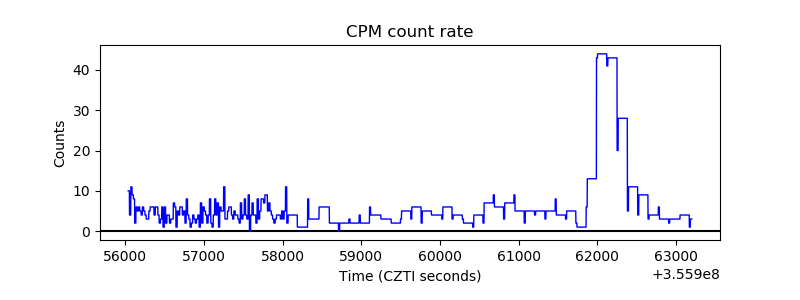 |
| CZT Counter | 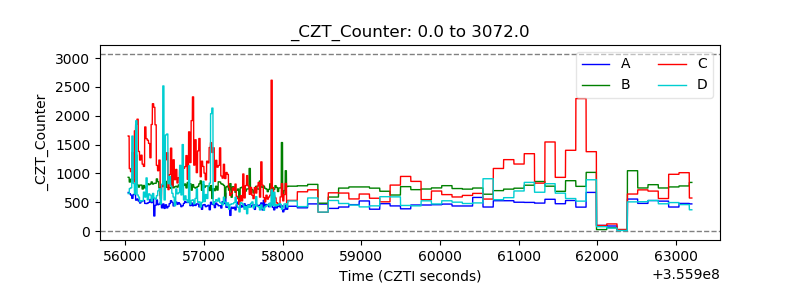 |
| +2.5 Volts monitor |  |
| +5 Volts monitor |  |
| _ROLL_ROT | 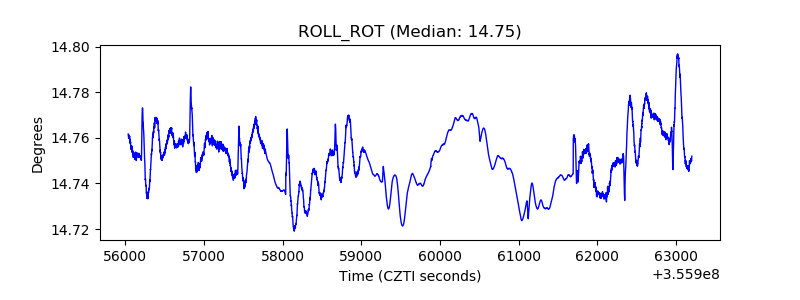 |
| _Roll_DEC | 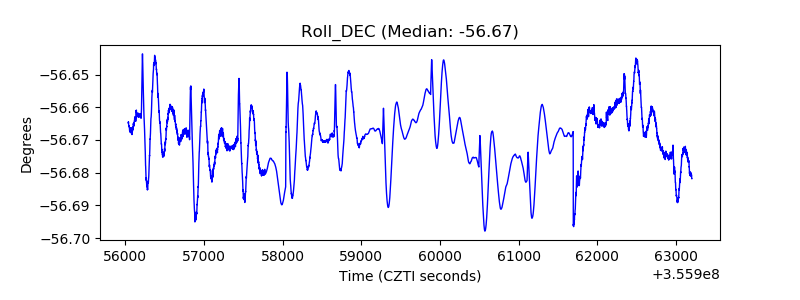 |
| _Roll_RA | 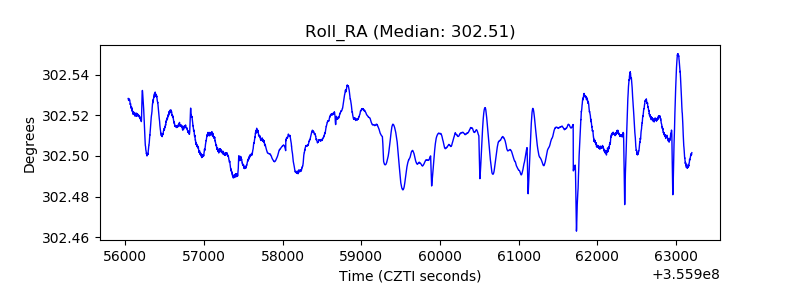 |
| Veto Counter | 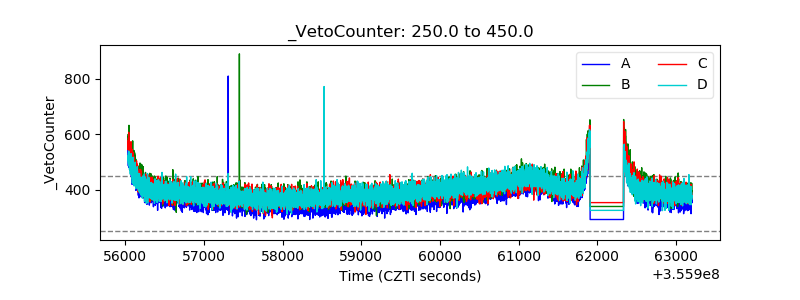 |