| Param | Original file | Final file |
|---|---|---|
| Filename | modeM0/AS1A10_058T01_9000004298_29958cztM0_level2.evt | modeM0/AS1A10_058T01_9000004298_29958cztM0_level2_quad_clean.evt |
| Size (bytes) | 1,023,721,920 | 178,542,720 |
| Size | 976.3 MB | 170.3 MB |
| Events in quadrant A | 5,885,984 | 1,167,932 |
| Events in quadrant B | 9,572,218 | 1,160,238 |
| Events in quadrant C | 8,053,468 | 1,104,779 |
| Events in quadrant D | 6,645,323 | 1,107,828 |
| Mode M9 | |||
|---|---|---|---|
| Quadrant | BADHDUFLAG | Total packets | Discarded packets |
| A | 0 | 18 | 0 |
| B | 0 | 18 | 0 |
| C | 0 | 18 | 0 |
| D | 0 | 18 | 0 |
| Mode M0 | |||
|---|---|---|---|
| Quadrant | BADHDUFLAG | Total packets | Discarded packets |
| A | 0 | 25546 | 2 |
| B | 0 | 37798 | 2 |
| C | 0 | 32277 | 2 |
| D | 0 | 27755 | 2 |
| Mode SS | |||
|---|---|---|---|
| Quadrant | BADHDUFLAG | Total packets | Discarded packets |
| A | 0 | 256 | 0 |
| B | 0 | 256 | 0 |
| C | 0 | 256 | 0 |
| D | 0 | 256 | 0 |
| Quadrant | Total seconds | Saturated seconds | Saturation percentage |
|---|---|---|---|
| A | 12545 | 61 | 0.486250% |
| B | 12546 | 150 | 1.195600% |
| C | 12546 | 323 | 2.574526% |
| D | 12545 | 83 | 0.661618% |
Noise dominated data is calculated using 1-second bins in cleaned event files. If a bin has >2000 counts, and if more than 50% of those come from <1% of pixels, then it is considered to be noise-dominated and hence unusable.
| Quadrant | # 1 sec bins | Bins with >0 counts | Bins with >2000 counts | High rate bins dominated by noise | Noise dominated (total time) | Noise dominated (detector-on time) | Marked lightcurve |
|---|---|---|---|---|---|---|---|
| A | 14345 | 12548 | 1 | 1 | 0.01% | 0.01% | 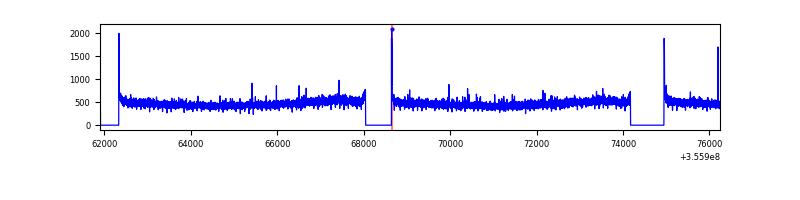 |
| B | 14346 | 12549 | 3 | 3 | 0.02% | 0.02% | 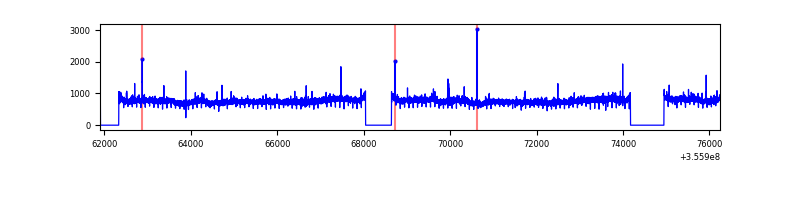 |
| C | 14346 | 12549 | 45 | 45 | 0.31% | 0.36% | 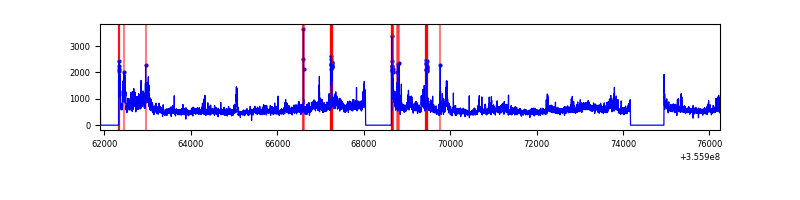 |
| D | 14345 | 12548 | 37 | 37 | 0.26% | 0.29% | 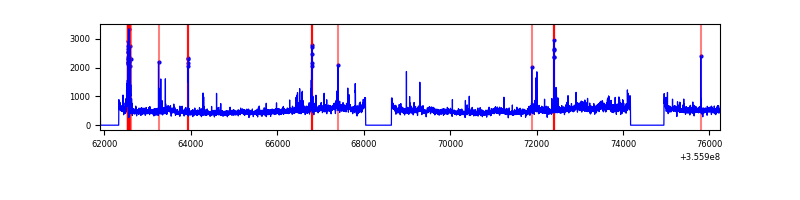 |
Top three noisy pixels from each quadrant. If the there are fewer than three noisy pixels in the level2.evt file, extra rows are filled as -1
| Pixel properties | Quadrant properties | ||||||
|---|---|---|---|---|---|---|---|
| Quadrant | DetID | PixID | Counts | Sigma | Mean | Median | Sigma |
| A | 8 | 192 | 40604 | 130.33 | 1510 | 1480 | 300.2 |
| A | 13 | 254 | 24070 | 75.25 | 1510 | 1480 | 300.2 |
| A | 12 | 96 | 16146 | 48.85 | 1510 | 1480 | 300.2 |
| B | 6 | 159 | 3629657 | 12815.11 | 1494 | 1458 | 283.1 |
| B | 12 | 111 | 35600 | 120.59 | 1494 | 1458 | 283.1 |
| B | 11 | 111 | 32808 | 110.73 | 1494 | 1458 | 283.1 |
| C | 3 | 233 | 2132557 | 6263.27 | 1441 | 1448 | 340.3 |
| C | 14 | 238 | 234795 | 685.8 | 1441 | 1448 | 340.3 |
| C | 2 | 114 | 28946 | 80.82 | 1441 | 1448 | 340.3 |
| D | 8 | 195 | 709034 | 2029.04 | 1467 | 1427 | 348.7 |
| D | 13 | 104 | 141759 | 402.4 | 1467 | 1427 | 348.7 |
| D | 2 | 234 | 56589 | 158.17 | 1467 | 1427 | 348.7 |
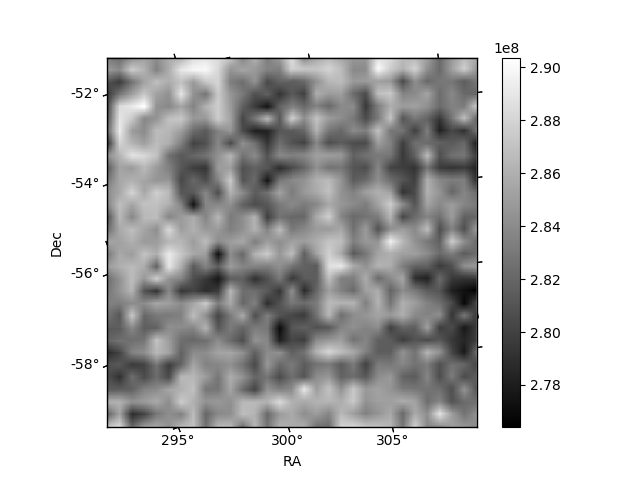
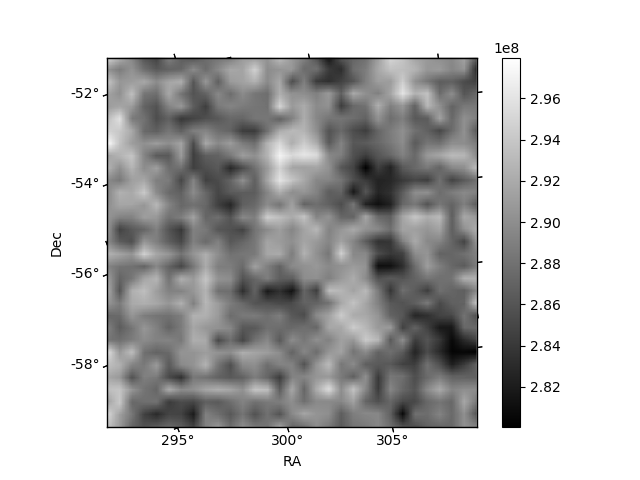
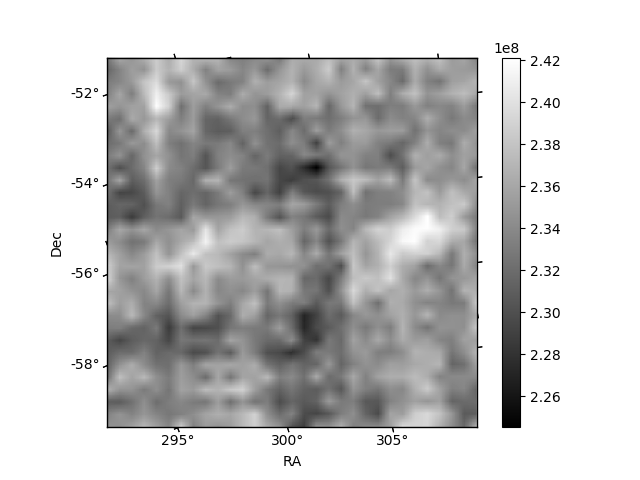
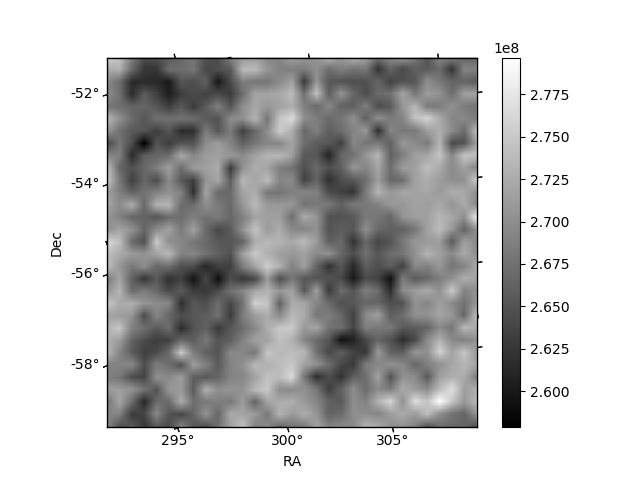
Histogram calculated using DETX and DETY for each event in the final _common_clean file
| Quadrant A | 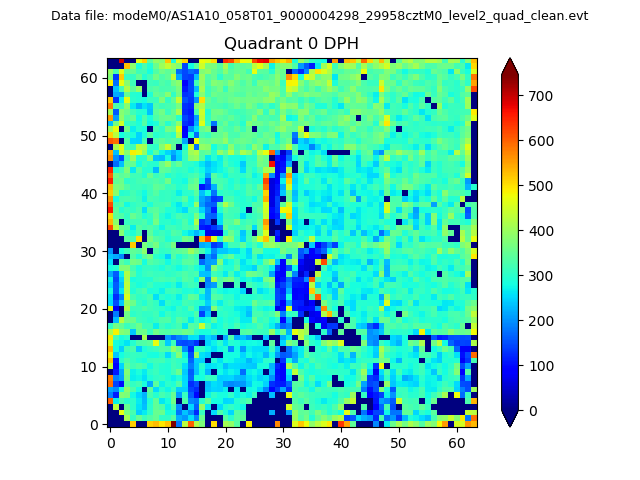 |
 |
Quadrant B |
|---|---|---|---|
| Quadrant D | 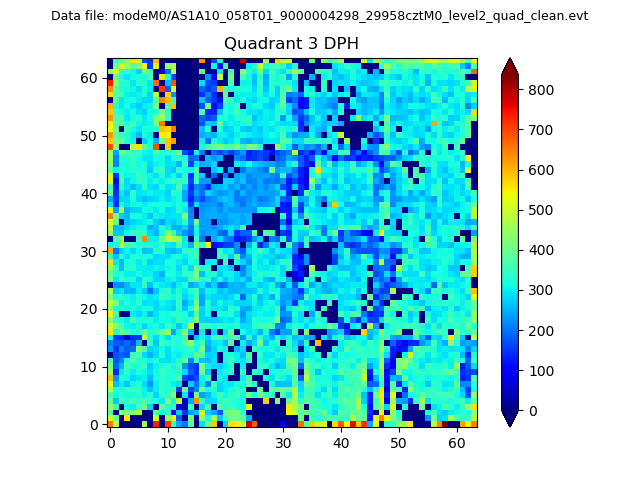 |
 |
Quadrant C |
| Plot type | Count rate plots | Images |
|---|---|---|
| Comparison with Poisson distribution Blue bars denote a histogram of data divided into 1 sec bins. Red curve is a Poisson curve with rate = median count rate of data. |
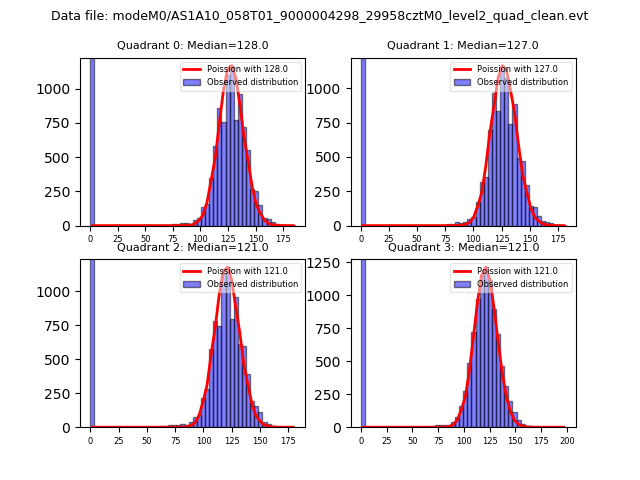 |
 |
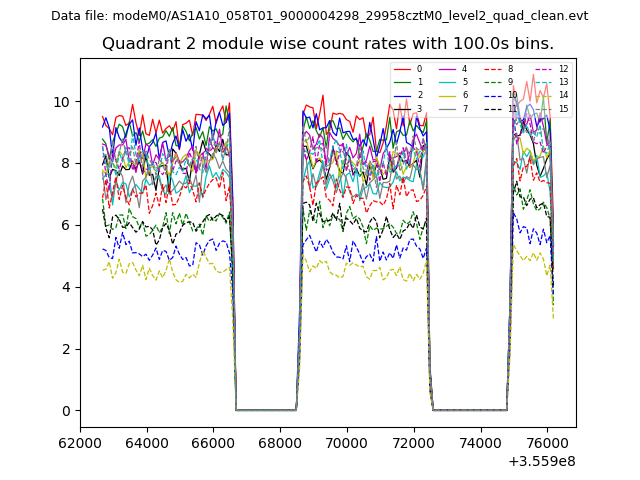
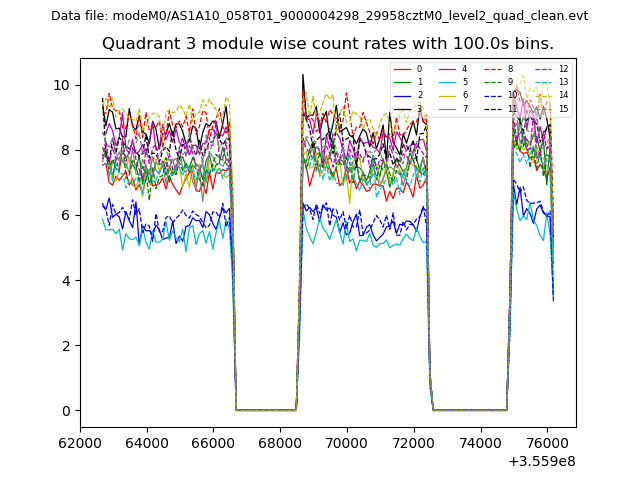
| Quadrant-wise count rates Data is divided into 100 sec bins |
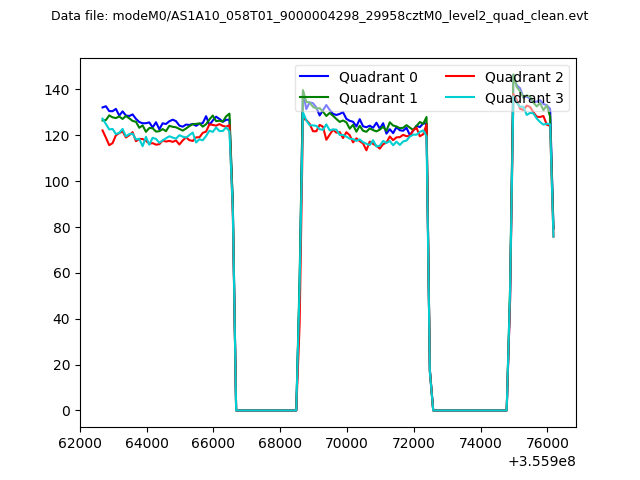 |
|
| Module-wise count rates for Quadrant A Data is divided into 100 sec bins |
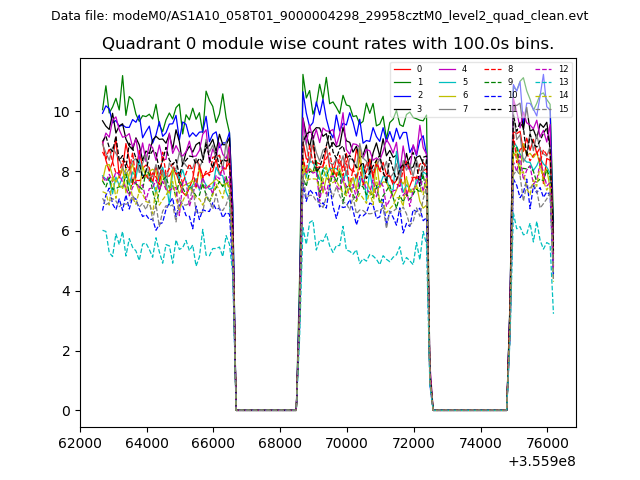 |
 |
| Module-wise count rates for Quadrant B Data is divided into 100 sec bins |
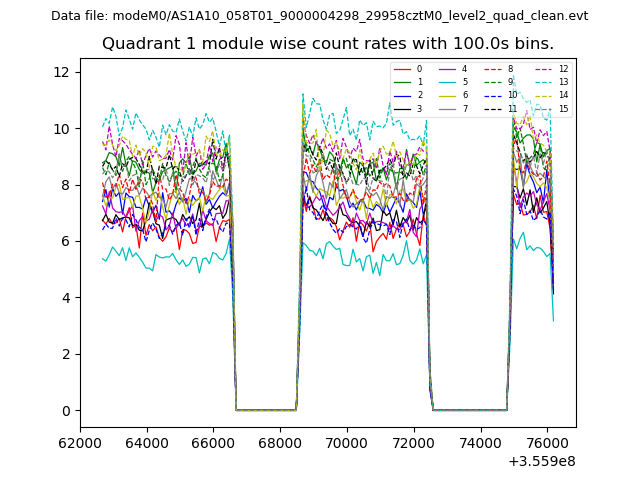 |
 |
| Module-wise count rates for Quadrant C Data is divided into 100 sec bins |
 |
 |
| Module-wise count rates for Quadrant D Data is divided into 100 sec bins |
 |
 |
| Parameter | Plot |
|---|---|
| CZT HV Monitor | 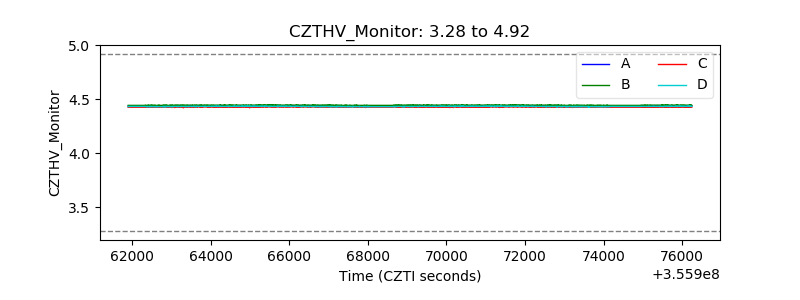 |
| D_VDD | 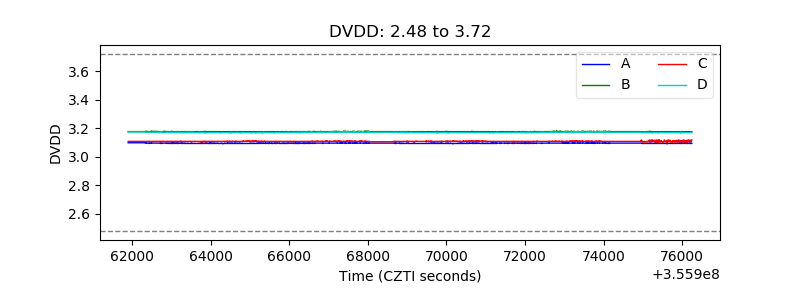 |
| Temperature 1 | 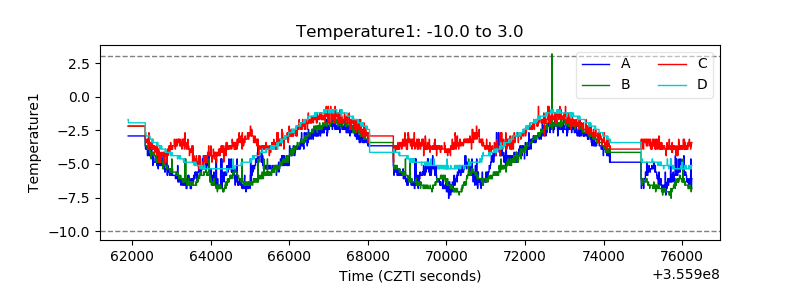 |
| Veto HV Monitor | 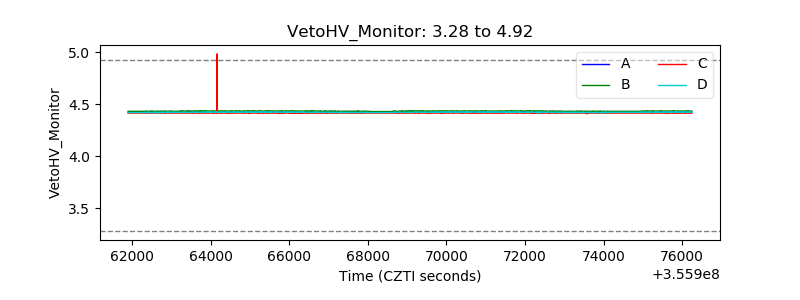 |
| Veto LLD | 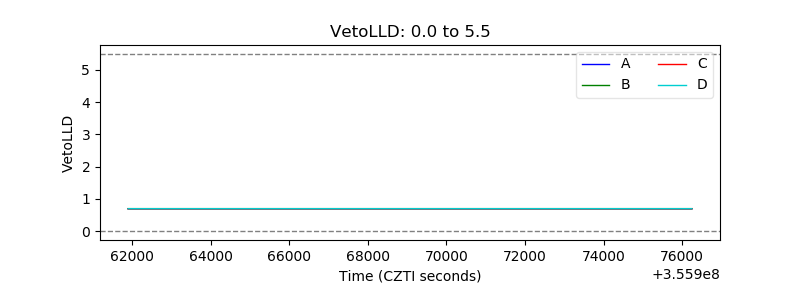 |
| Alpha Counter | 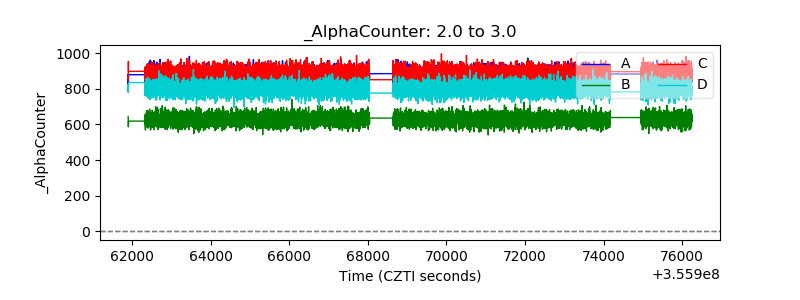 |
| _CPM_Rate | 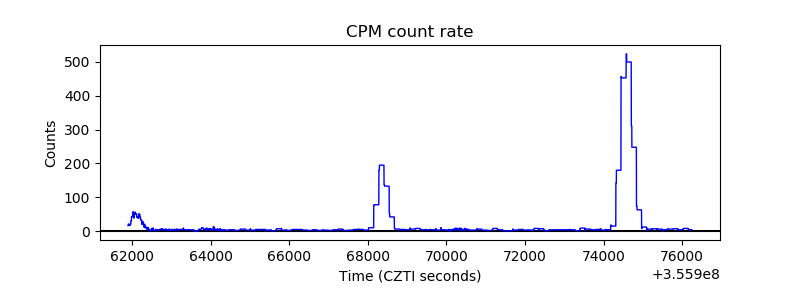 |
| CZT Counter | 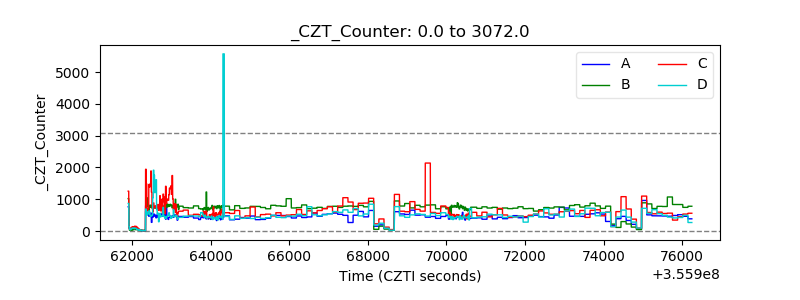 |
| +2.5 Volts monitor |  |
| +5 Volts monitor |  |
| _ROLL_ROT | 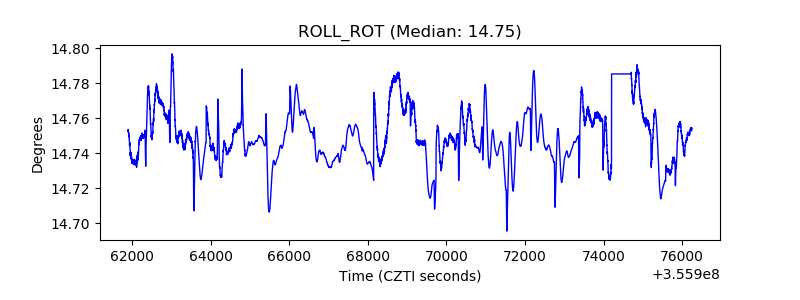 |
| _Roll_DEC | 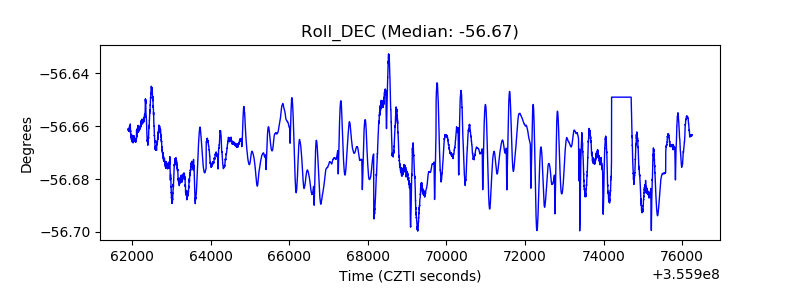 |
| _Roll_RA | 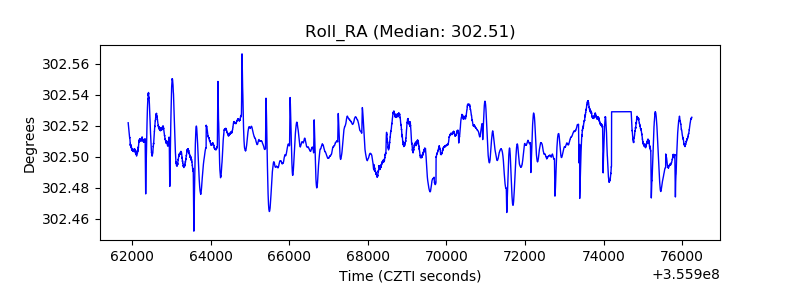 |
| Veto Counter | 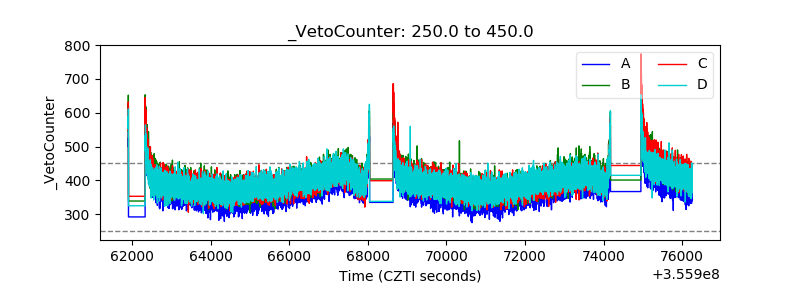 |