| Param | Original file | Final file |
|---|---|---|
| Filename | modeM0/AS1A10_058T01_9000004298_29960cztM0_level2.evt | modeM0/AS1A10_058T01_9000004298_29960cztM0_level2_quad_clean.evt |
| Size (bytes) | 944,386,560 | 148,993,920 |
| Size | 900.6 MB | 142.1 MB |
| Events in quadrant A | 5,417,482 | 961,174 |
| Events in quadrant B | 8,546,289 | 960,035 |
| Events in quadrant C | 7,087,892 | 930,013 |
| Events in quadrant D | 6,822,611 | 915,461 |
| Mode M9 | |||
|---|---|---|---|
| Quadrant | BADHDUFLAG | Total packets | Discarded packets |
| A | 0 | 19 | 0 |
| B | 0 | 19 | 0 |
| C | 0 | 19 | 0 |
| D | 0 | 19 | 0 |
| Mode M0 | |||
|---|---|---|---|
| Quadrant | BADHDUFLAG | Total packets | Discarded packets |
| A | 0 | 22980 | 3 |
| B | 0 | 33080 | 3 |
| C | 0 | 28520 | 3 |
| D | 0 | 27066 | 3 |
| Mode SS | |||
|---|---|---|---|
| Quadrant | BADHDUFLAG | Total packets | Discarded packets |
| A | 0 | 220 | 0 |
| B | 0 | 220 | 0 |
| C | 0 | 220 | 0 |
| D | 0 | 220 | 0 |
| Quadrant | Total seconds | Saturated seconds | Saturation percentage |
|---|---|---|---|
| A | 10769 | 94 | 0.872876% |
| B | 10769 | 153 | 1.420745% |
| C | 10769 | 211 | 1.959328% |
| D | 10769 | 322 | 2.990064% |
Noise dominated data is calculated using 1-second bins in cleaned event files. If a bin has >2000 counts, and if more than 50% of those come from <1% of pixels, then it is considered to be noise-dominated and hence unusable.
| Quadrant | # 1 sec bins | Bins with >0 counts | Bins with >2000 counts | High rate bins dominated by noise | Noise dominated (total time) | Noise dominated (detector-on time) | Marked lightcurve |
|---|---|---|---|---|---|---|---|
| A | 12780 | 10772 | 23 | 23 | 0.18% | 0.21% | 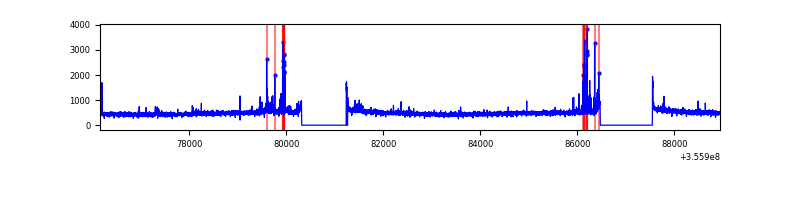 |
| B | 12780 | 10772 | 19 | 19 | 0.15% | 0.18% | 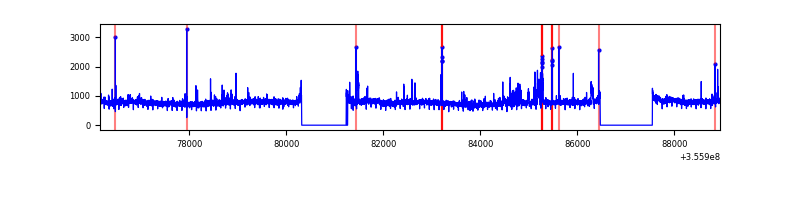 |
| C | 12780 | 10772 | 9 | 9 | 0.07% | 0.08% | 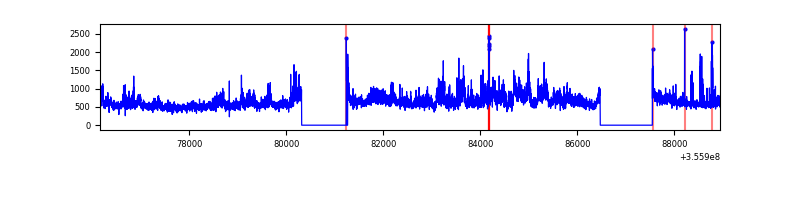 |
| D | 12780 | 10772 | 251 | 251 | 1.96% | 2.33% | 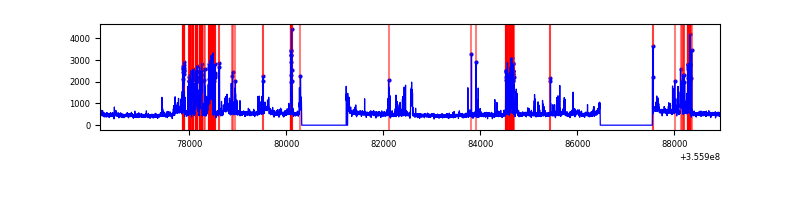 |
Top three noisy pixels from each quadrant. If the there are fewer than three noisy pixels in the level2.evt file, extra rows are filled as -1
| Pixel properties | Quadrant properties | ||||||
|---|---|---|---|---|---|---|---|
| Quadrant | DetID | PixID | Counts | Sigma | Mean | Median | Sigma |
| A | 12 | 96 | 271722 | 1028.87 | 1325 | 1298 | 262.8 |
| A | 8 | 192 | 27491 | 99.66 | 1325 | 1298 | 262.8 |
| A | 13 | 254 | 19991 | 71.12 | 1325 | 1298 | 262.8 |
| B | 6 | 159 | 3050832 | 12357.68 | 1304 | 1272 | 246.8 |
| B | 6 | 36 | 329582 | 1330.4 | 1304 | 1272 | 246.8 |
| B | 12 | 111 | 30281 | 117.55 | 1304 | 1272 | 246.8 |
| C | 3 | 233 | 1775422 | 5948.69 | 1280 | 1286 | 298.2 |
| C | 14 | 238 | 211873 | 706.1 | 1280 | 1286 | 298.2 |
| C | 15 | 208 | 76443 | 252.0 | 1280 | 1286 | 298.2 |
| D | 6 | 112 | 636426 | 2109.62 | 1294 | 1263 | 301.1 |
| D | 8 | 195 | 529667 | 1755.03 | 1294 | 1263 | 301.1 |
| D | 7 | 80 | 294658 | 974.48 | 1294 | 1263 | 301.1 |
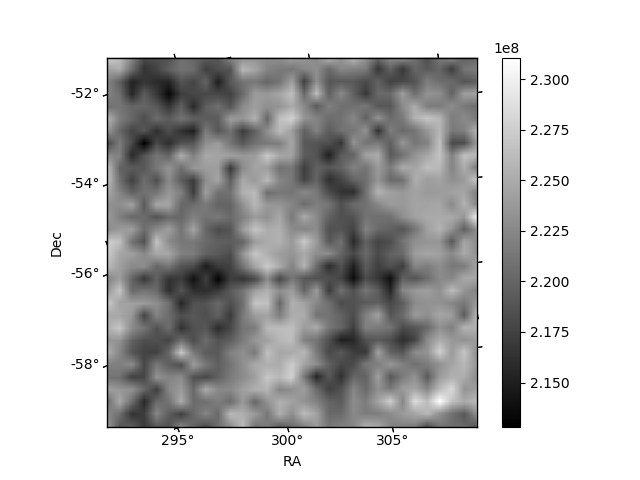
Histogram calculated using DETX and DETY for each event in the final _common_clean file
| Quadrant A | 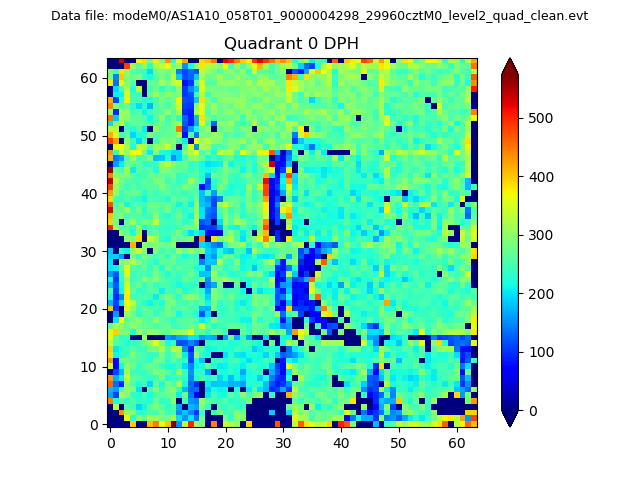 |
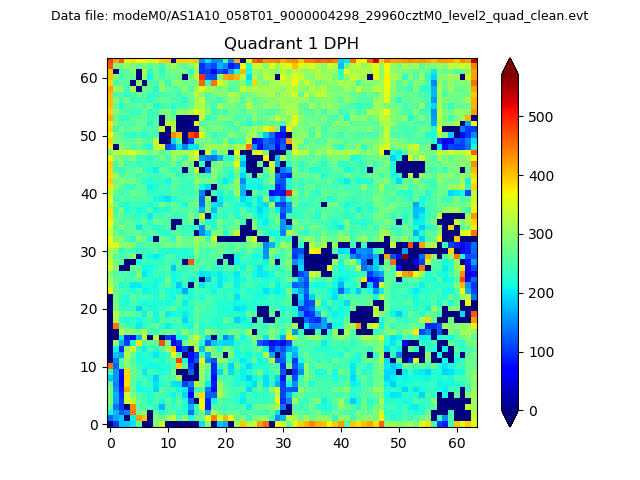 |
Quadrant B |
|---|---|---|---|
| Quadrant D | 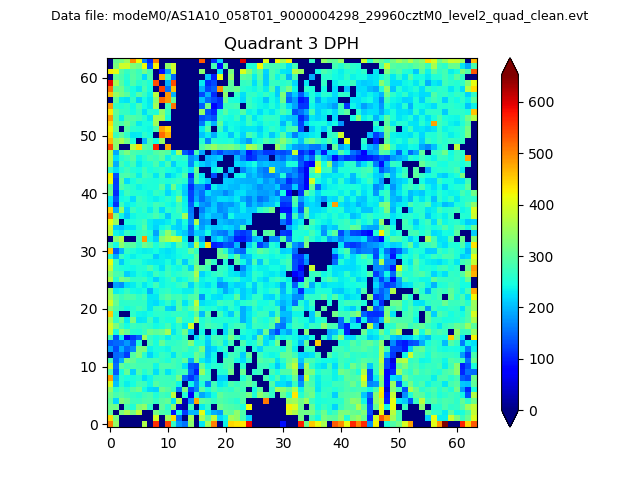 |
 |
Quadrant C |
| Plot type | Count rate plots | Images |
|---|---|---|
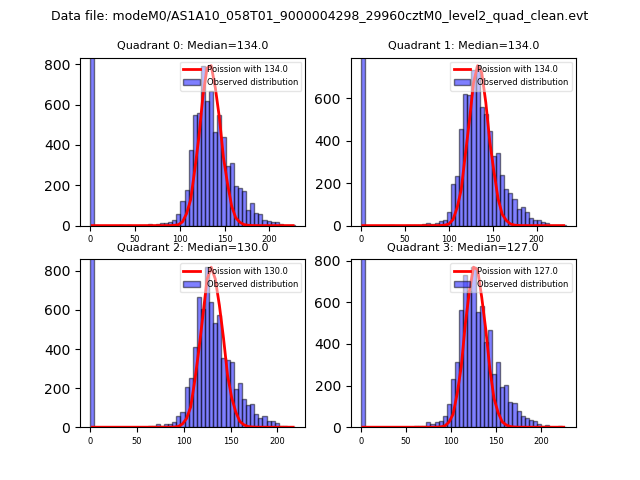
| Comparison with Poisson distribution Blue bars denote a histogram of data divided into 1 sec bins. Red curve is a Poisson curve with rate = median count rate of data. |
 |
 |
| Quadrant-wise count rates Data is divided into 100 sec bins |
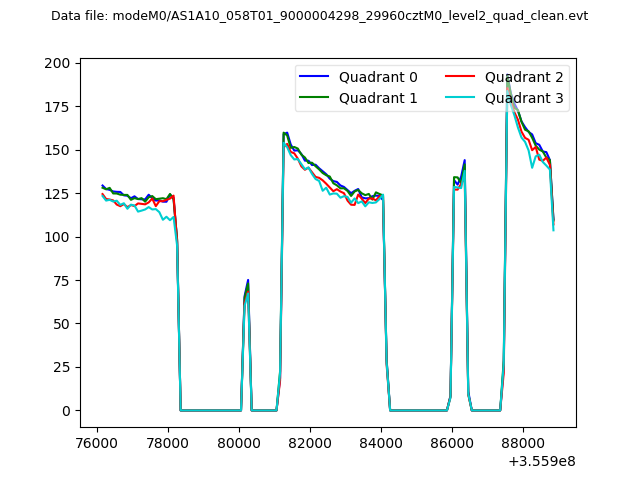 |
|
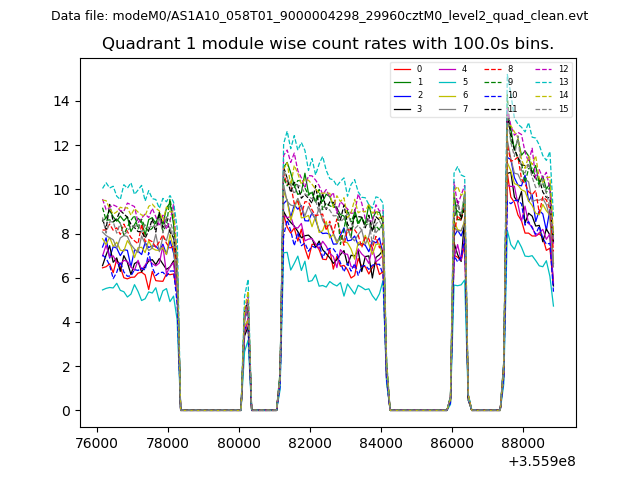
| Module-wise count rates for Quadrant A Data is divided into 100 sec bins |
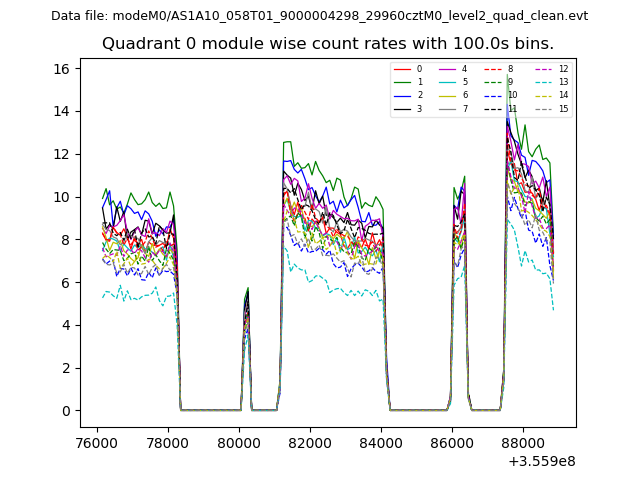 |
 |
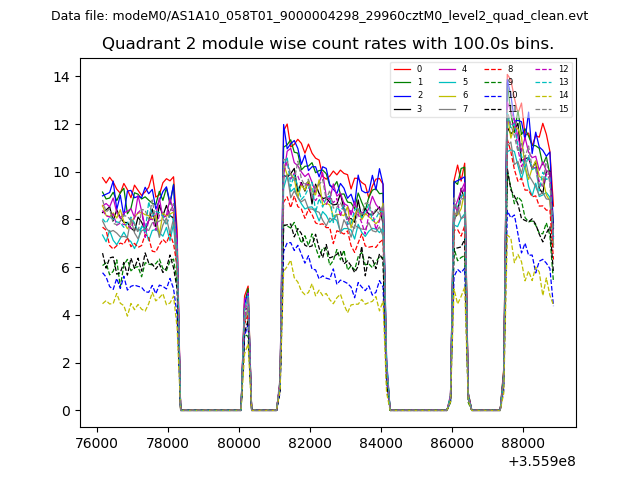
| Module-wise count rates for Quadrant B Data is divided into 100 sec bins |
 |
 |
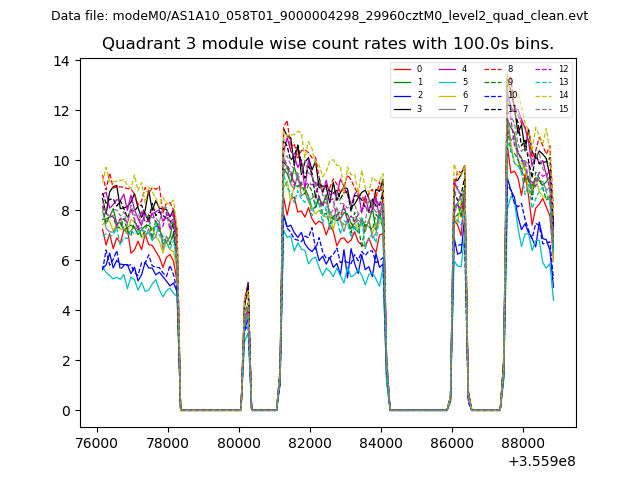
| Module-wise count rates for Quadrant C Data is divided into 100 sec bins |
 |
 |
| Module-wise count rates for Quadrant D Data is divided into 100 sec bins |
 |
 |
| Parameter | Plot |
|---|---|
| CZT HV Monitor | 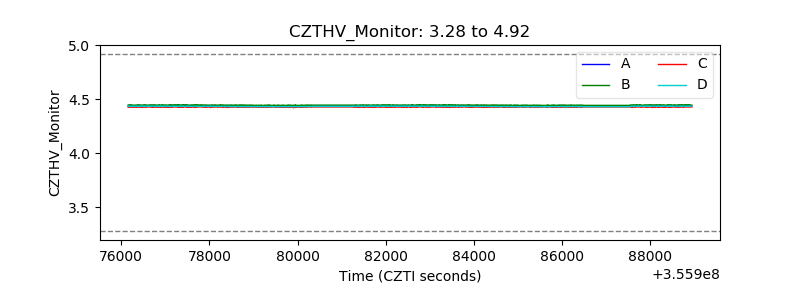 |
| D_VDD | 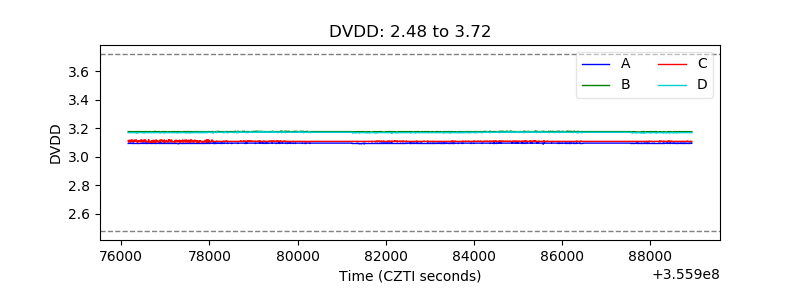 |
| Temperature 1 | 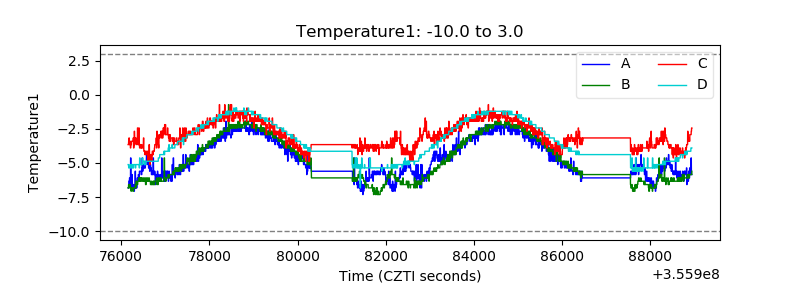 |
| Veto HV Monitor | 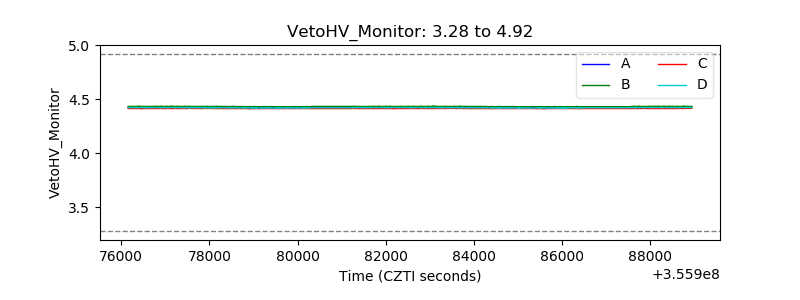 |
| Veto LLD | 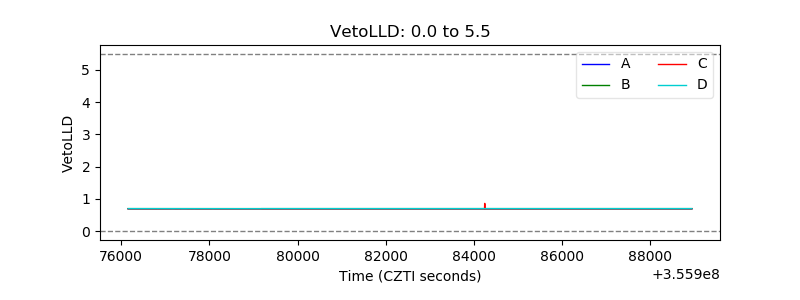 |
| Alpha Counter | 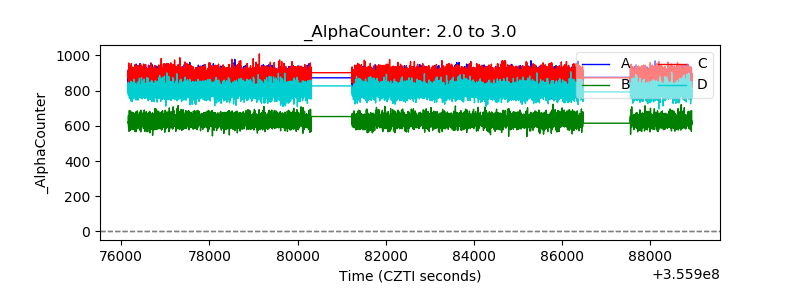 |
| _CPM_Rate | 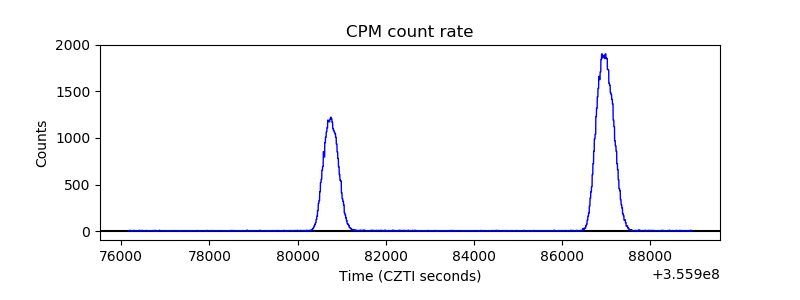 |
| CZT Counter |  |
| +2.5 Volts monitor |  |
| +5 Volts monitor |  |
| _ROLL_ROT | 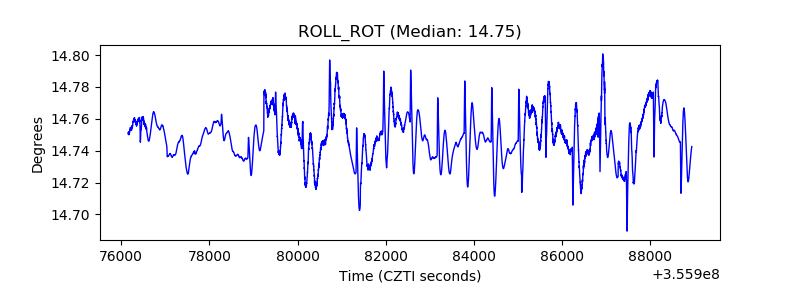 |
| _Roll_DEC | 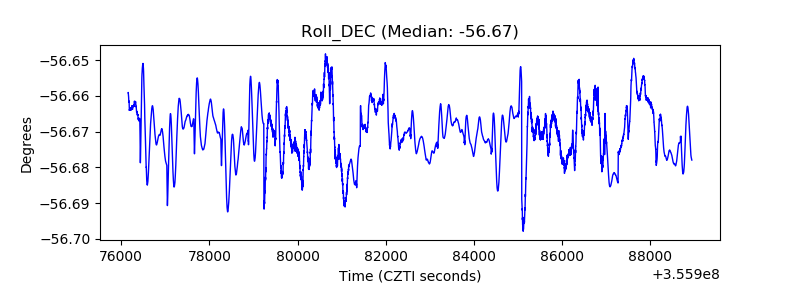 |
| _Roll_RA |  |
| Veto Counter | 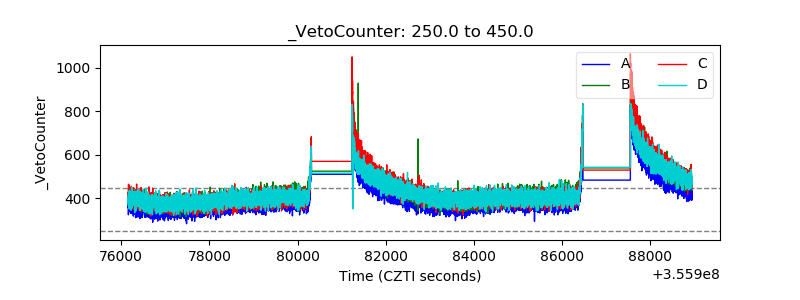 |