| Param | Original file | Final file |
|---|---|---|
| Filename | modeM0/AS1A10_058T01_9000004298_29961cztM0_level2.evt | modeM0/AS1A10_058T01_9000004298_29961cztM0_level2_quad_clean.evt |
| Size (bytes) | 699,592,320 | 94,553,280 |
| Size | 667.2 MB | 90.2 MB |
| Events in quadrant A | 3,280,143 | 644,333 |
| Events in quadrant B | 7,377,187 | 590,140 |
| Events in quadrant C | 6,538,563 | 598,804 |
| Events in quadrant D | 3,585,543 | 609,479 |
| Mode M9 | |||
|---|---|---|---|
| Quadrant | BADHDUFLAG | Total packets | Discarded packets |
| A | 0 | 12 | 0 |
| B | 0 | 12 | 0 |
| C | 0 | 12 | 0 |
| D | 0 | 12 | 0 |
| Mode M0 | |||
|---|---|---|---|
| Quadrant | BADHDUFLAG | Total packets | Discarded packets |
| A | 0 | 13450 | 1 |
| B | 0 | 25949 | 5 |
| C | 0 | 23757 | 1 |
| D | 0 | 14424 | 1 |
| Mode SS | |||
|---|---|---|---|
| Quadrant | BADHDUFLAG | Total packets | Discarded packets |
| A | 0 | 122 | 0 |
| B | 0 | 122 | 0 |
| C | 0 | 122 | 0 |
| D | 0 | 122 | 0 |
| Quadrant | Total seconds | Saturated seconds | Saturation percentage |
|---|---|---|---|
| A | 6018 | 109 | 1.811233% |
| B | 6017 | 1154 | 19.178993% |
| C | 6017 | 795 | 13.212564% |
| D | 6017 | 91 | 1.512382% |
Noise dominated data is calculated using 1-second bins in cleaned event files. If a bin has >2000 counts, and if more than 50% of those come from <1% of pixels, then it is considered to be noise-dominated and hence unusable.
| Quadrant | # 1 sec bins | Bins with >0 counts | Bins with >2000 counts | High rate bins dominated by noise | Noise dominated (total time) | Noise dominated (detector-on time) | Marked lightcurve |
|---|---|---|---|---|---|---|---|
| A | 7203 | 6019 | 47 | 47 | 0.65% | 0.78% | 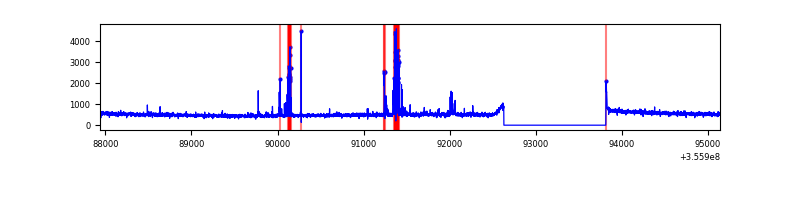 |
| B | 7202 | 6018 | 798 | 798 | 11.08% | 13.26% | 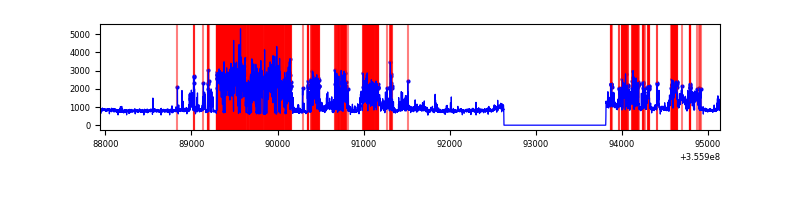 |
| C | 7202 | 6018 | 361 | 361 | 5.01% | 6.00% | 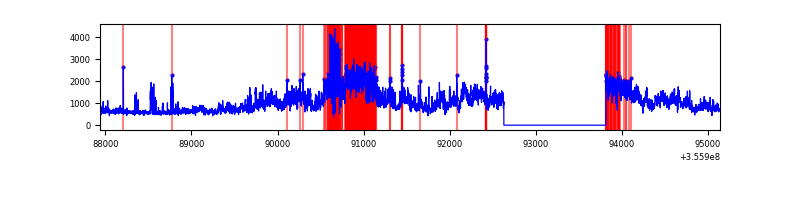 |
| D | 7202 | 6018 | 38 | 38 | 0.53% | 0.63% | 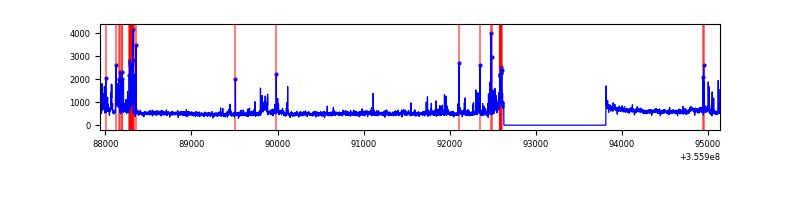 |
Top three noisy pixels from each quadrant. If the there are fewer than three noisy pixels in the level2.evt file, extra rows are filled as -1
| Pixel properties | Quadrant properties | ||||||
|---|---|---|---|---|---|---|---|
| Quadrant | DetID | PixID | Counts | Sigma | Mean | Median | Sigma |
| A | 12 | 96 | 226833 | 1455.14 | 786 | 768 | 155.4 |
| A | 8 | 192 | 13511 | 82.02 | 786 | 768 | 155.4 |
| A | 13 | 254 | 11477 | 68.93 | 786 | 768 | 155.4 |
| B | 6 | 36 | 2856877 | 20783.01 | 731 | 712 | 137.4 |
| B | 6 | 159 | 1636321 | 11901.58 | 731 | 712 | 137.4 |
| B | 12 | 111 | 15988 | 111.16 | 731 | 712 | 137.4 |
| C | 3 | 233 | 3310722 | 19413.86 | 736 | 742 | 170.5 |
| C | 15 | 208 | 213284 | 1246.61 | 736 | 742 | 170.5 |
| C | 14 | 238 | 118548 | 690.96 | 736 | 742 | 170.5 |
| D | 7 | 80 | 346574 | 1904.3 | 774 | 754 | 181.6 |
| D | 8 | 195 | 251688 | 1381.8 | 774 | 754 | 181.6 |
| D | 12 | 233 | 24428 | 130.36 | 774 | 754 | 181.6 |
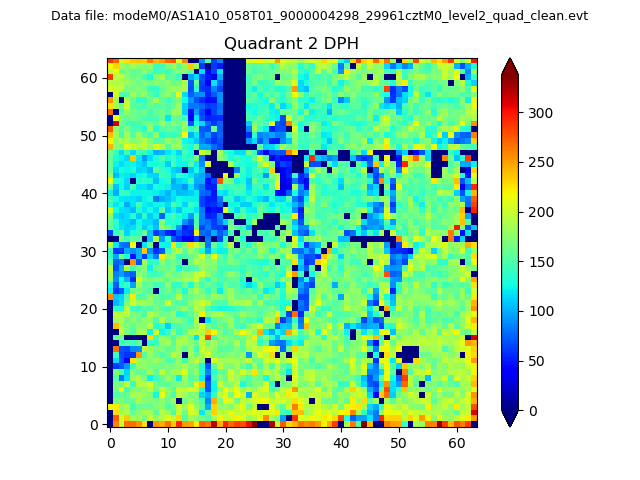
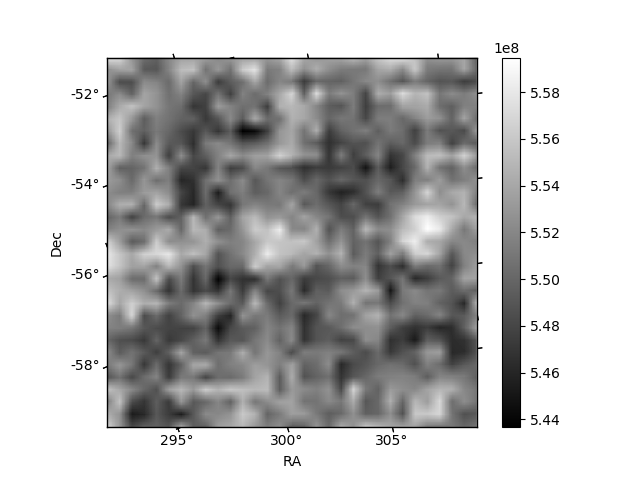
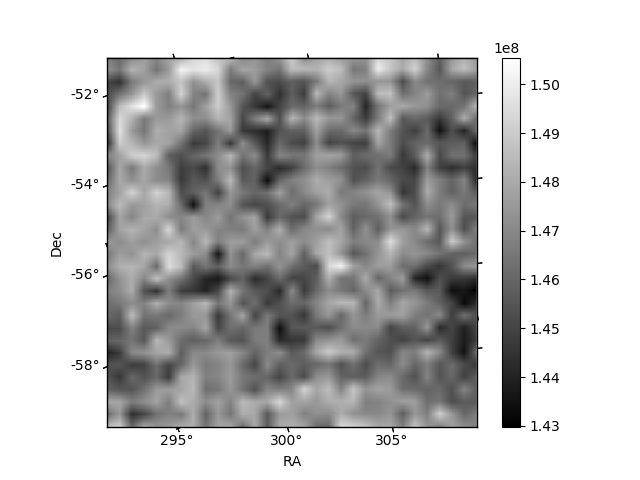
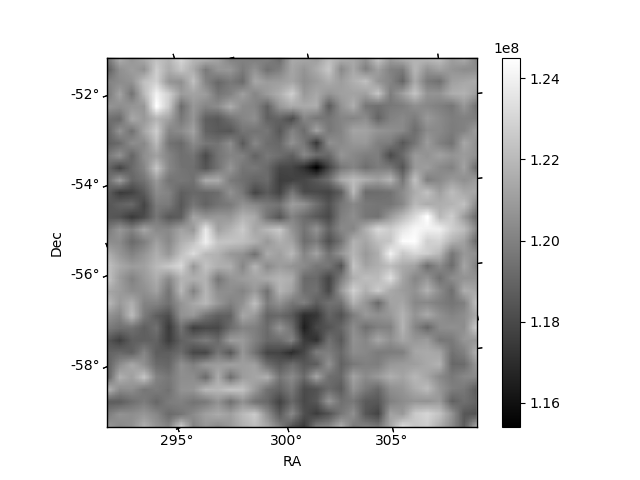
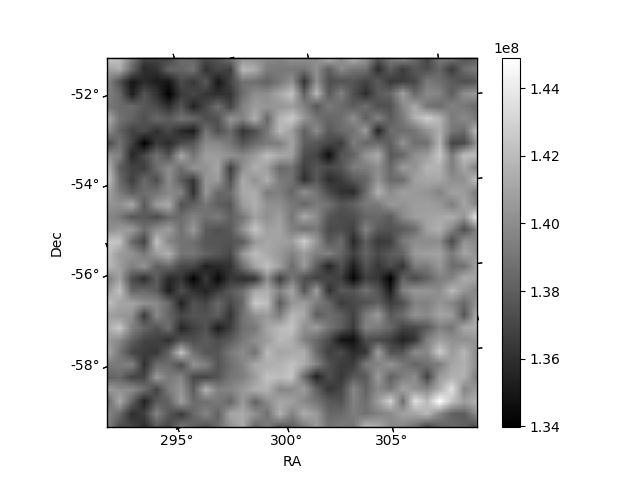
Histogram calculated using DETX and DETY for each event in the final _common_clean file
| Quadrant A | 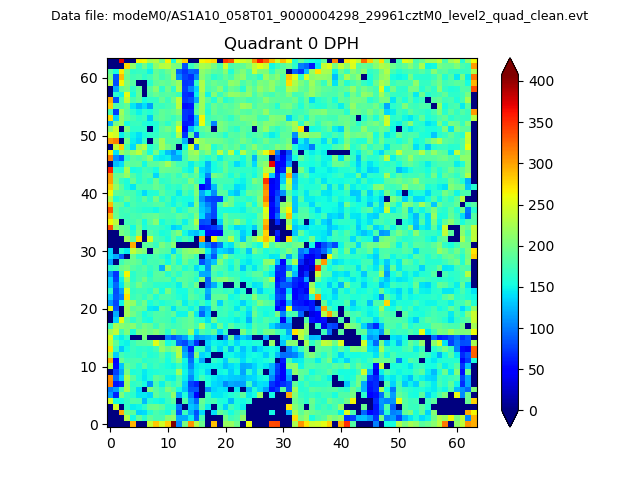 |
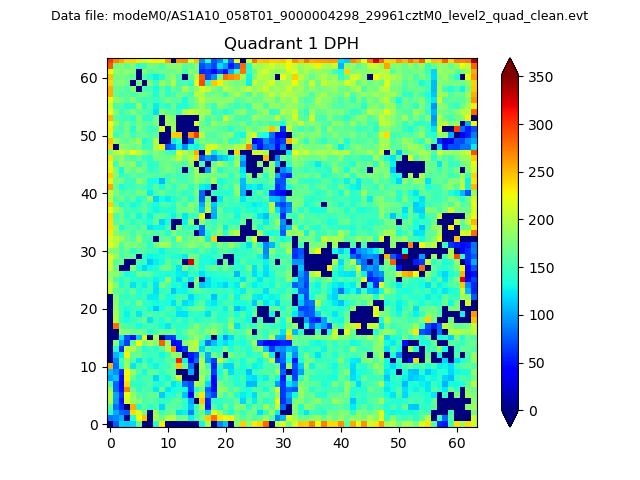 |
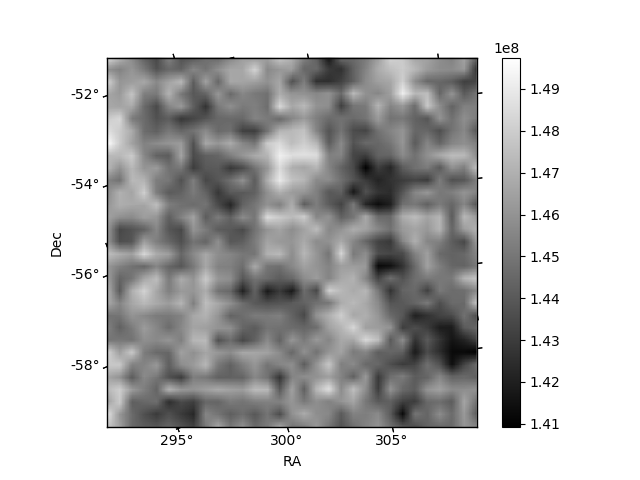
Quadrant B |
|---|---|---|---|
| Quadrant D | 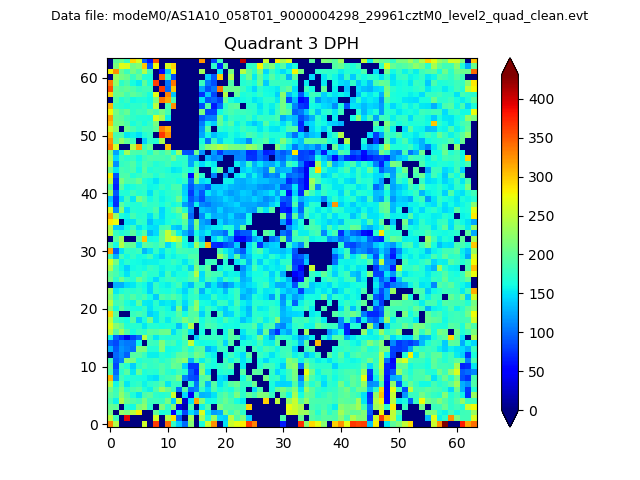 |
 |
Quadrant C |
| Plot type | Count rate plots | Images |
|---|---|---|
| Comparison with Poisson distribution Blue bars denote a histogram of data divided into 1 sec bins. Red curve is a Poisson curve with rate = median count rate of data. |
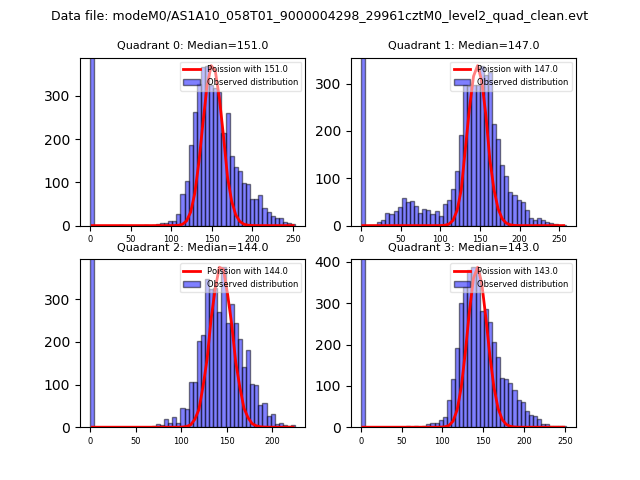 |
 |
| Quadrant-wise count rates Data is divided into 100 sec bins |
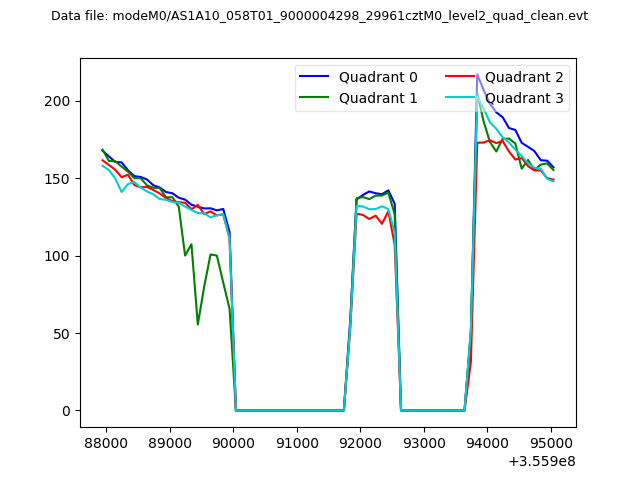 |
|
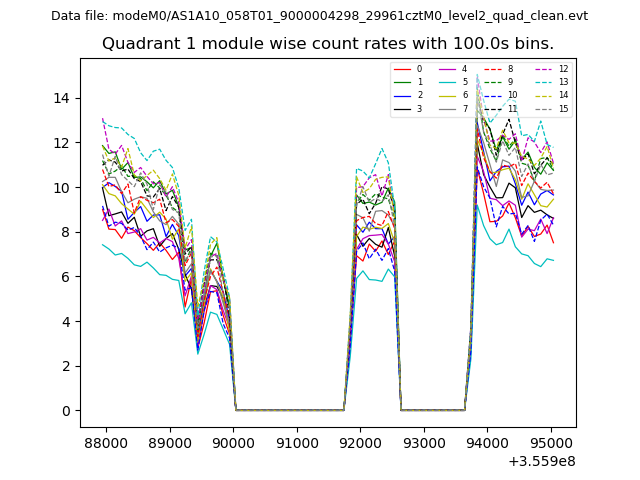
| Module-wise count rates for Quadrant A Data is divided into 100 sec bins |
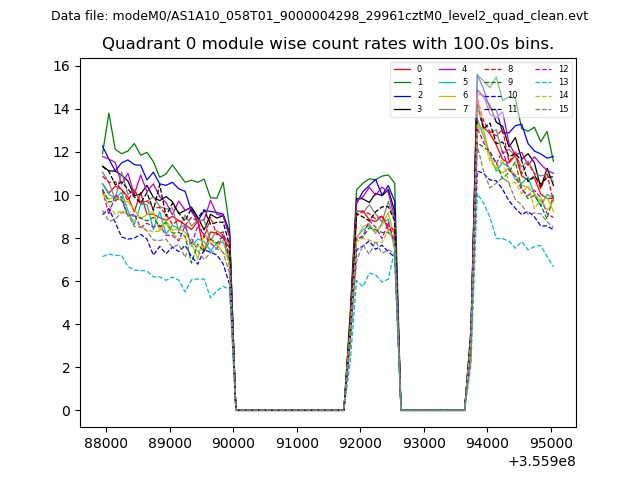 |
 |
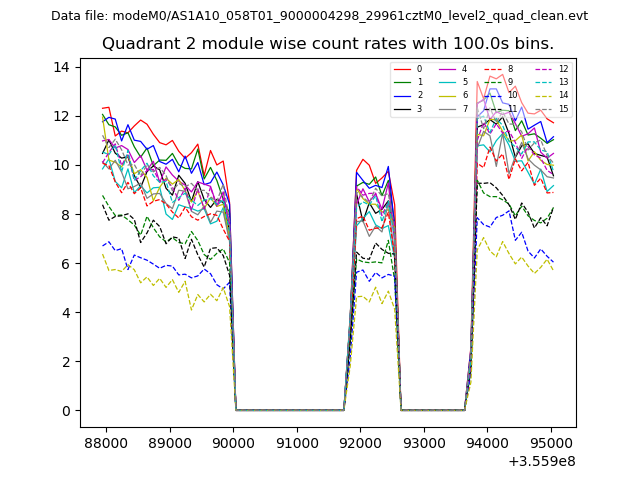
| Module-wise count rates for Quadrant B Data is divided into 100 sec bins |
 |
 |
| Module-wise count rates for Quadrant C Data is divided into 100 sec bins |
 |
 |
| Module-wise count rates for Quadrant D Data is divided into 100 sec bins |
 |
 |
| Parameter | Plot |
|---|---|
| CZT HV Monitor | 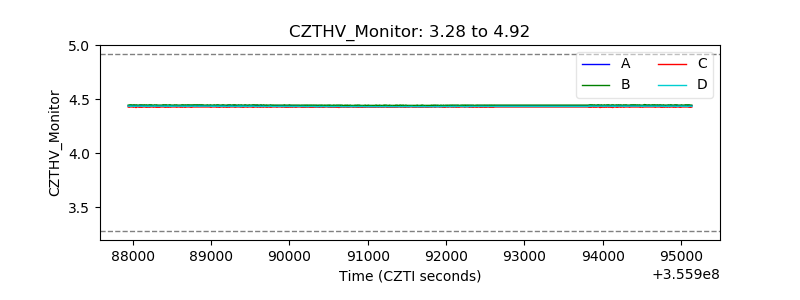 |
| D_VDD | 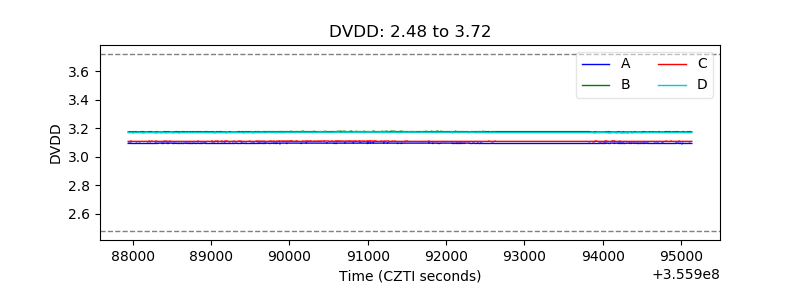 |
| Temperature 1 | 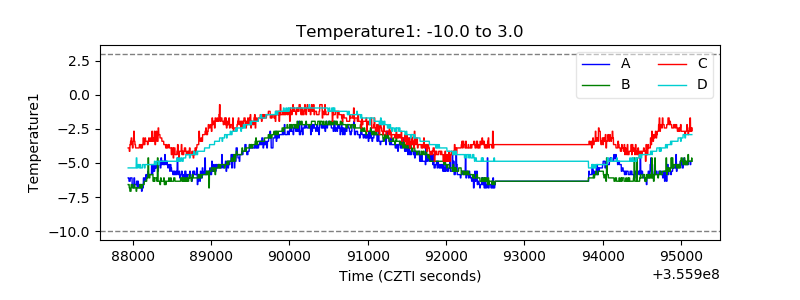 |
| Veto HV Monitor | 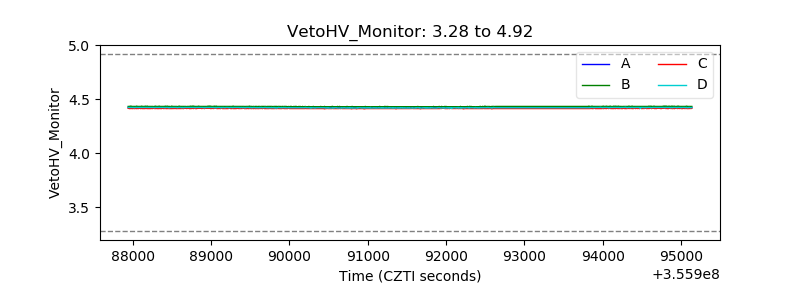 |
| Veto LLD | 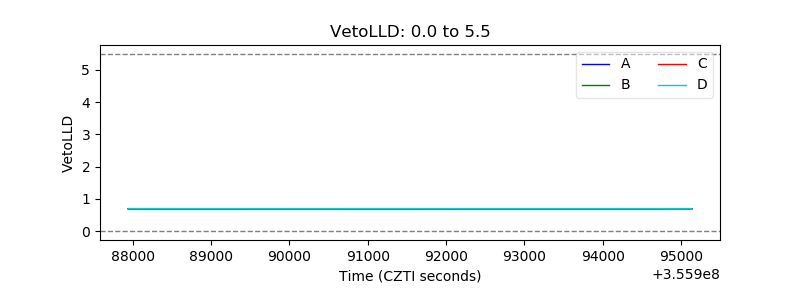 |
| Alpha Counter | 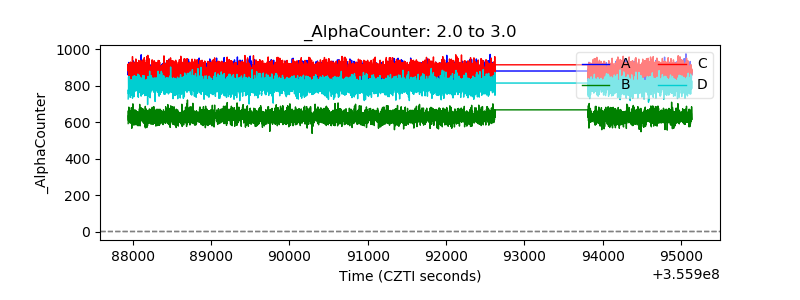 |
| _CPM_Rate | 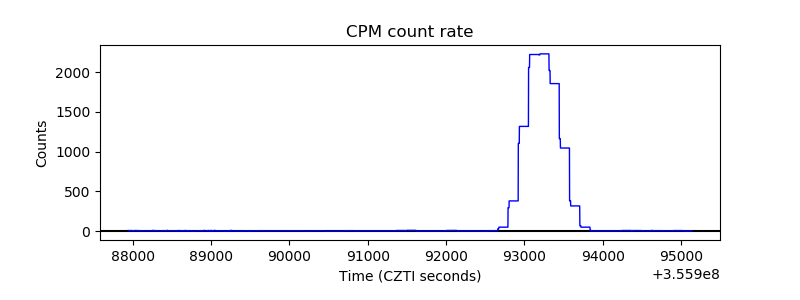 |
| CZT Counter | 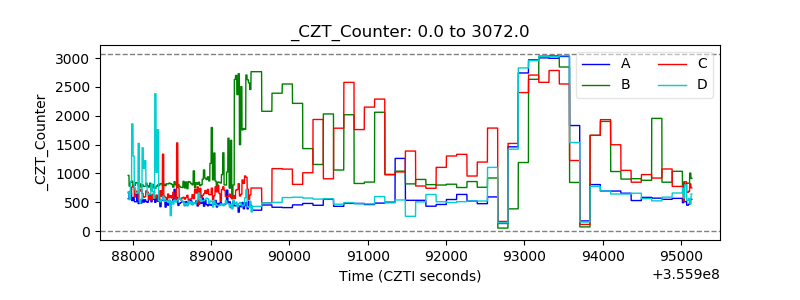 |
| +2.5 Volts monitor |  |
| +5 Volts monitor |  |
| _ROLL_ROT |  |
| _Roll_DEC |  |
| _Roll_RA | 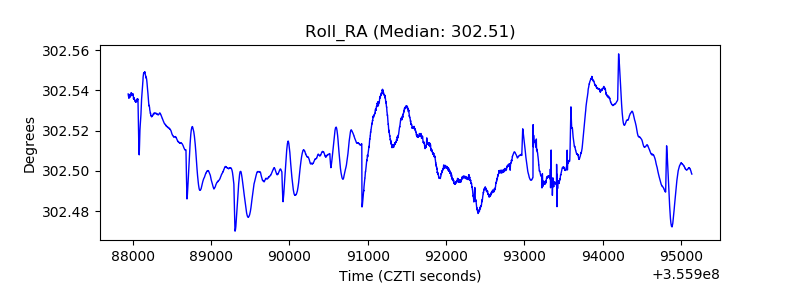 |
| Veto Counter | 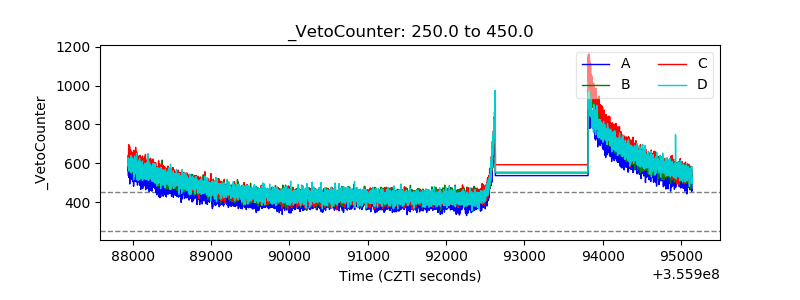 |