| Param | Original file | Final file |
|---|---|---|
| Filename | modeM0/AS1A10_058T01_9000004298_29962cztM0_level2.evt | modeM0/AS1A10_058T01_9000004298_29962cztM0_level2_quad_clean.evt |
| Size (bytes) | 814,861,440 | 104,673,600 |
| Size | 777.1 MB | 99.8 MB |
| Events in quadrant A | 3,455,907 | 726,265 |
| Events in quadrant B | 5,775,187 | 712,311 |
| Events in quadrant C | 11,102,527 | 606,021 |
| Events in quadrant D | 3,921,330 | 686,343 |
| Mode M9 | |||
|---|---|---|---|
| Quadrant | BADHDUFLAG | Total packets | Discarded packets |
| A | 0 | 13 | 0 |
| B | 0 | 13 | 0 |
| C | 0 | 13 | 0 |
| D | 0 | 13 | 0 |
| Mode M0 | |||
|---|---|---|---|
| Quadrant | BADHDUFLAG | Total packets | Discarded packets |
| A | 0 | 14016 | 1 |
| B | 0 | 21338 | 1 |
| C | 0 | 37345 | 3 |
| D | 0 | 15799 | 1 |
| Mode SS | |||
|---|---|---|---|
| Quadrant | BADHDUFLAG | Total packets | Discarded packets |
| A | 0 | 128 | 0 |
| B | 0 | 128 | 0 |
| C | 0 | 128 | 0 |
| D | 0 | 128 | 0 |
| Quadrant | Total seconds | Saturated seconds | Saturation percentage |
|---|---|---|---|
| A | 6279 | 91 | 1.449275% |
| B | 6280 | 175 | 2.786624% |
| C | 6279 | 3170 | 50.485746% |
| D | 6279 | 66 | 1.051123% |
Noise dominated data is calculated using 1-second bins in cleaned event files. If a bin has >2000 counts, and if more than 50% of those come from <1% of pixels, then it is considered to be noise-dominated and hence unusable.
| Quadrant | # 1 sec bins | Bins with >0 counts | Bins with >2000 counts | High rate bins dominated by noise | Noise dominated (total time) | Noise dominated (detector-on time) | Marked lightcurve |
|---|---|---|---|---|---|---|---|
| A | 7554 | 6280 | 24 | 24 | 0.32% | 0.38% | 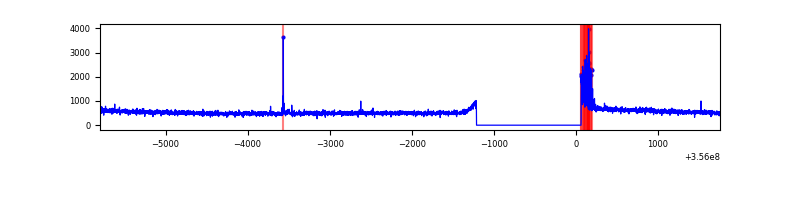 |
| B | 7555 | 6281 | 70 | 70 | 0.93% | 1.11% | 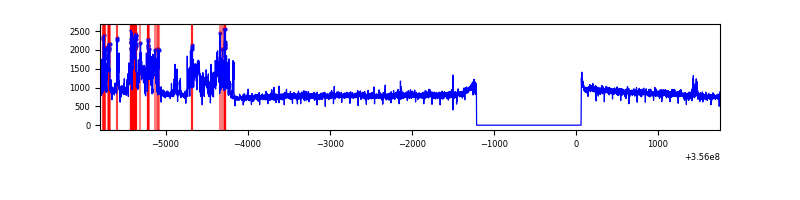 |
| C | 7554 | 6280 | 2344 | 2344 | 31.03% | 37.32% | 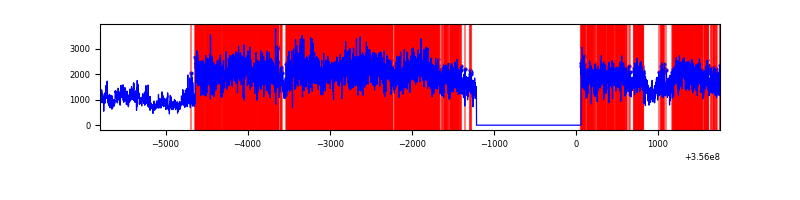 |
| D | 7554 | 6280 | 19 | 19 | 0.25% | 0.30% | 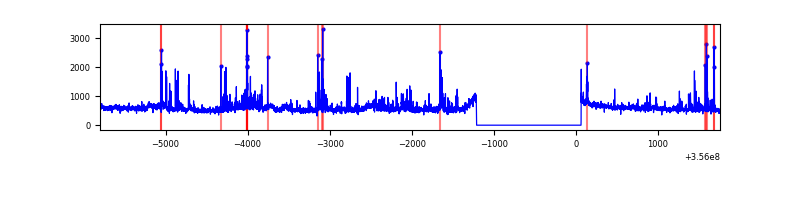 |
Top three noisy pixels from each quadrant. If the there are fewer than three noisy pixels in the level2.evt file, extra rows are filled as -1
| Pixel properties | Quadrant properties | ||||||
|---|---|---|---|---|---|---|---|
| Quadrant | DetID | PixID | Counts | Sigma | Mean | Median | Sigma |
| A | 12 | 96 | 114537 | 675.4 | 862 | 848 | 168.3 |
| A | 8 | 192 | 12546 | 69.5 | 862 | 848 | 168.3 |
| A | 13 | 254 | 12211 | 67.51 | 862 | 848 | 168.3 |
| B | 6 | 159 | 1785606 | 11519.12 | 833 | 814 | 154.9 |
| B | 6 | 36 | 706743 | 4556.09 | 833 | 814 | 154.9 |
| B | 12 | 111 | 17848 | 109.93 | 833 | 814 | 154.9 |
| C | 3 | 233 | 8114594 | 48284.54 | 732 | 740 | 168.0 |
| C | 14 | 238 | 117252 | 693.35 | 732 | 740 | 168.0 |
| C | 2 | 114 | 13015 | 73.05 | 732 | 740 | 168.0 |
| D | 7 | 80 | 310333 | 1586.47 | 841 | 823 | 195.1 |
| D | 8 | 195 | 295856 | 1512.27 | 841 | 823 | 195.1 |
| D | 12 | 233 | 88856 | 451.24 | 841 | 823 | 195.1 |
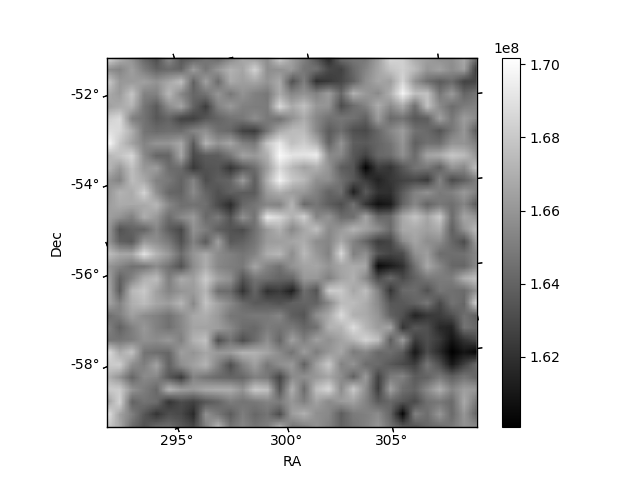
Histogram calculated using DETX and DETY for each event in the final _common_clean file
| Quadrant A | 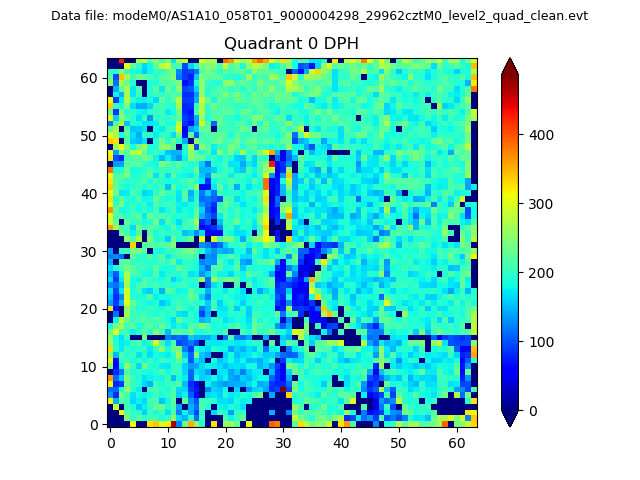 |
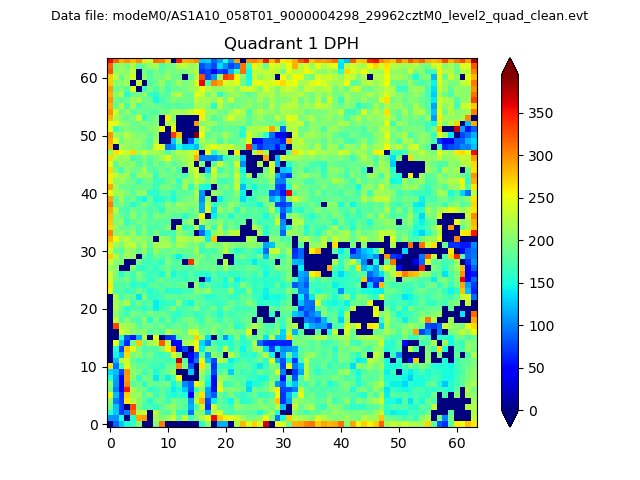 |
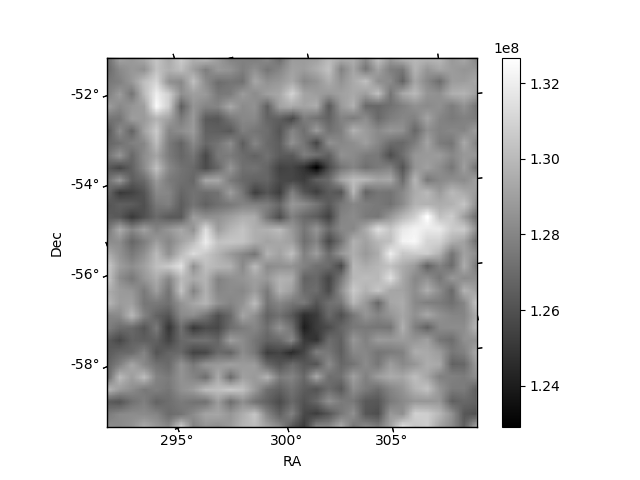
Quadrant B |
|---|---|---|---|
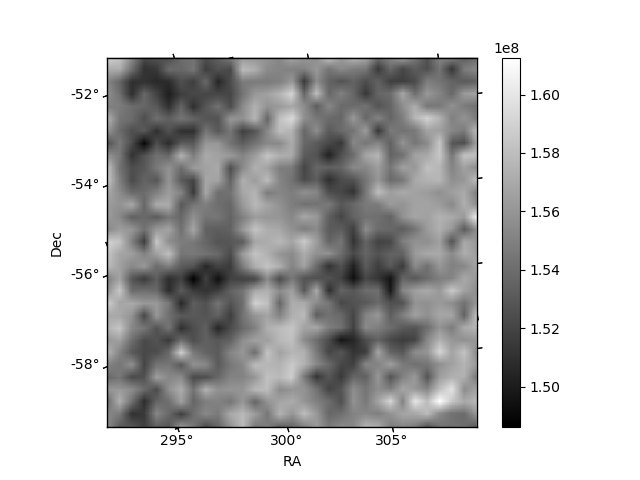
| Quadrant D | 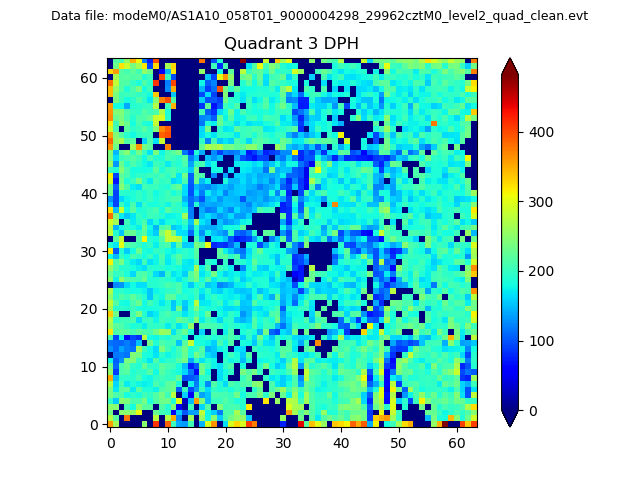 |
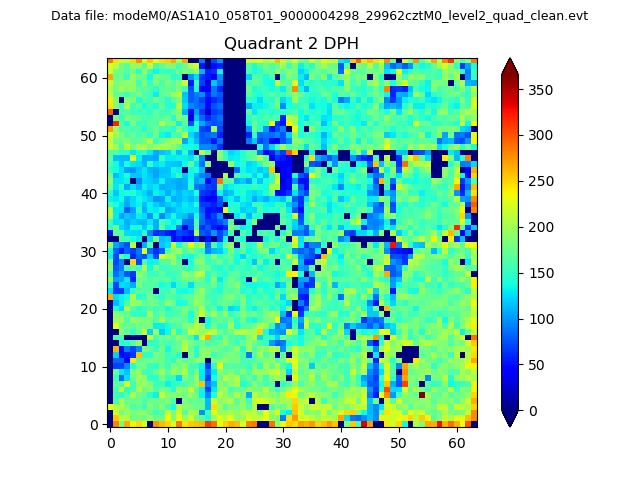 |
Quadrant C |
| Plot type | Count rate plots | Images |
|---|---|---|
| Comparison with Poisson distribution Blue bars denote a histogram of data divided into 1 sec bins. Red curve is a Poisson curve with rate = median count rate of data. |
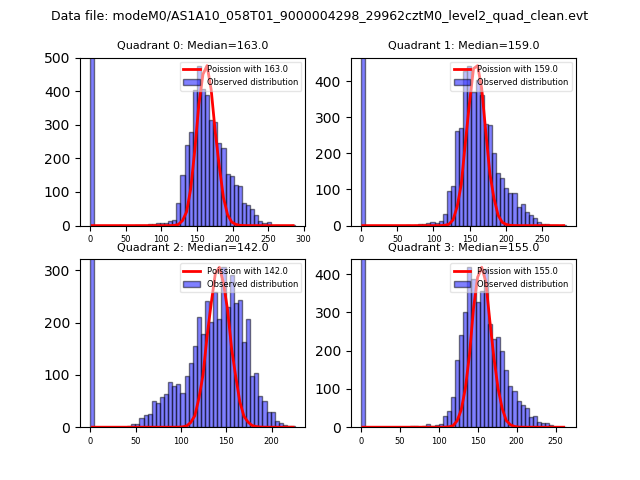 |
 |
| Quadrant-wise count rates Data is divided into 100 sec bins |
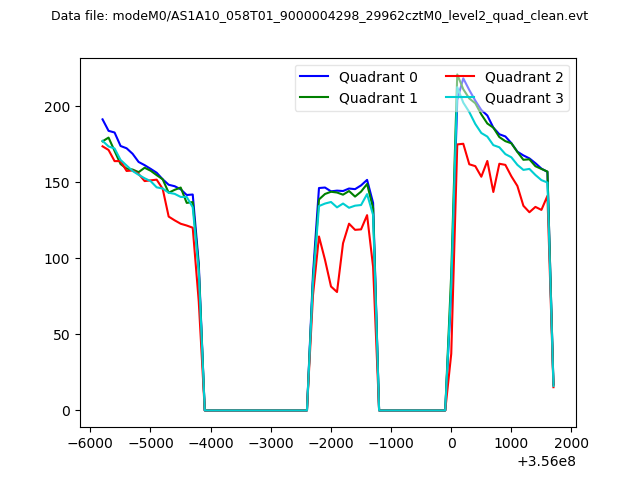 |
|
| Module-wise count rates for Quadrant A Data is divided into 100 sec bins |
 |
 |
| Module-wise count rates for Quadrant B Data is divided into 100 sec bins |
 |
 |
| Module-wise count rates for Quadrant C Data is divided into 100 sec bins |
 |
 |
| Module-wise count rates for Quadrant D Data is divided into 100 sec bins |
 |
 |
| Parameter | Plot |
|---|---|
| CZT HV Monitor | 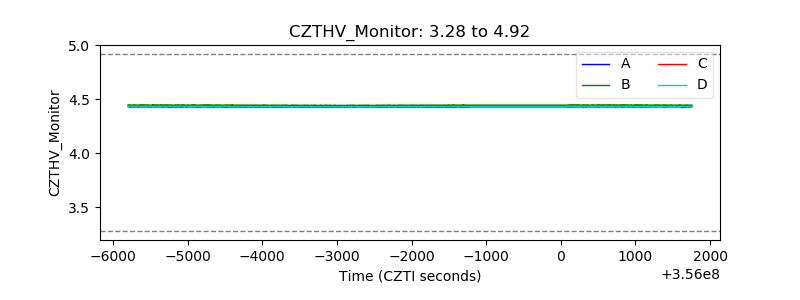 |
| D_VDD |  |
| Temperature 1 |  |
| Veto HV Monitor | 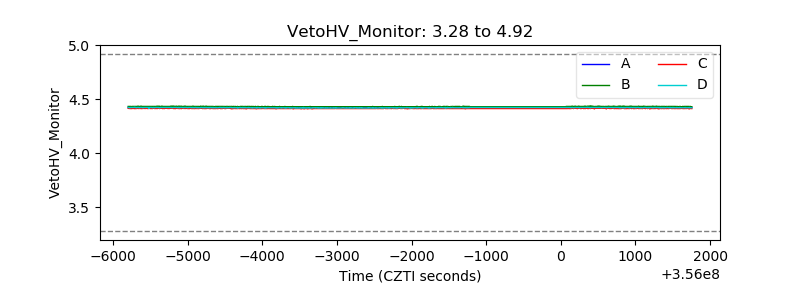 |
| Veto LLD |  |
| Alpha Counter | 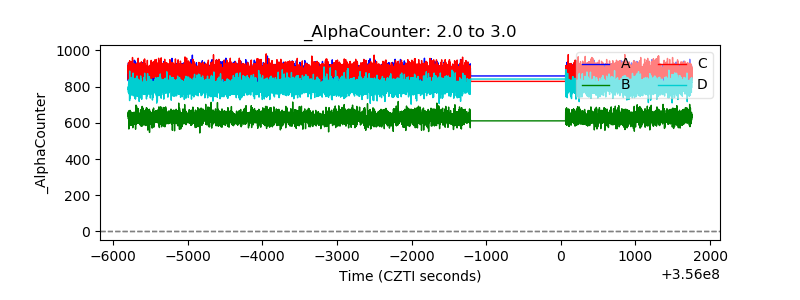 |
| _CPM_Rate | 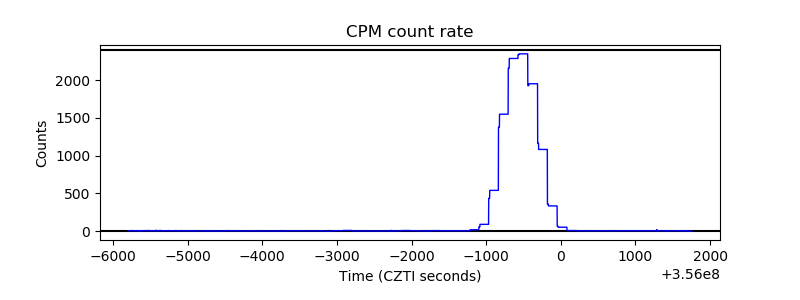 |
| CZT Counter | 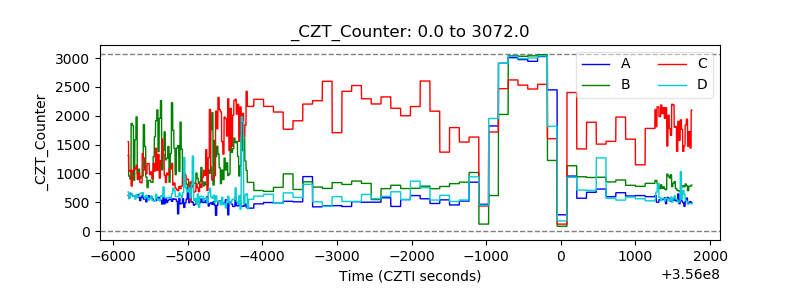 |
| +2.5 Volts monitor |  |
| +5 Volts monitor |  |
| _ROLL_ROT | 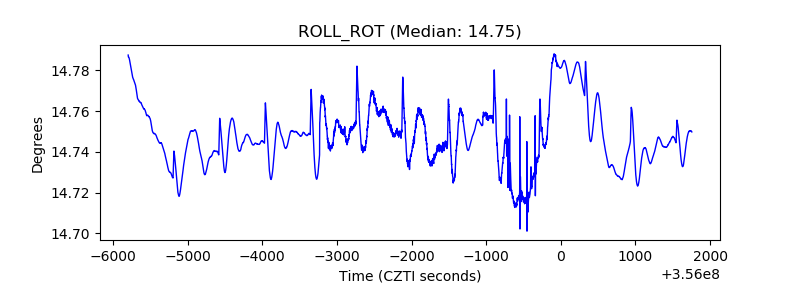 |
| _Roll_DEC | 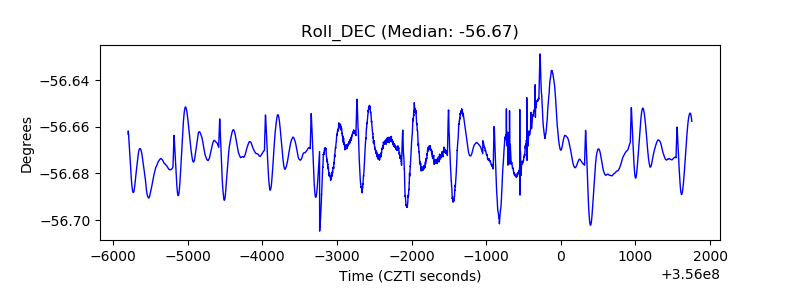 |
| _Roll_RA | 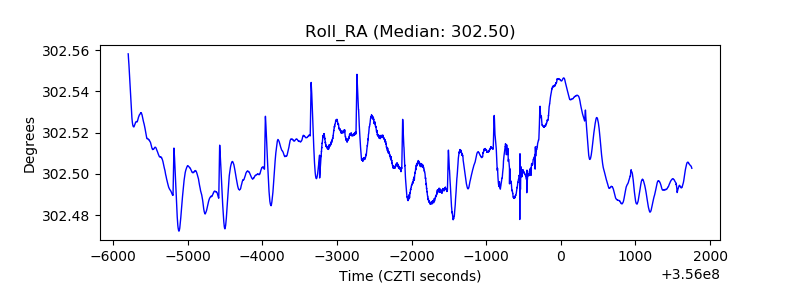 |
| Veto Counter | 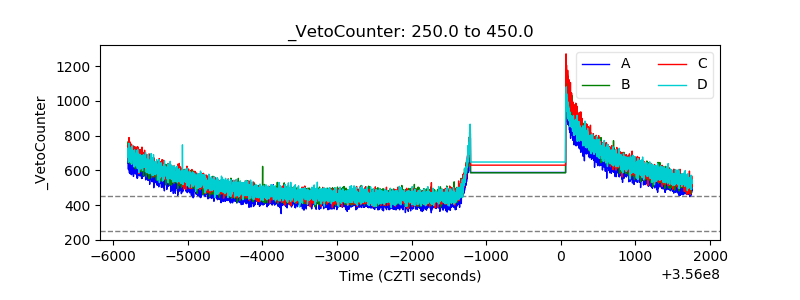 |