| Param | Original file | Final file |
|---|---|---|
| Filename | modeM0/AS1A10_058T01_9000004298_29965cztM0_level2.evt | modeM0/AS1A10_058T01_9000004298_29965cztM0_level2_quad_clean.evt |
| Size (bytes) | 642,628,800 | 89,271,360 |
| Size | 612.9 MB | 85.1 MB |
| Events in quadrant A | 3,514,094 | 582,379 |
| Events in quadrant B | 5,379,496 | 574,832 |
| Events in quadrant C | 5,775,490 | 537,303 |
| Events in quadrant D | 4,340,656 | 542,065 |
| Mode M9 | |||
|---|---|---|---|
| Quadrant | BADHDUFLAG | Total packets | Discarded packets |
| A | 0 | 12 | 0 |
| B | 0 | 13 | 0 |
| C | 0 | 13 | 0 |
| D | 0 | 13 | 0 |
| Mode M0 | |||
|---|---|---|---|
| Quadrant | BADHDUFLAG | Total packets | Discarded packets |
| A | 0 | 14360 | 2 |
| B | 0 | 20434 | 2 |
| C | 0 | 21872 | 2 |
| D | 0 | 17201 | 2 |
| Mode SS | |||
|---|---|---|---|
| Quadrant | BADHDUFLAG | Total packets | Discarded packets |
| A | 0 | 138 | 0 |
| B | 0 | 138 | 0 |
| C | 0 | 138 | 0 |
| D | 0 | 138 | 0 |
| Quadrant | Total seconds | Saturated seconds | Saturation percentage |
|---|---|---|---|
| A | 6694 | 125 | 1.867344% |
| B | 6693 | 194 | 2.898551% |
| C | 6693 | 577 | 8.620947% |
| D | 6693 | 236 | 3.526072% |
Noise dominated data is calculated using 1-second bins in cleaned event files. If a bin has >2000 counts, and if more than 50% of those come from <1% of pixels, then it is considered to be noise-dominated and hence unusable.
| Quadrant | # 1 sec bins | Bins with >0 counts | Bins with >2000 counts | High rate bins dominated by noise | Noise dominated (total time) | Noise dominated (detector-on time) | Marked lightcurve |
|---|---|---|---|---|---|---|---|
| A | 7824 | 6696 | 1 | 1 | 0.01% | 0.01% | 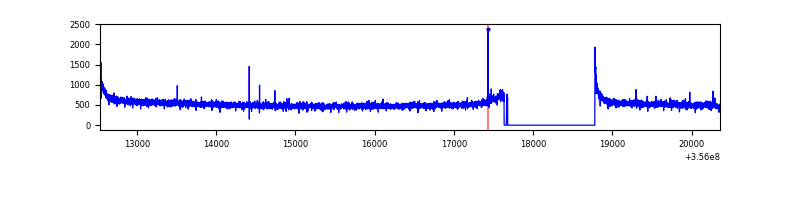 |
| B | 7823 | 6695 | 3 | 3 | 0.04% | 0.04% | 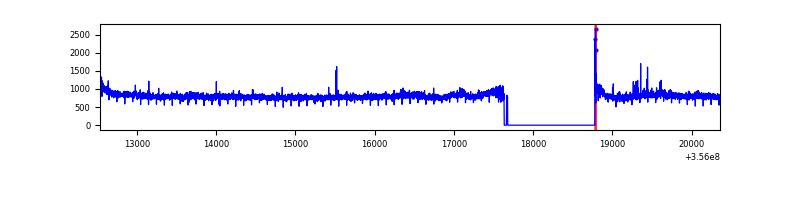 |
| C | 7823 | 6695 | 229 | 229 | 2.93% | 3.42% | 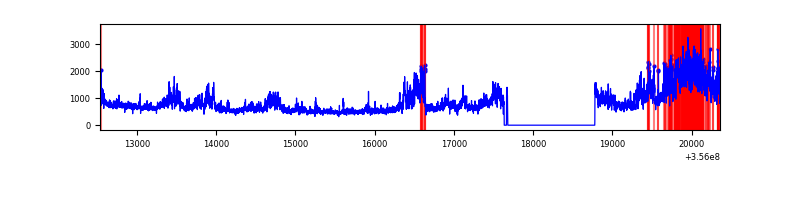 |
| D | 7823 | 6695 | 116 | 116 | 1.48% | 1.73% | 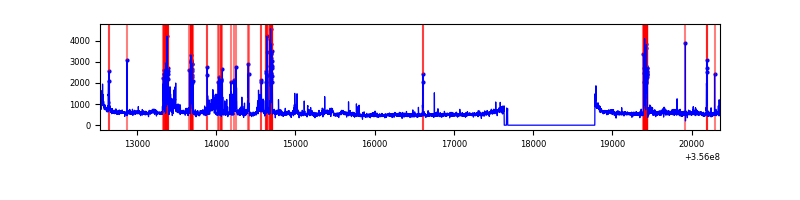 |
Top three noisy pixels from each quadrant. If the there are fewer than three noisy pixels in the level2.evt file, extra rows are filled as -1
| Pixel properties | Quadrant properties | ||||||
|---|---|---|---|---|---|---|---|
| Quadrant | DetID | PixID | Counts | Sigma | Mean | Median | Sigma |
| A | 8 | 192 | 21861 | 117.87 | 901 | 884 | 178.0 |
| A | 13 | 254 | 13059 | 68.41 | 901 | 884 | 178.0 |
| A | 12 | 96 | 12327 | 64.3 | 901 | 884 | 178.0 |
| B | 6 | 159 | 1877293 | 11348.61 | 878 | 855 | 165.3 |
| B | 6 | 36 | 49696 | 295.39 | 878 | 855 | 165.3 |
| B | 12 | 111 | 19237 | 111.17 | 878 | 855 | 165.3 |
| C | 3 | 233 | 2364489 | 12324.68 | 834 | 841 | 191.8 |
| C | 14 | 238 | 137898 | 714.65 | 834 | 841 | 191.8 |
| C | 2 | 114 | 15958 | 78.82 | 834 | 841 | 191.8 |
| D | 12 | 233 | 537712 | 2699.9 | 862 | 840 | 198.8 |
| D | 8 | 195 | 336279 | 1686.9 | 862 | 840 | 198.8 |
| D | 7 | 80 | 150069 | 750.46 | 862 | 840 | 198.8 |
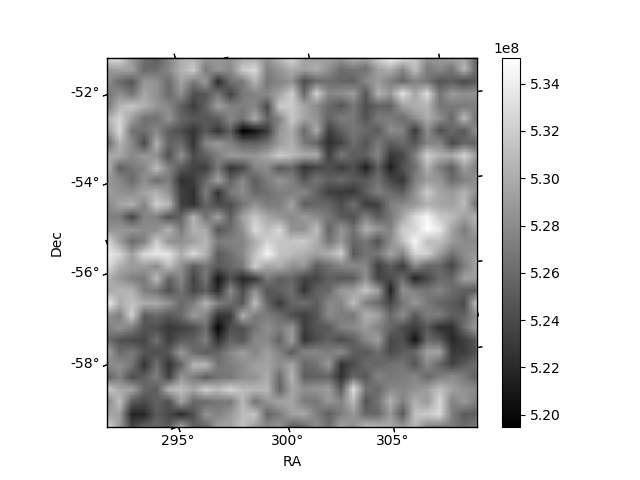
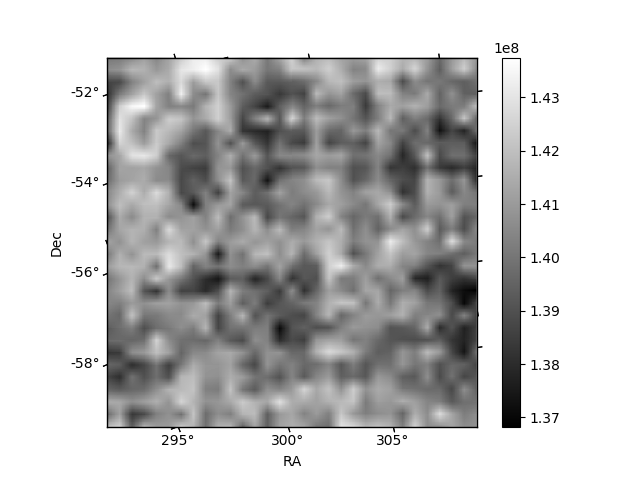
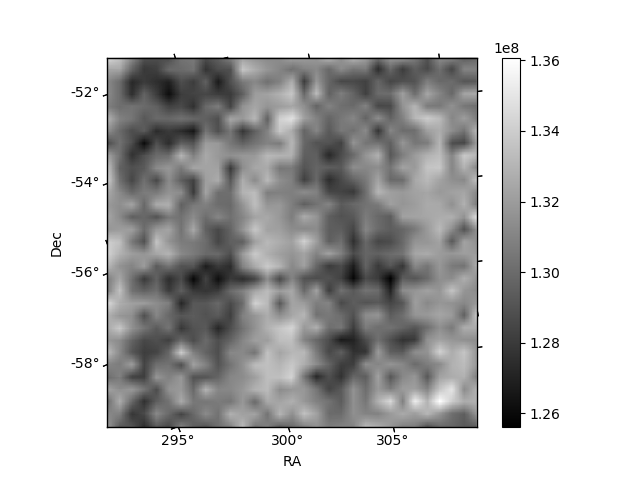
Histogram calculated using DETX and DETY for each event in the final _common_clean file
| Quadrant A | 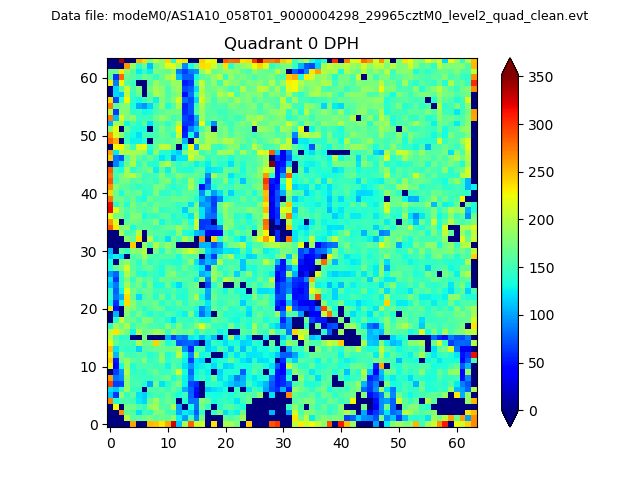 |
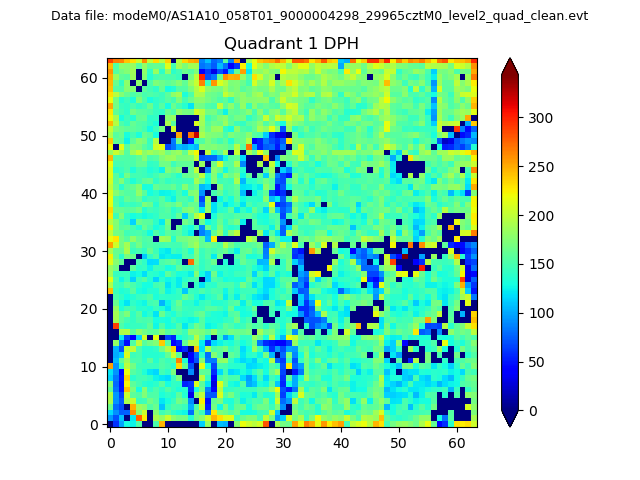 |
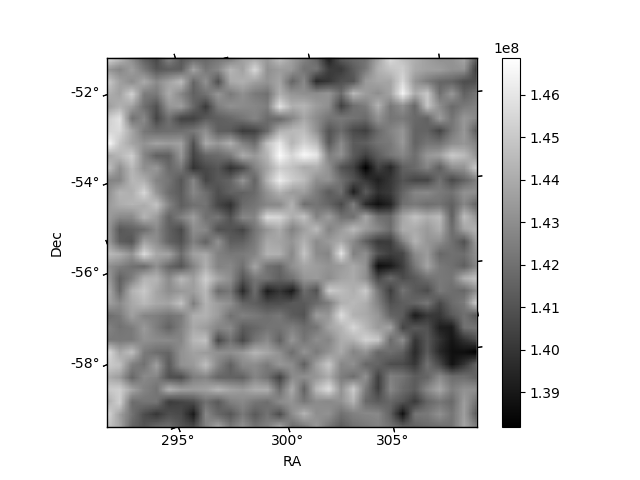
Quadrant B |
|---|---|---|---|
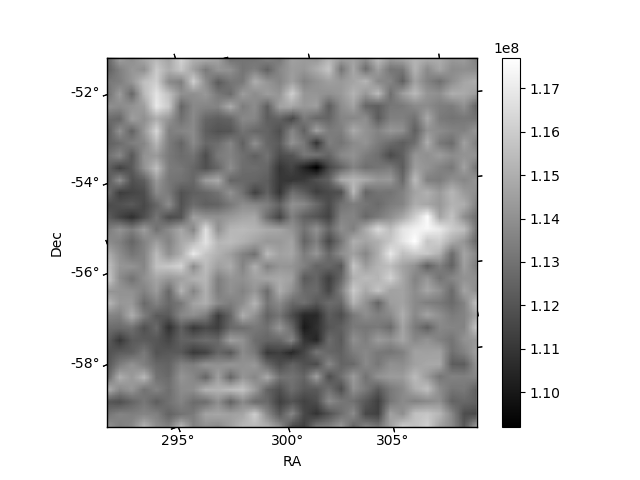
| Quadrant D | 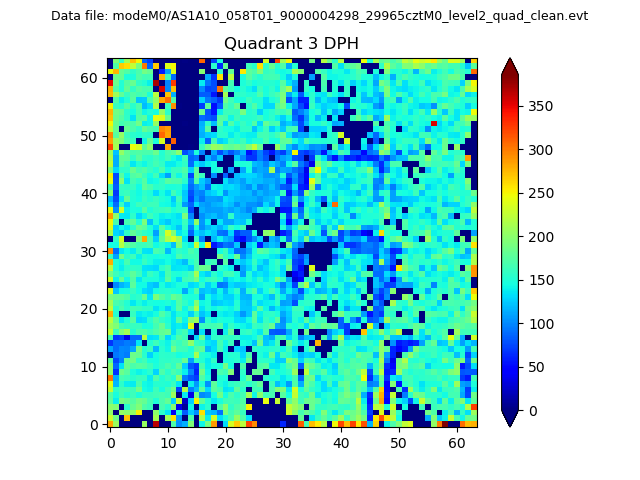 |
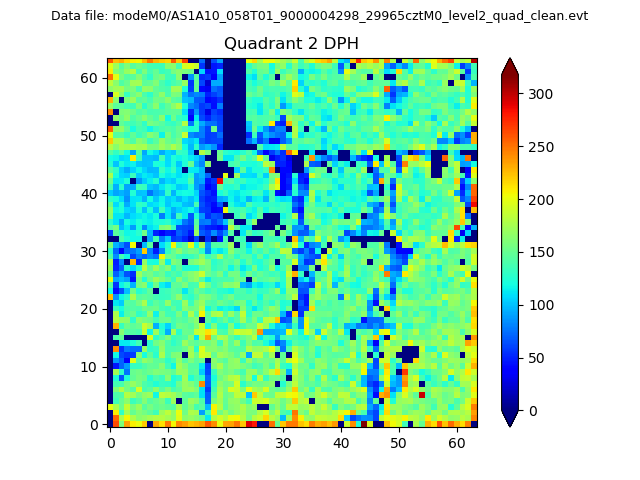 |
Quadrant C |
| Plot type | Count rate plots | Images |
|---|---|---|
| Comparison with Poisson distribution Blue bars denote a histogram of data divided into 1 sec bins. Red curve is a Poisson curve with rate = median count rate of data. |
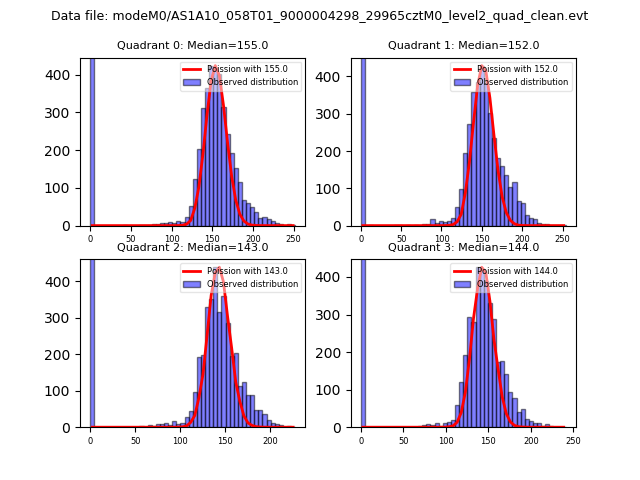 |
 |
| Quadrant-wise count rates Data is divided into 100 sec bins |
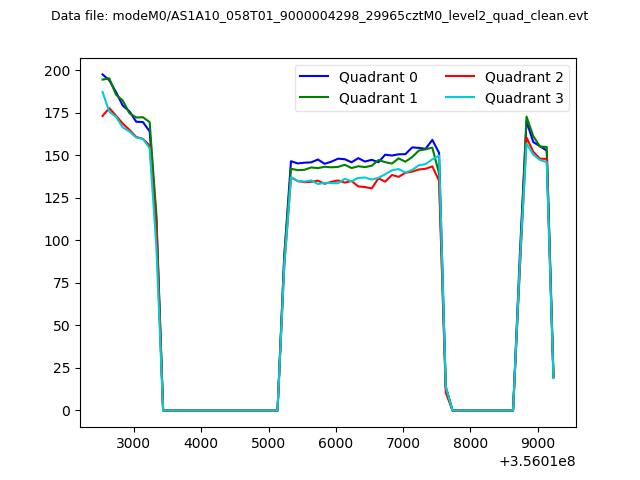 |
|
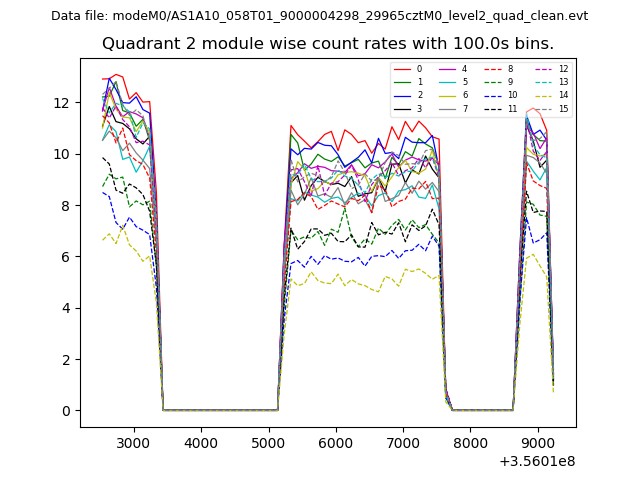
| Module-wise count rates for Quadrant A Data is divided into 100 sec bins |
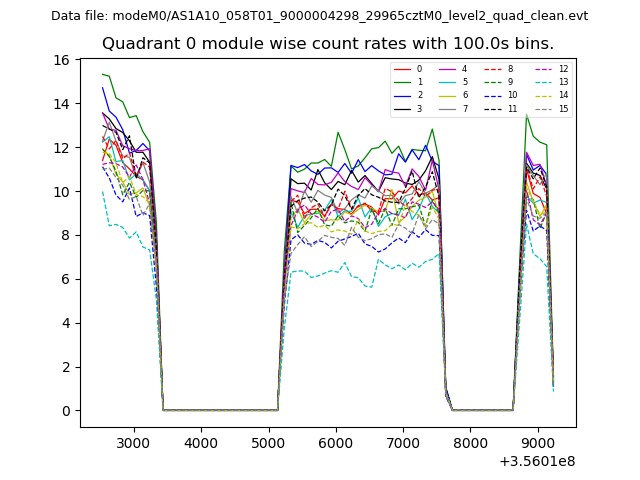 |
 |
| Module-wise count rates for Quadrant B Data is divided into 100 sec bins |
 |
 |
| Module-wise count rates for Quadrant C Data is divided into 100 sec bins |
 |
 |
| Module-wise count rates for Quadrant D Data is divided into 100 sec bins |
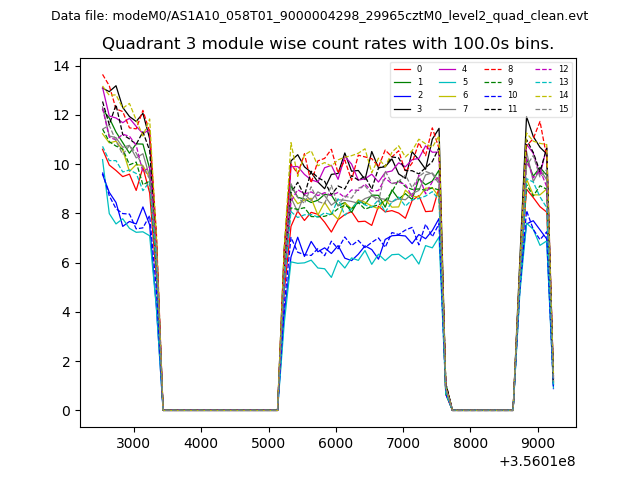 |
 |
| Parameter | Plot |
|---|---|
| CZT HV Monitor | 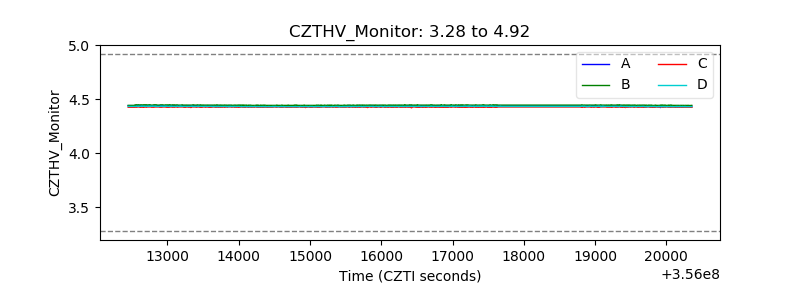 |
| D_VDD | 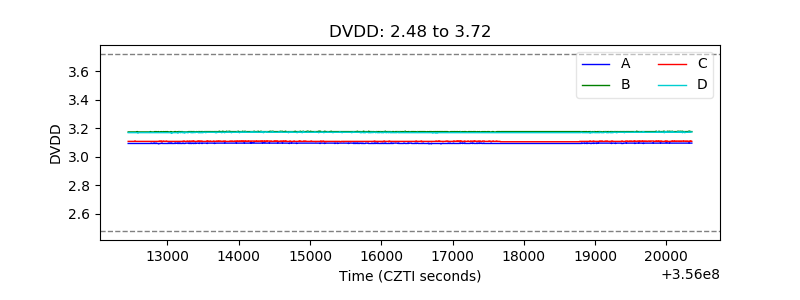 |
| Temperature 1 | 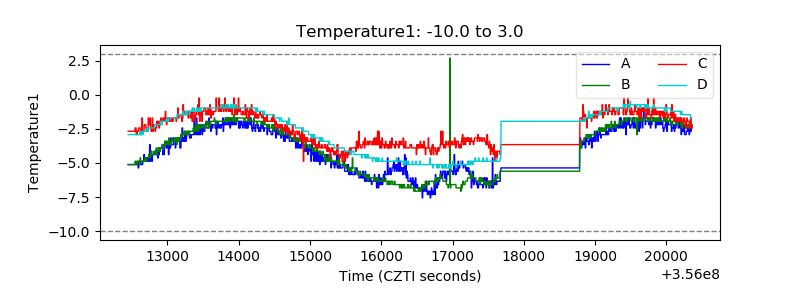 |
| Veto HV Monitor | 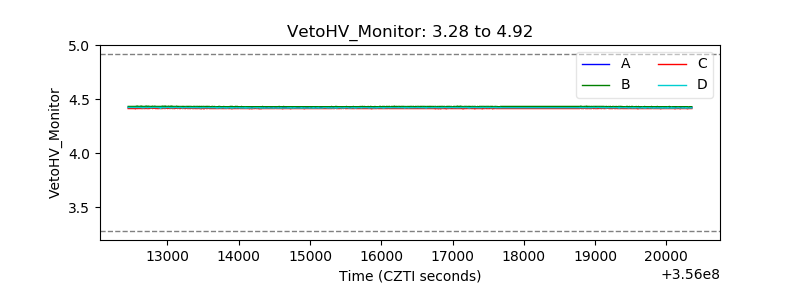 |
| Veto LLD | 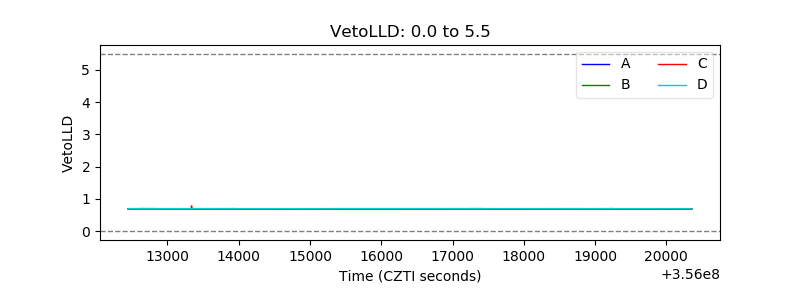 |
| Alpha Counter | 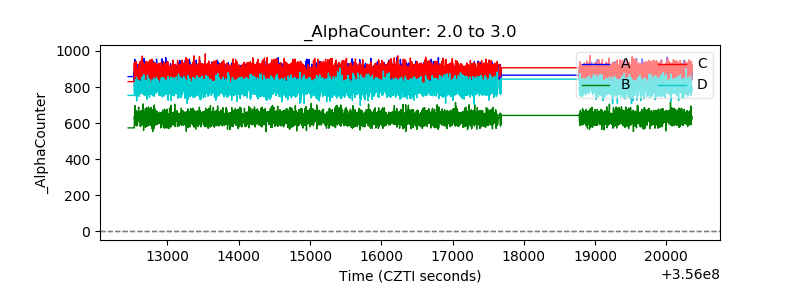 |
| _CPM_Rate | 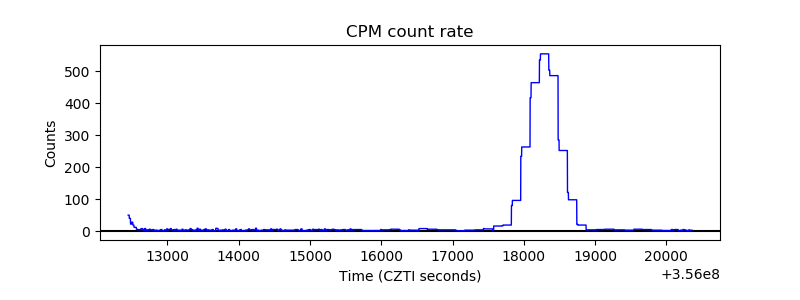 |
| CZT Counter | 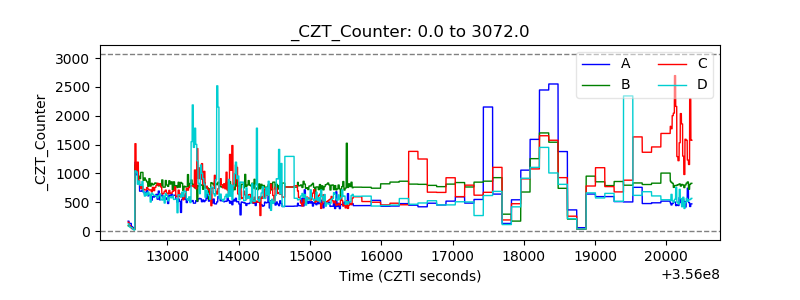 |
| +2.5 Volts monitor | 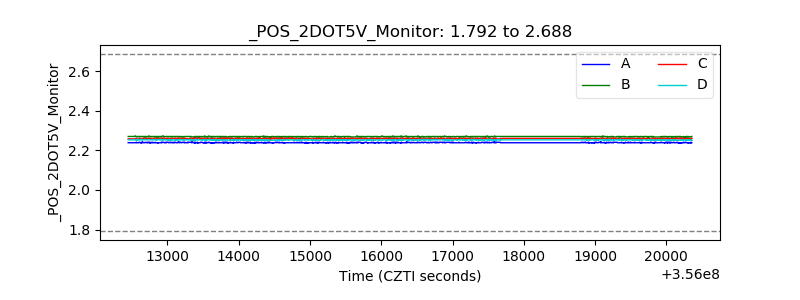 |
| +5 Volts monitor | 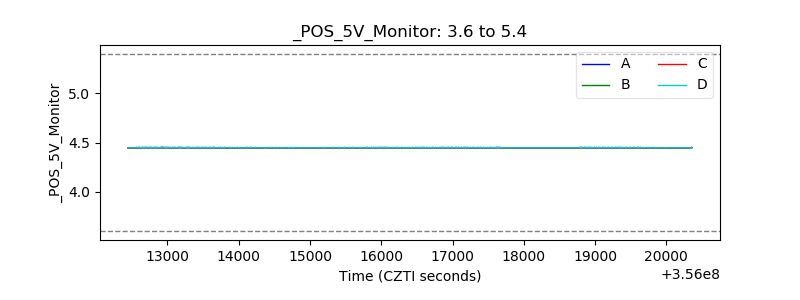 |
| _ROLL_ROT | 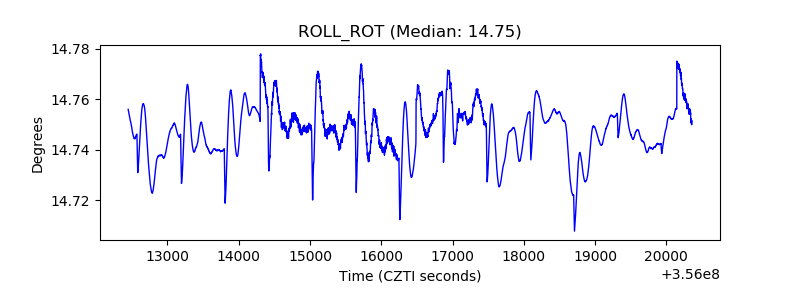 |
| _Roll_DEC | 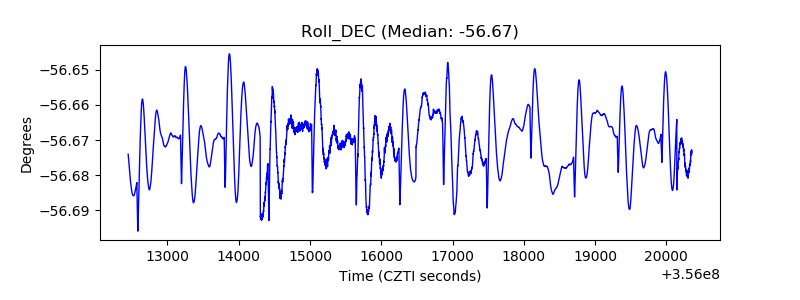 |
| _Roll_RA | 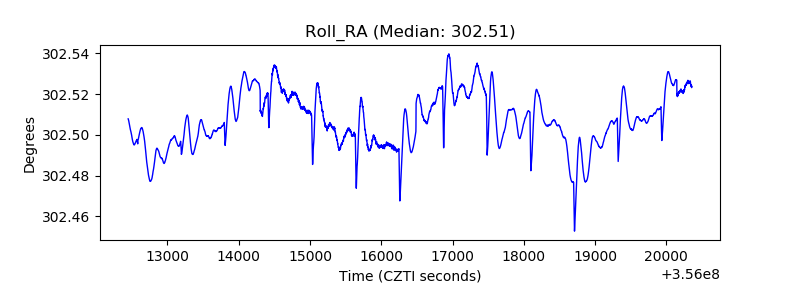 |
| Veto Counter | 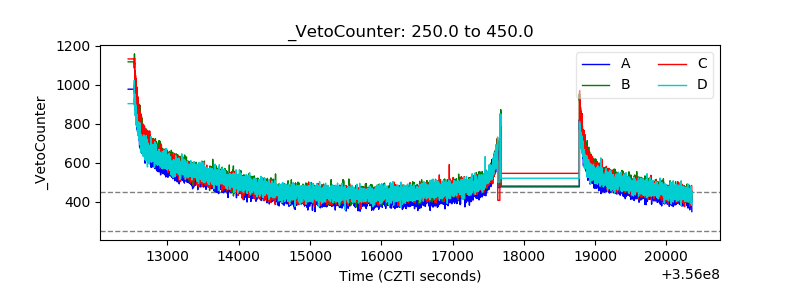 |