| Param | Original file | Final file |
|---|---|---|
| Filename | modeM0/AS1A10_058T01_9000004298_29967cztM0_level2.evt | modeM0/AS1A10_058T01_9000004298_29967cztM0_level2_quad_clean.evt |
| Size (bytes) | 298,949,760 | 16,056,000 |
| Size | 285.1 MB | 15.3 MB |
| Events in quadrant A | 1,170,093 | 85,813 |
| Events in quadrant B | 2,155,838 | 79,832 |
| Events in quadrant C | 4,243,636 | 60,484 |
| Events in quadrant D | 1,313,701 | 79,847 |
| Mode M0 | |||
|---|---|---|---|
| Quadrant | BADHDUFLAG | Total packets | Discarded packets |
| A | 0 | 5059 | 0 |
| B | 0 | 8153 | 0 |
| C | 0 | 14338 | 0 |
| D | 0 | 5435 | 0 |
| Mode SS | |||
|---|---|---|---|
| Quadrant | BADHDUFLAG | Total packets | Discarded packets |
| A | 0 | 50 | 0 |
| B | 0 | 50 | 0 |
| C | 0 | 50 | 0 |
| D | 0 | 50 | 0 |
| Quadrant | Total seconds | Saturated seconds | Saturation percentage |
|---|---|---|---|
| A | 2493 | 3 | 0.120337% |
| B | 2494 | 111 | 4.450682% |
| C | 2494 | 1010 | 40.497193% |
| D | 2494 | 27 | 1.082598% |
Noise dominated data is calculated using 1-second bins in cleaned event files. If a bin has >2000 counts, and if more than 50% of those come from <1% of pixels, then it is considered to be noise-dominated and hence unusable.
| Quadrant | # 1 sec bins | Bins with >0 counts | Bins with >2000 counts | High rate bins dominated by noise | Noise dominated (total time) | Noise dominated (detector-on time) | Marked lightcurve |
|---|---|---|---|---|---|---|---|
| A | 2493 | 2493 | 0 | 0 | 0.00% | 0.00% | 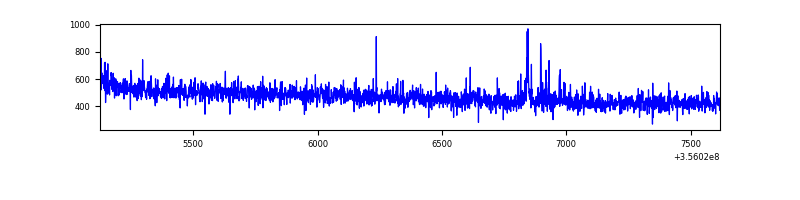 |
| B | 2494 | 2494 | 60 | 60 | 2.41% | 2.41% | 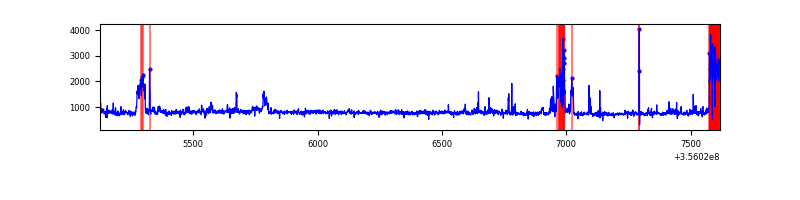 |
| C | 2494 | 2494 | 778 | 778 | 31.19% | 31.19% | 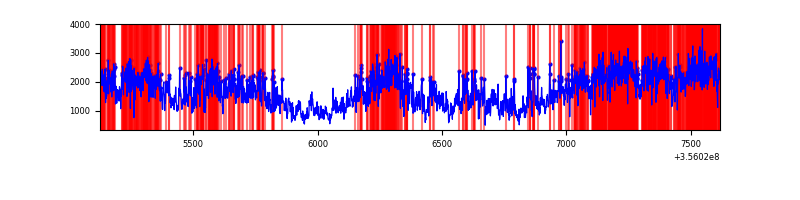 |
| D | 2494 | 2494 | 18 | 18 | 0.72% | 0.72% | 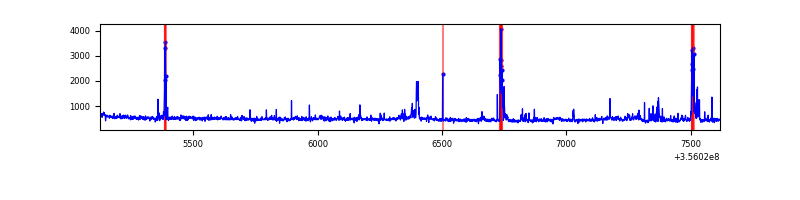 |
Top three noisy pixels from each quadrant. If the there are fewer than three noisy pixels in the level2.evt file, extra rows are filled as -1
| Pixel properties | Quadrant properties | ||||||
|---|---|---|---|---|---|---|---|
| Quadrant | DetID | PixID | Counts | Sigma | Mean | Median | Sigma |
| A | 12 | 96 | 19218 | 311.86 | 298 | 292 | 60.7 |
| A | 13 | 254 | 4689 | 72.45 | 298 | 292 | 60.7 |
| A | 3 | 137 | 2872 | 42.51 | 298 | 292 | 60.7 |
| B | 6 | 159 | 701776 | 12493.53 | 288 | 281 | 56.1 |
| B | 6 | 36 | 295757 | 5262.39 | 288 | 281 | 56.1 |
| B | 4 | 67 | 6776 | 115.68 | 288 | 281 | 56.1 |
| C | 3 | 233 | 3215809 | 53831.59 | 251 | 252 | 59.7 |
| C | 14 | 238 | 41001 | 682.18 | 251 | 252 | 59.7 |
| C | 2 | 114 | 5295 | 84.42 | 251 | 252 | 59.7 |
| D | 12 | 233 | 98735 | 1438.2 | 283 | 275 | 68.5 |
| D | 8 | 195 | 92469 | 1346.67 | 283 | 275 | 68.5 |
| D | 7 | 80 | 33404 | 483.91 | 283 | 275 | 68.5 |
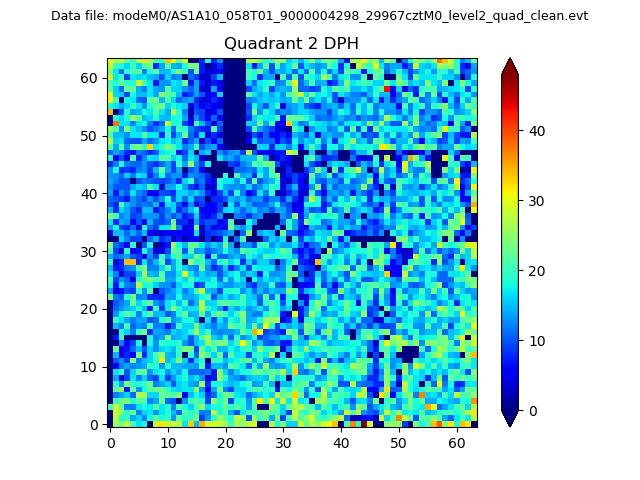
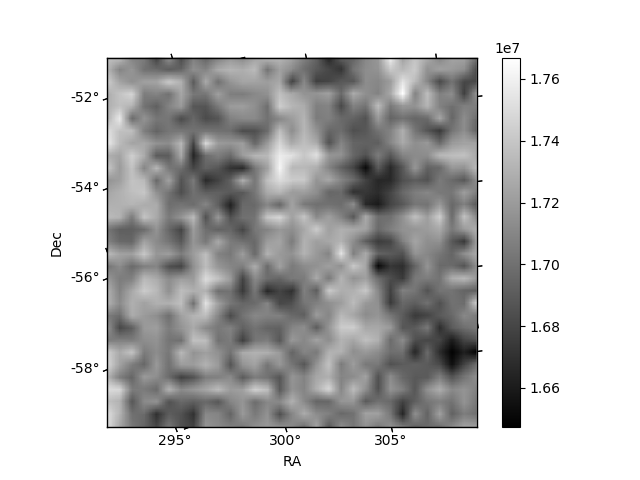
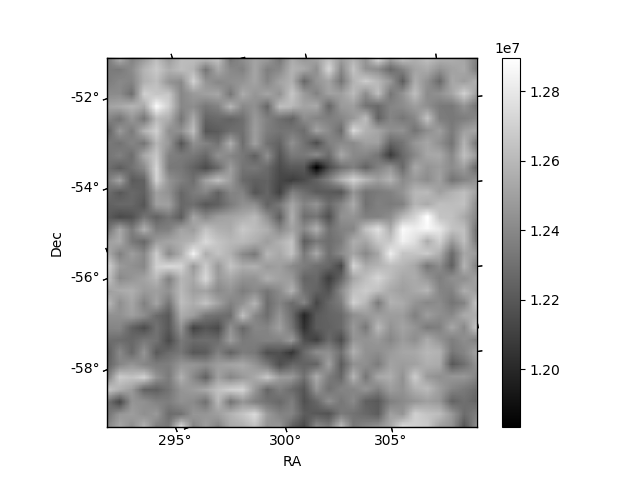
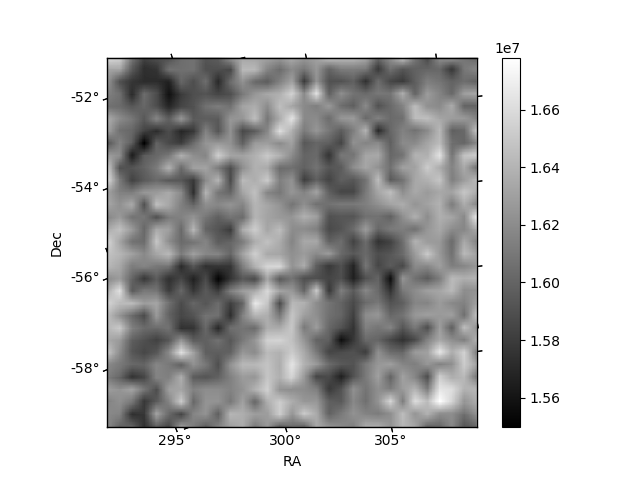
Histogram calculated using DETX and DETY for each event in the final _common_clean file
| Quadrant A | 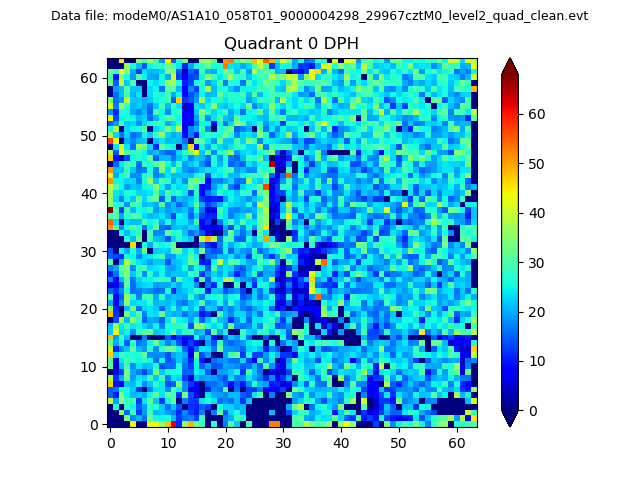 |
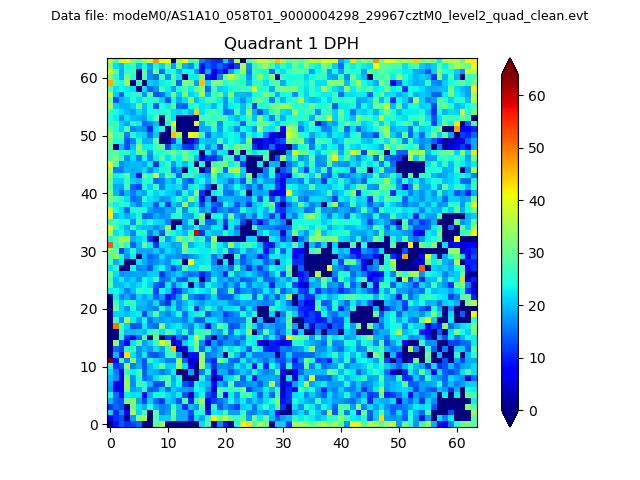 |
Quadrant B |
|---|---|---|---|
| Quadrant D | 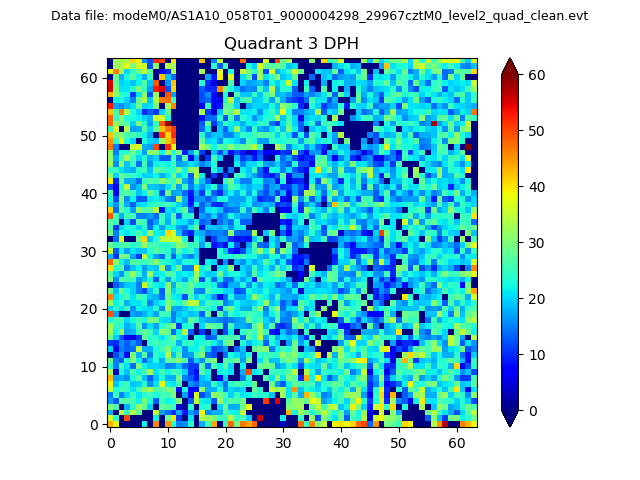 |
 |
Quadrant C |
| Plot type | Count rate plots | Images |
|---|---|---|
| Comparison with Poisson distribution Blue bars denote a histogram of data divided into 1 sec bins. Red curve is a Poisson curve with rate = median count rate of data. |
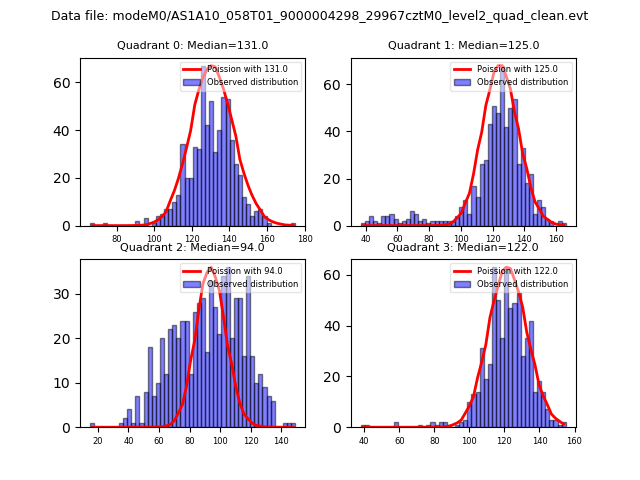 |
 |
| Quadrant-wise count rates Data is divided into 100 sec bins |
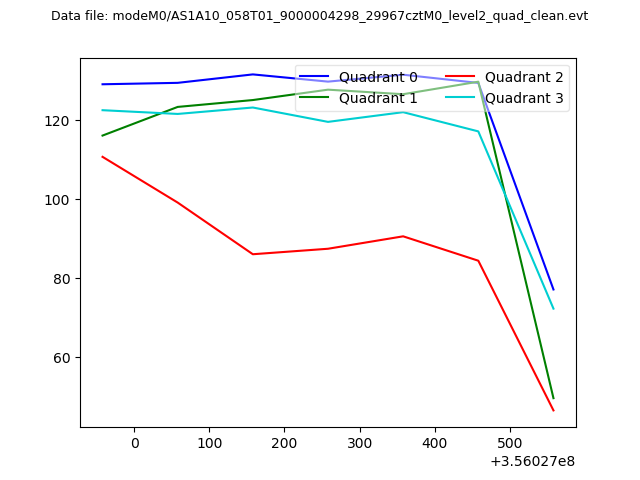 |
|
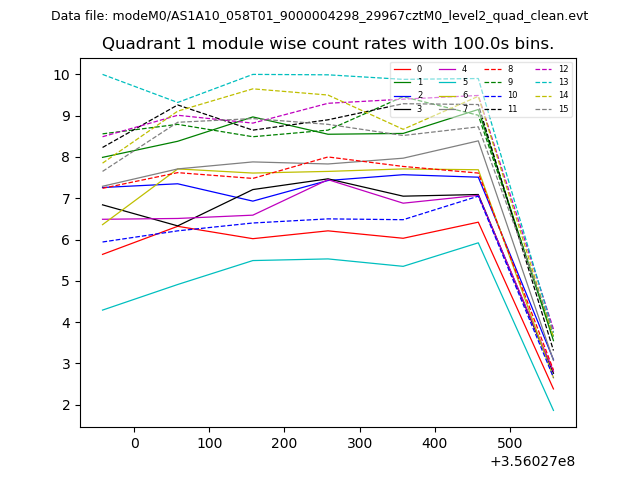
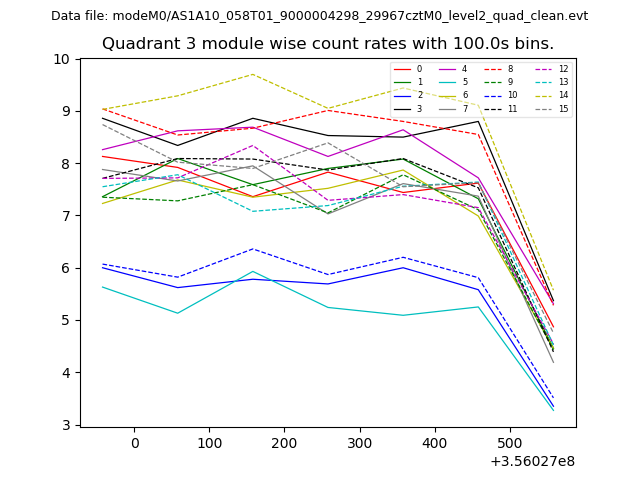
| Module-wise count rates for Quadrant A Data is divided into 100 sec bins |
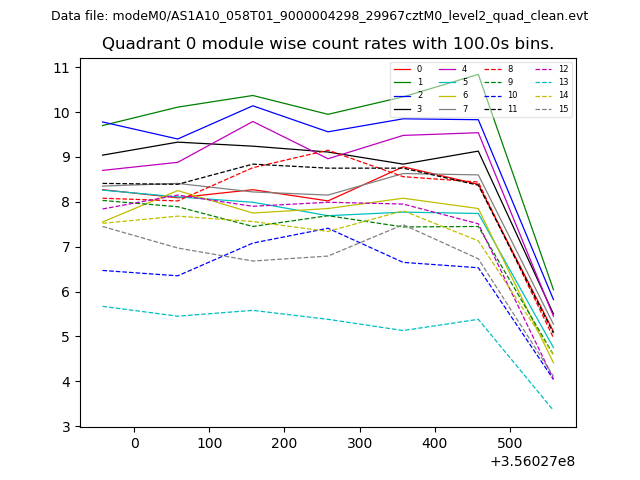 |
 |
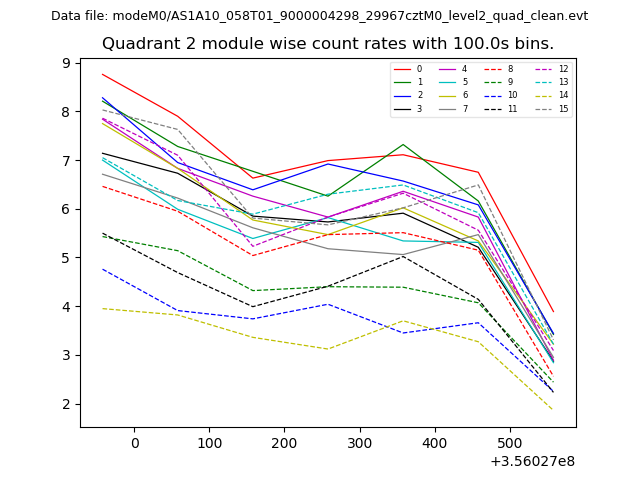
| Module-wise count rates for Quadrant B Data is divided into 100 sec bins |
 |
 |
| Module-wise count rates for Quadrant C Data is divided into 100 sec bins |
 |
 |
| Module-wise count rates for Quadrant D Data is divided into 100 sec bins |
 |
 |
| Parameter | Plot |
|---|---|
| CZT HV Monitor | 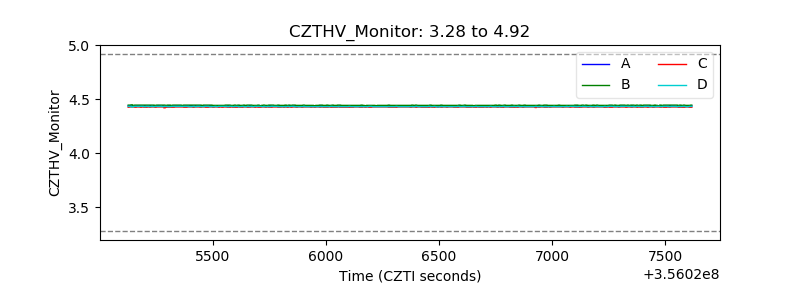 |
| D_VDD | 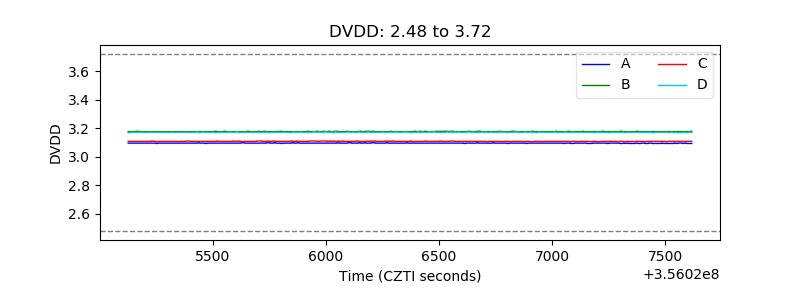 |
| Temperature 1 |  |
| Veto HV Monitor | 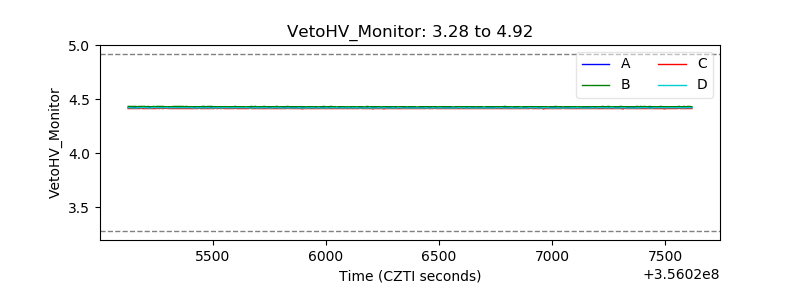 |
| Veto LLD | 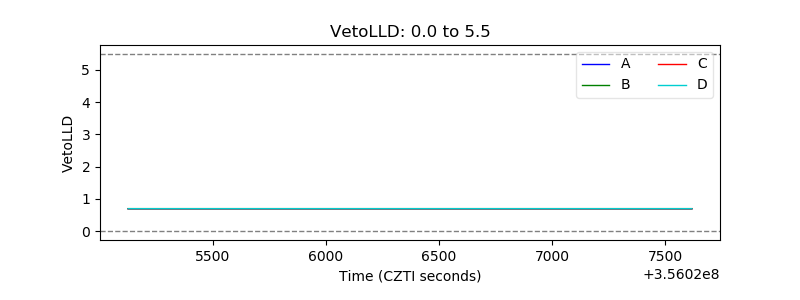 |
| Alpha Counter | 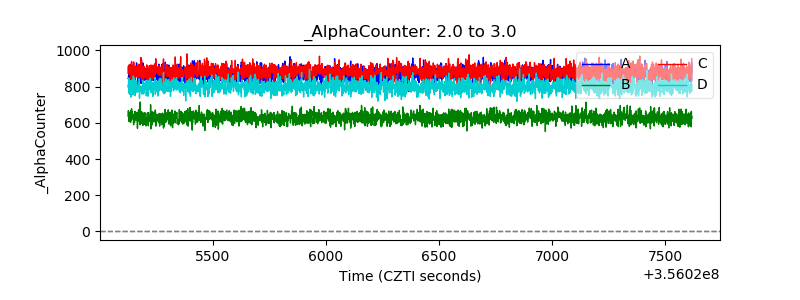 |
| _CPM_Rate | 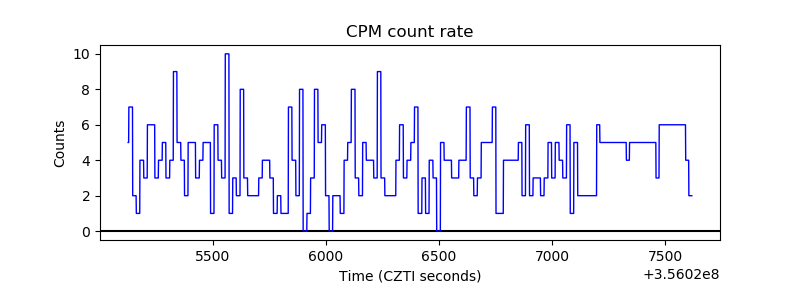 |
| CZT Counter |  |
| +2.5 Volts monitor |  |
| +5 Volts monitor |  |
| _ROLL_ROT | 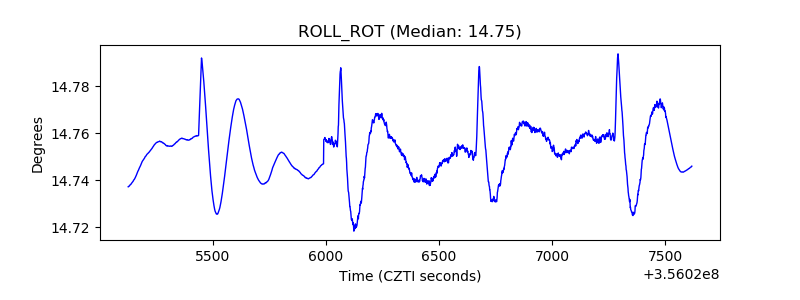 |
| _Roll_DEC | 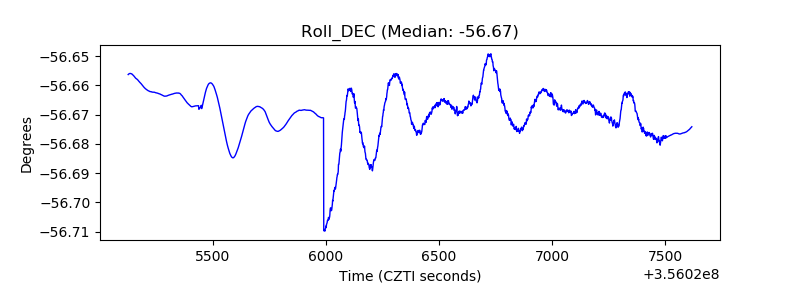 |
| _Roll_RA |  |
| Veto Counter | 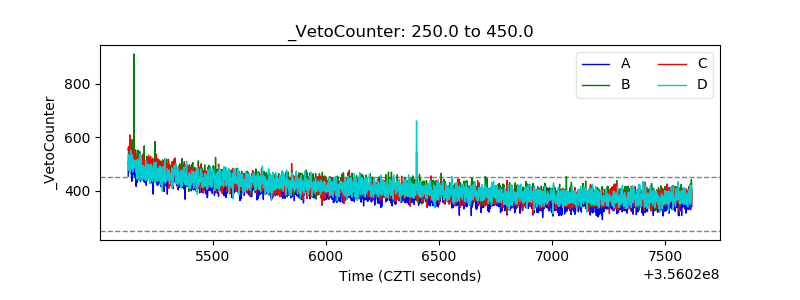 |