| Param | Original file | Final file |
|---|---|---|
| Filename | modeM0/AS1A10_053T06_9000004300cztM0_level2.fits | modeM0/AS1A10_053T06_9000004300cztM0_level2_quad_clean.evt |
| Size (bytes) | 257,397,120 | 280,609,920 |
| Size | 245.5 MB | 267.6 MB |
| Events in quadrant A | 1,592,088 | 1,767,287 |
| Events in quadrant B | 1,487,046 | 1,716,163 |
| Events in quadrant C | 1,491,408 | 1,611,082 |
| Events in quadrant D | 1,358,720 | 1,538,679 |
| Mode M0 | |||
|---|---|---|---|
| Quadrant | BADHDUFLAG | Total packets | Discarded packets |
| A | 0 | 56441 | 0 |
| B | 0 | 84717 | 0 |
| C | 0 | 81226 | 0 |
| D | 0 | 65205 | 0 |
| Mode M9 | |||
|---|---|---|---|
| Quadrant | BADHDUFLAG | Total packets | Discarded packets |
| A | 0 | 23 | 0 |
| B | 0 | 23 | 0 |
| C | 0 | 23 | 0 |
| D | 0 | 23 | 0 |
| Mode SS | |||
|---|---|---|---|
| Quadrant | BADHDUFLAG | Total packets | Discarded packets |
| A | 0 | 552 | 0 |
| B | 0 | 552 | 0 |
| C | 0 | 552 | 0 |
| D | 0 | 552 | 0 |
| Quadrant | Total seconds | Saturated seconds | Saturation percentage |
|---|---|---|---|
| A | 27121 | 305 | 1.124590% |
| B | 27121 | 663 | 2.444600% |
| C | 27121 | 2190 | 8.074923% |
| D | 27121 | 646 | 2.381918% |
Noise dominated data is calculated using 1-second bins in cleaned event files. If a bin has >2000 counts, and if more than 50% of those come from <1% of pixels, then it is considered to be noise-dominated and hence unusable.
| Quadrant | # 1 sec bins | Bins with >0 counts | Bins with >2000 counts | High rate bins dominated by noise | Noise dominated (total time) | Noise dominated (detector-on time) | Marked lightcurve |
|---|---|---|---|---|---|---|---|
| A | 29396 | 27121 | 0 | 0 | 0.00% | 0.00% |  |
| B | 29396 | 27121 | 0 | 0 | 0.00% | 0.00% | 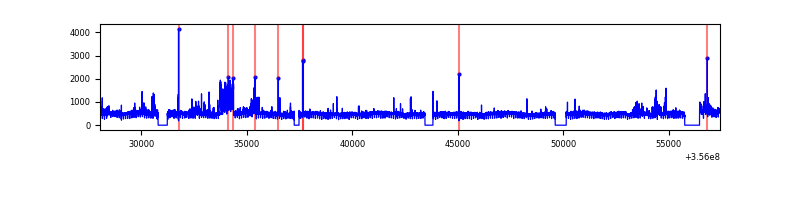 |
| C | 29396 | 27121 | 0 | 0 | 0.00% | 0.00% | 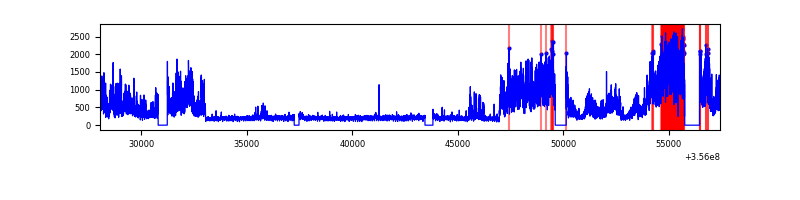 |
| D | 29396 | 27108 | 0 | 0 | 0.00% | 0.00% |  |
Top three noisy pixels from each quadrant. If the there are fewer than three noisy pixels in the level2.evt file, extra rows are filled as -1
| Pixel properties | Quadrant properties | ||||||
|---|---|---|---|---|---|---|---|
| Quadrant | DetID | PixID | Counts | Sigma | Mean | Median | Sigma |
| A | 0 | 29 | 1504 | 11.01 | 414 | 390 | 101.2 |
| A | 7 | 110 | 1252 | 8.52 | 414 | 390 | 101.2 |
| A | 0 | 30 | 1166 | 7.67 | 414 | 390 | 101.2 |
| B | 2 | 9 | 1170 | 9.93 | 393 | 375 | 80.0 |
| B | 3 | 17 | 1003 | 7.85 | 393 | 375 | 80.0 |
| B | 5 | 232 | 969 | 7.42 | 393 | 375 | 80.0 |
| C | 12 | 241 | 1096 | 7.23 | 393 | 369 | 100.6 |
| C | 3 | 126 | 1006 | 6.33 | 393 | 369 | 100.6 |
| C | 9 | 233 | 1000 | 6.27 | 393 | 369 | 100.6 |
| D | 15 | 46 | 1037 | 6.51 | 388 | 353 | 105.1 |
| D | 6 | 231 | 998 | 6.14 | 388 | 353 | 105.1 |
| D | 6 | 38 | 940 | 5.58 | 388 | 353 | 105.1 |
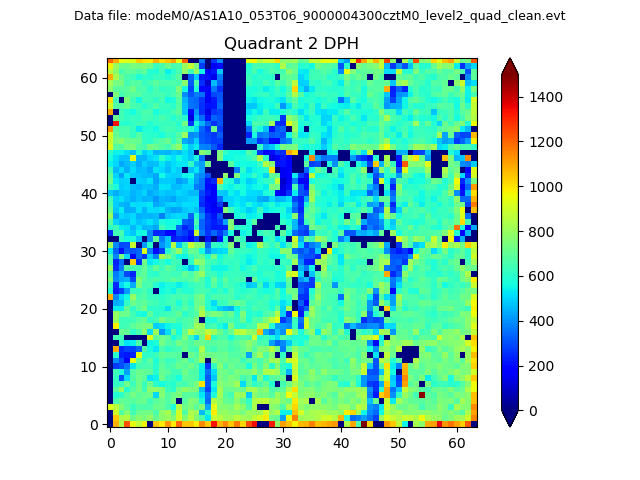
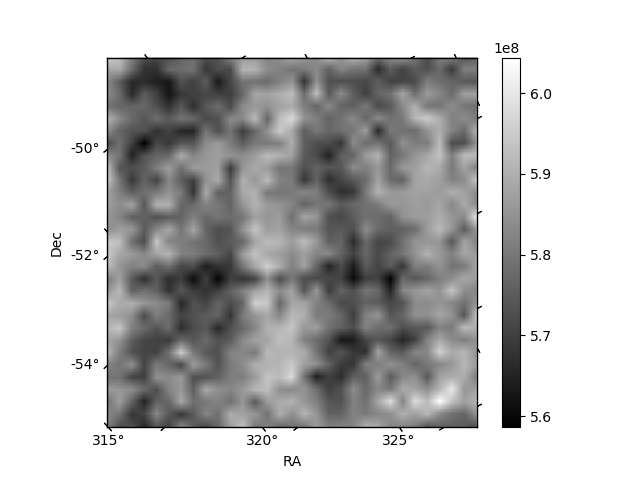
Histogram calculated using DETX and DETY for each event in the final _common_clean file
| Quadrant A | 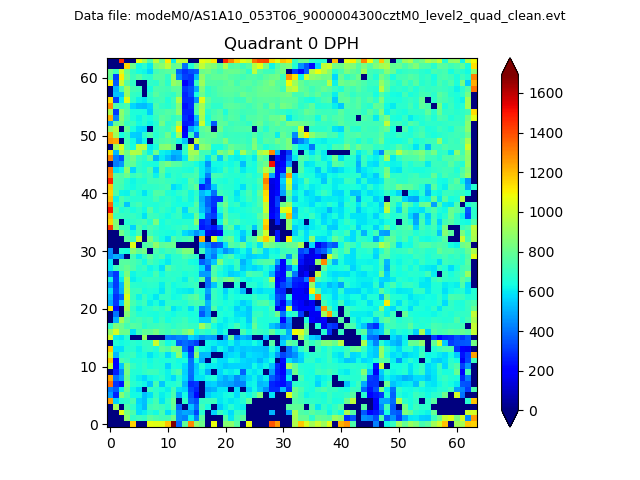 |
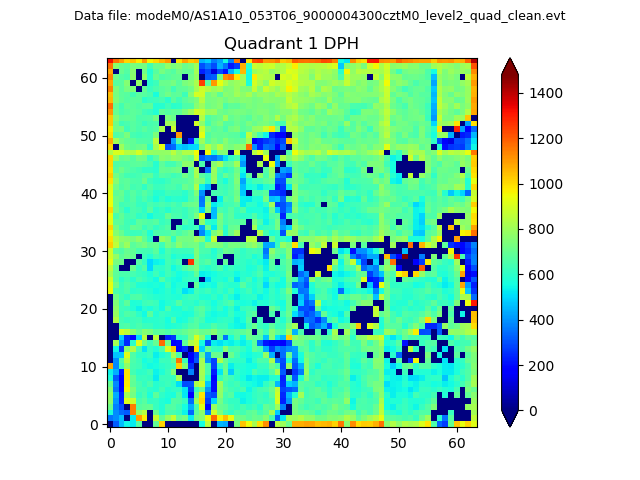 |
Quadrant B |
|---|---|---|---|
| Quadrant D | 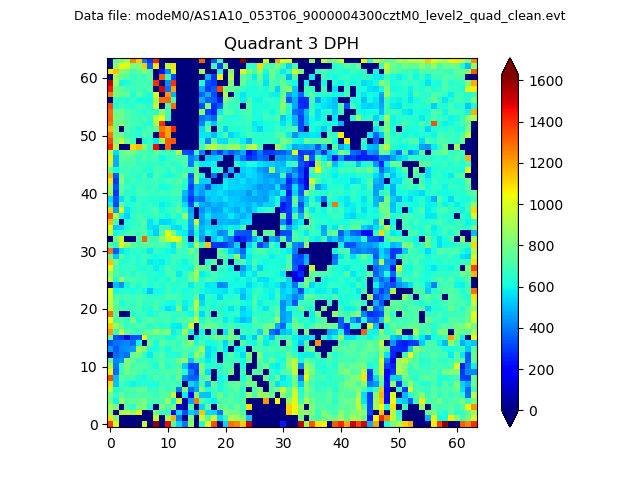 |
 |
Quadrant C |
| Plot type | Count rate plots | Images |
|---|---|---|
| Comparison with Poisson distribution Blue bars denote a histogram of data divided into 1 sec bins. Red curve is a Poisson curve with rate = median count rate of data. |
 |
 |
| Quadrant-wise count rates Data is divided into 100 sec bins |
 |
|
| Module-wise count rates for Quadrant A Data is divided into 100 sec bins |
 |
 |
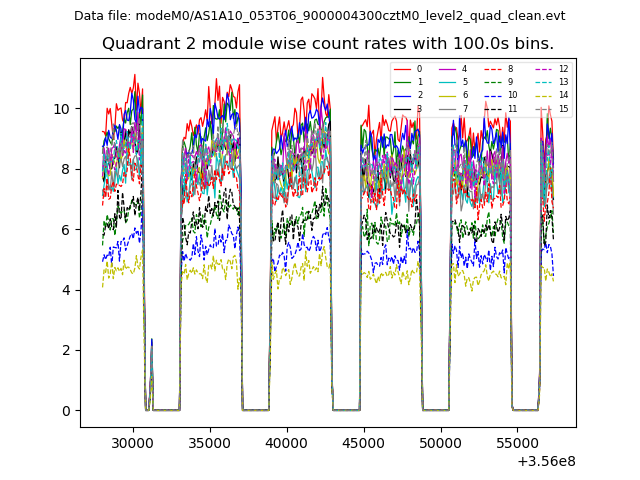
| Module-wise count rates for Quadrant B Data is divided into 100 sec bins |
 |
 |
| Module-wise count rates for Quadrant C Data is divided into 100 sec bins |
 |
 |
| Module-wise count rates for Quadrant D Data is divided into 100 sec bins |
 |
 |
| Parameter | Plot |
|---|---|
| CZT HV Monitor | 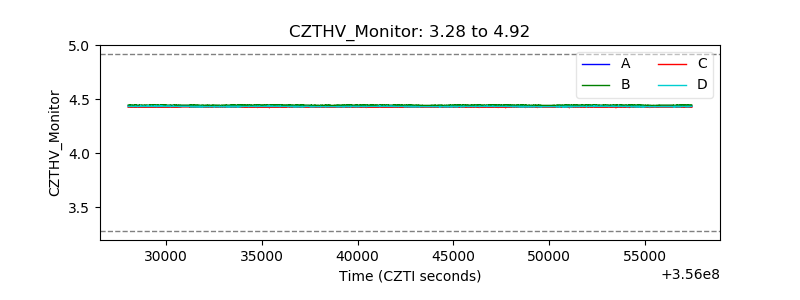 |
| D_VDD | 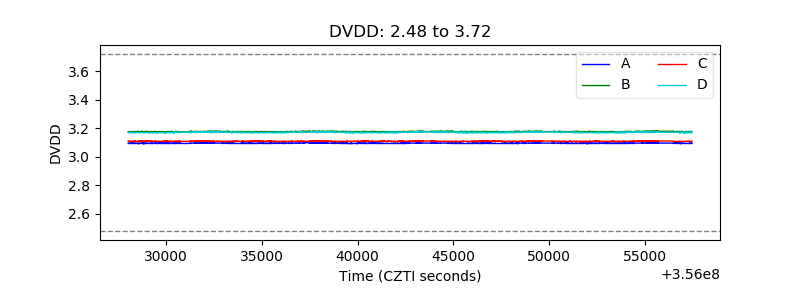 |
| Temperature 1 |  |
| Veto HV Monitor | 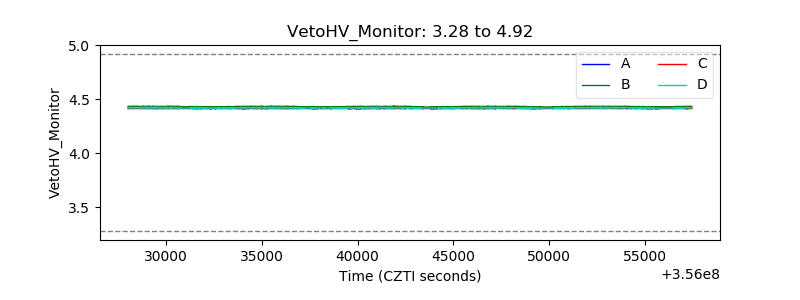 |
| Veto LLD | 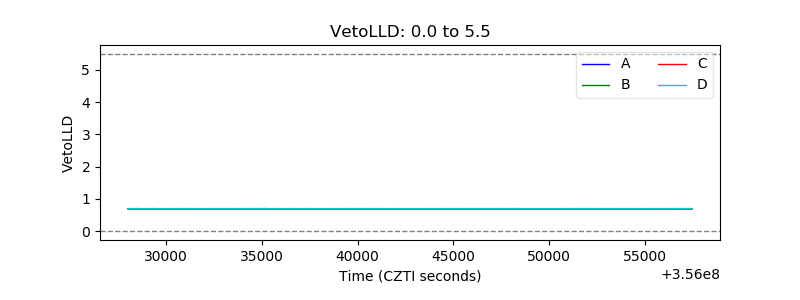 |
| Alpha Counter |  |
| _CPM_Rate |  |
| CZT Counter |  |
| +2.5 Volts monitor |  |
| +5 Volts monitor |  |
| _ROLL_ROT | 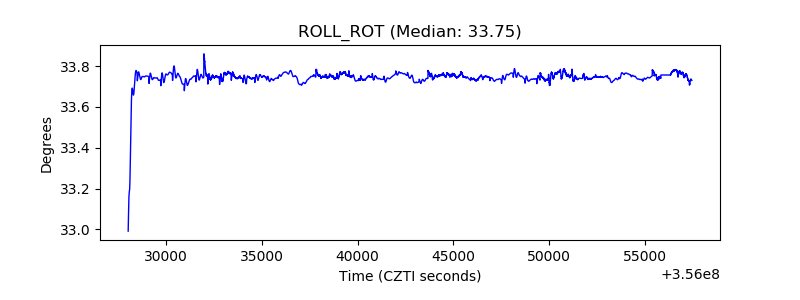 |
| _Roll_DEC | 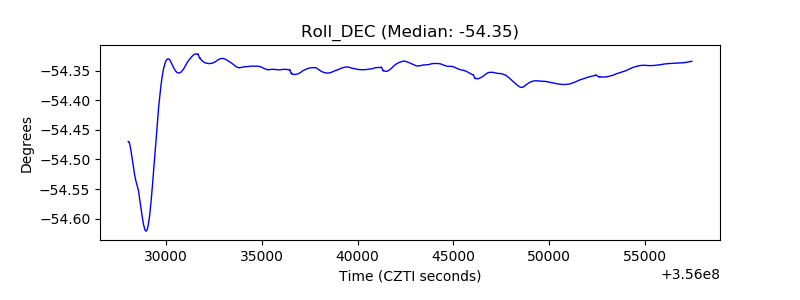 |
| _Roll_RA | 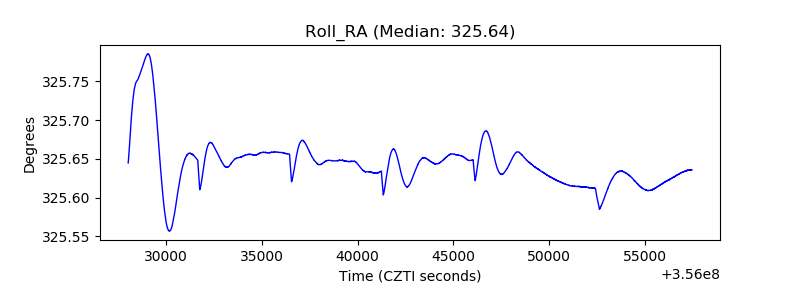 |
| Veto Counter |  |