| Param | Original file | Final file |
|---|---|---|
| Filename | modeM0/AS1A10_053T06_9000004300_29967cztM0_level2.evt | modeM0/AS1A10_053T06_9000004300_29967cztM0_level2_quad_clean.evt |
| Size (bytes) | 420,405,120 | 58,409,280 |
| Size | 400.9 MB | 55.7 MB |
| Events in quadrant A | 2,146,606 | 382,569 |
| Events in quadrant B | 3,484,728 | 377,708 |
| Events in quadrant C | 3,772,635 | 355,324 |
| Events in quadrant D | 3,040,775 | 354,526 |
| Mode M0 | |||
|---|---|---|---|
| Quadrant | BADHDUFLAG | Total packets | Discarded packets |
| A | 0 | 8948 | 1 |
| B | 0 | 13215 | 1 |
| C | 0 | 14316 | 1 |
| D | 0 | 11787 | 1 |
| Mode M9 | |||
|---|---|---|---|
| Quadrant | BADHDUFLAG | Total packets | Discarded packets |
| A | 0 | 4 | 0 |
| B | 0 | 4 | 0 |
| C | 0 | 4 | 0 |
| D | 0 | 4 | 0 |
| Mode SS | |||
|---|---|---|---|
| Quadrant | BADHDUFLAG | Total packets | Discarded packets |
| A | 0 | 88 | 0 |
| B | 0 | 88 | 0 |
| C | 0 | 88 | 0 |
| D | 0 | 88 | 0 |
| Quadrant | Total seconds | Saturated seconds | Saturation percentage |
|---|---|---|---|
| A | 4230 | 84 | 1.985816% |
| B | 4230 | 148 | 3.498818% |
| C | 4230 | 241 | 5.697400% |
| D | 4230 | 191 | 4.515366% |
Noise dominated data is calculated using 1-second bins in cleaned event files. If a bin has >2000 counts, and if more than 50% of those come from <1% of pixels, then it is considered to be noise-dominated and hence unusable.
| Quadrant | # 1 sec bins | Bins with >0 counts | Bins with >2000 counts | High rate bins dominated by noise | Noise dominated (total time) | Noise dominated (detector-on time) | Marked lightcurve |
|---|---|---|---|---|---|---|---|
| A | 4665 | 4231 | 0 | 0 | 0.00% | 0.00% | 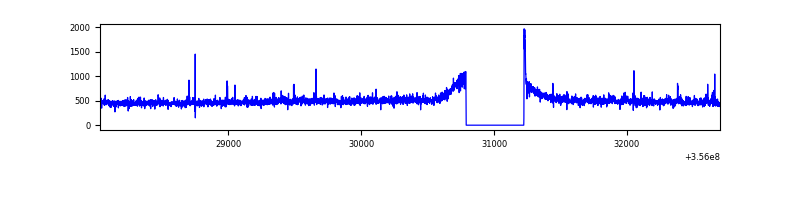 |
| B | 4665 | 4231 | 2 | 2 | 0.04% | 0.05% | 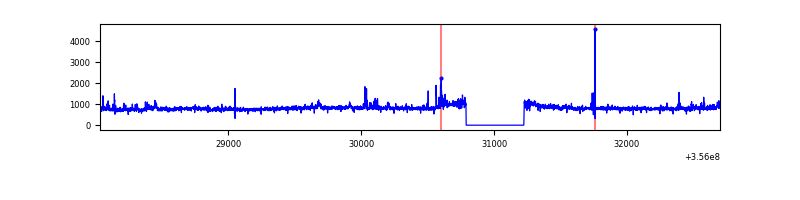 |
| C | 4665 | 4231 | 8 | 8 | 0.17% | 0.19% | 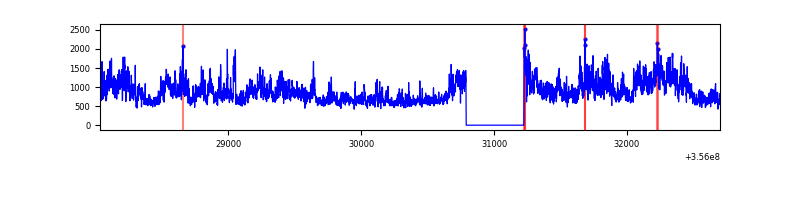 |
| D | 4665 | 4231 | 140 | 140 | 3.00% | 3.31% | 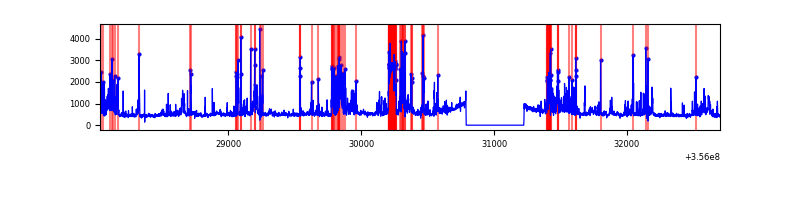 |
Top three noisy pixels from each quadrant. If the there are fewer than three noisy pixels in the level2.evt file, extra rows are filled as -1
| Pixel properties | Quadrant properties | ||||||
|---|---|---|---|---|---|---|---|
| Quadrant | DetID | PixID | Counts | Sigma | Mean | Median | Sigma |
| A | 12 | 96 | 28728 | 257.13 | 544 | 532 | 109.7 |
| A | 8 | 192 | 13612 | 119.28 | 544 | 532 | 109.7 |
| A | 13 | 254 | 7678 | 65.17 | 544 | 532 | 109.7 |
| B | 6 | 159 | 1225525 | 11716.9 | 530 | 516 | 104.6 |
| B | 6 | 36 | 149232 | 1422.43 | 530 | 516 | 104.6 |
| B | 12 | 111 | 12845 | 117.92 | 530 | 516 | 104.6 |
| C | 3 | 233 | 1674297 | 13766.68 | 511 | 513 | 121.6 |
| C | 14 | 238 | 86527 | 707.46 | 511 | 513 | 121.6 |
| C | 2 | 114 | 10409 | 81.39 | 511 | 513 | 121.6 |
| D | 7 | 80 | 786905 | 6362.44 | 520 | 506 | 123.6 |
| D | 7 | 238 | 154599 | 1246.7 | 520 | 506 | 123.6 |
| D | 8 | 195 | 108665 | 875.07 | 520 | 506 | 123.6 |
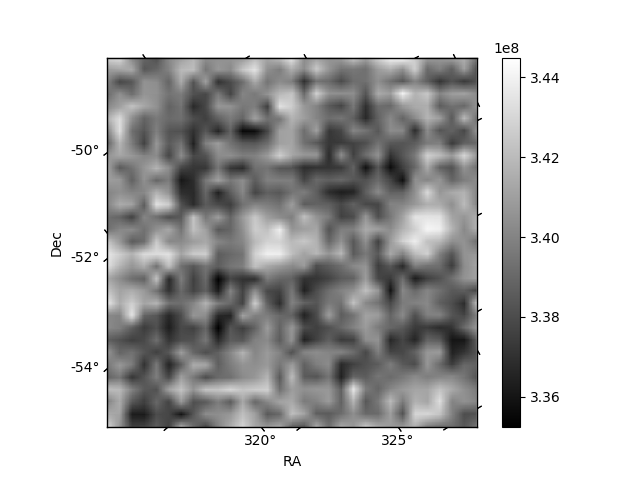
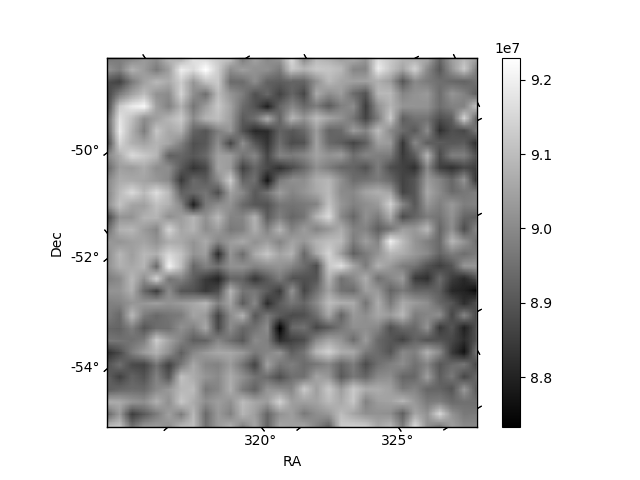
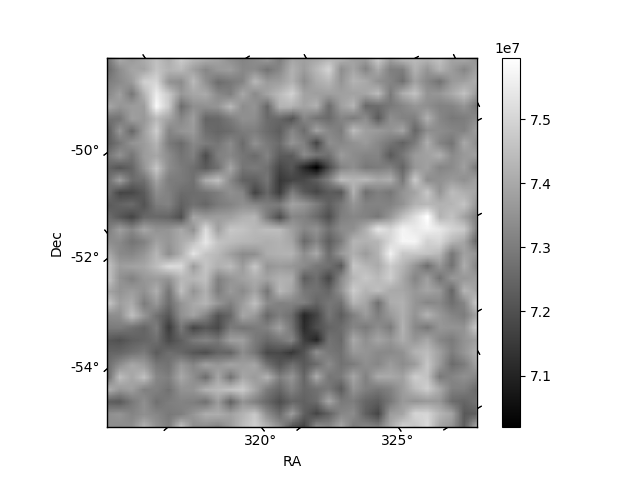
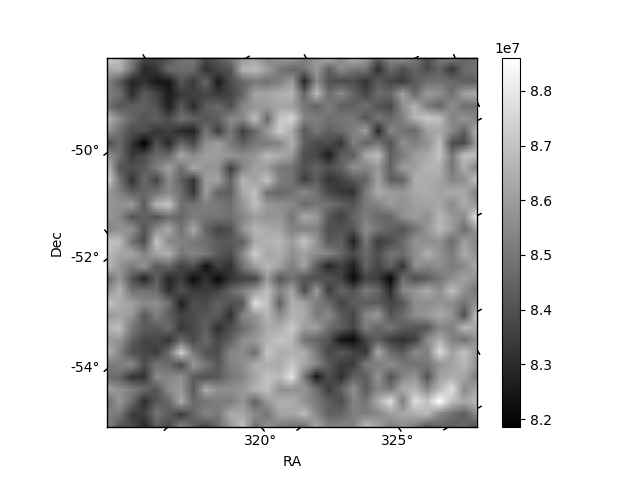
Histogram calculated using DETX and DETY for each event in the final _common_clean file
| Quadrant A | 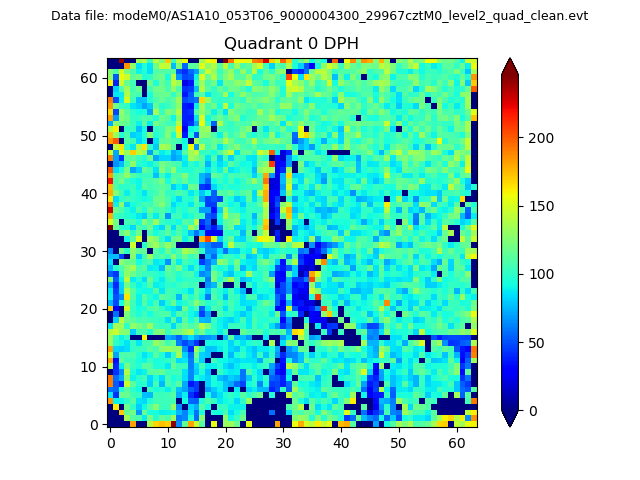 |
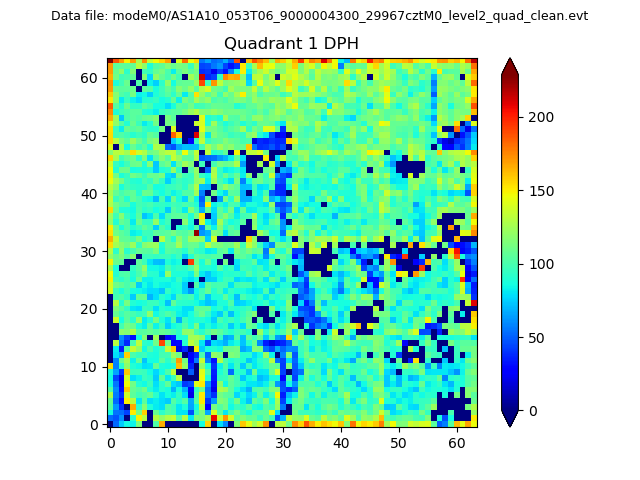 |
Quadrant B |
|---|---|---|---|
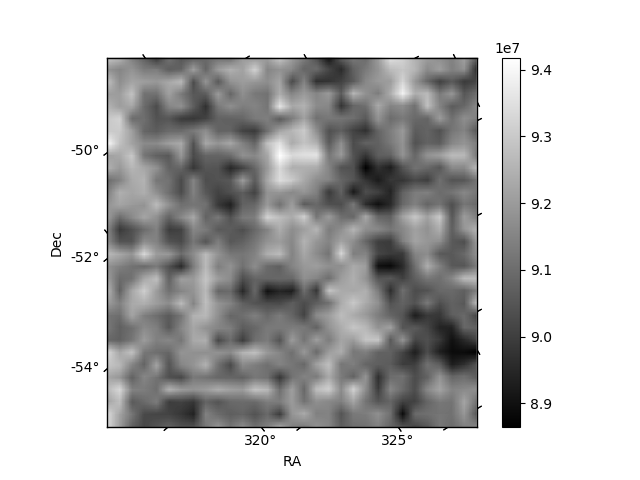
| Quadrant D | 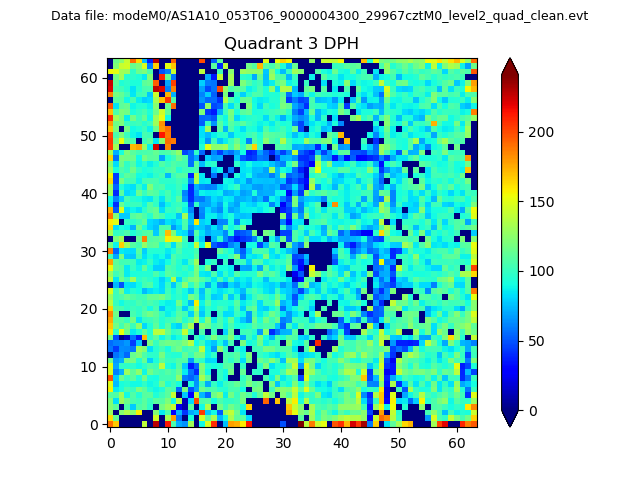 |
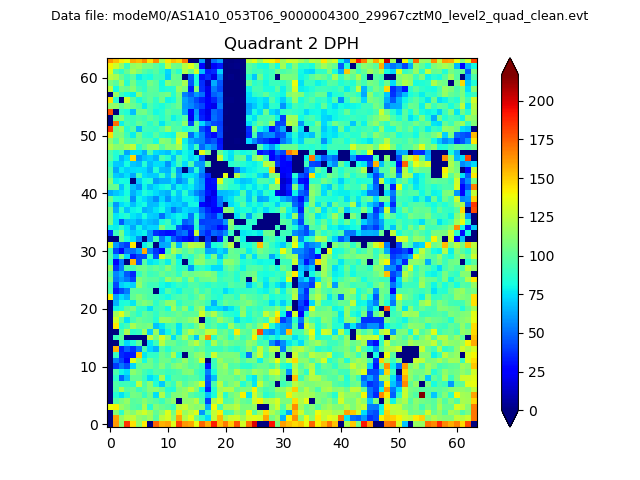 |
Quadrant C |
| Plot type | Count rate plots | Images |
|---|---|---|
| Comparison with Poisson distribution Blue bars denote a histogram of data divided into 1 sec bins. Red curve is a Poisson curve with rate = median count rate of data. |
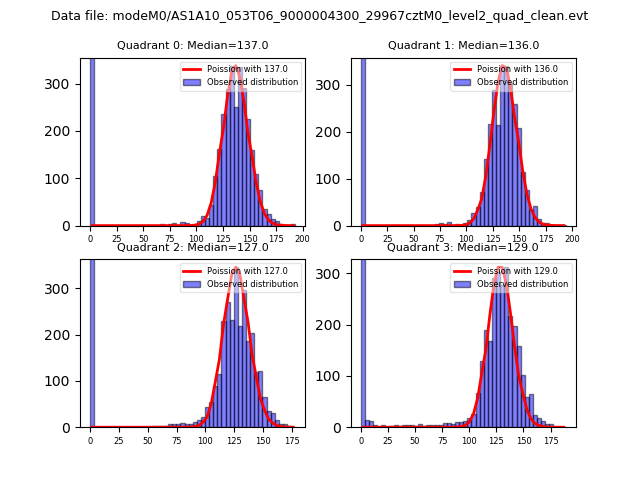 |
 |
| Quadrant-wise count rates Data is divided into 100 sec bins |
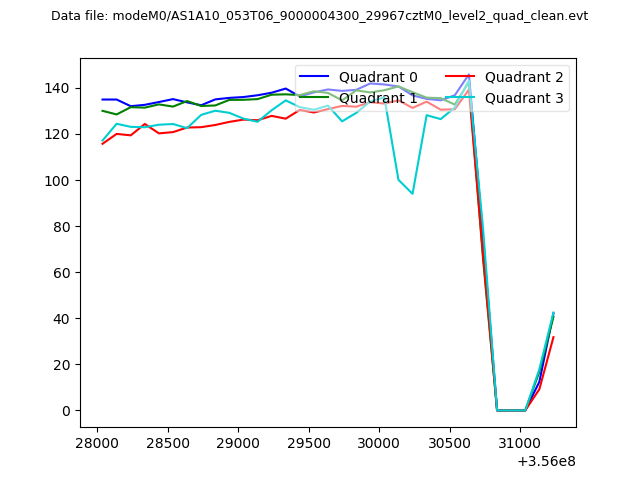 |
|
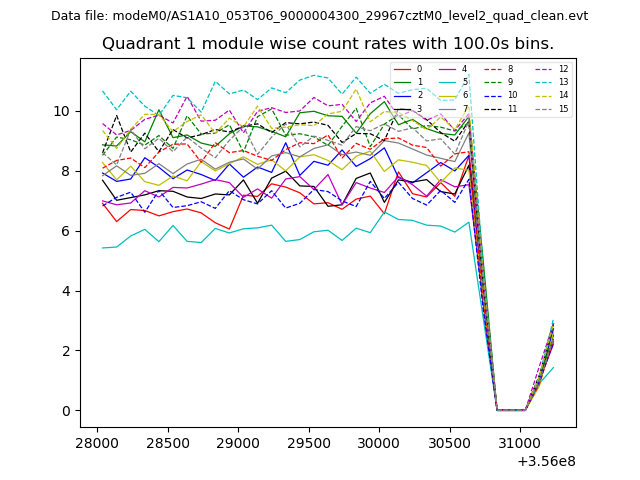
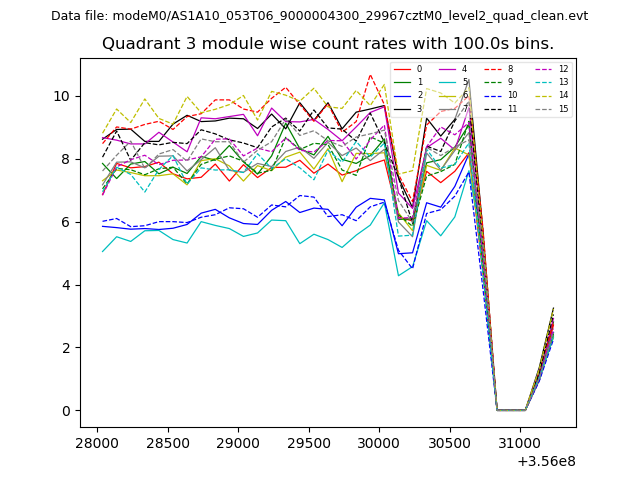
| Module-wise count rates for Quadrant A Data is divided into 100 sec bins |
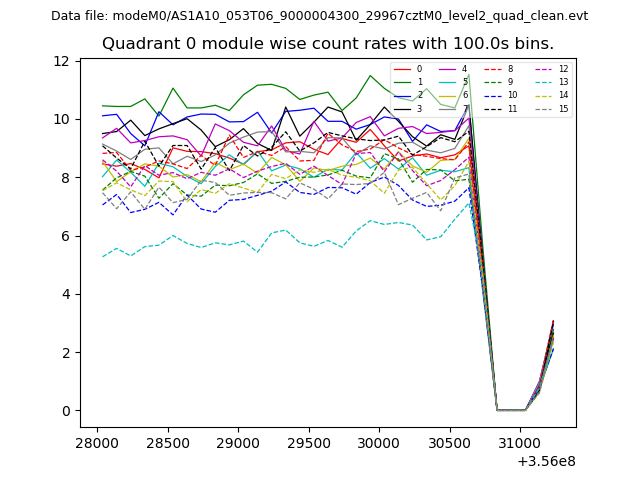 |
 |
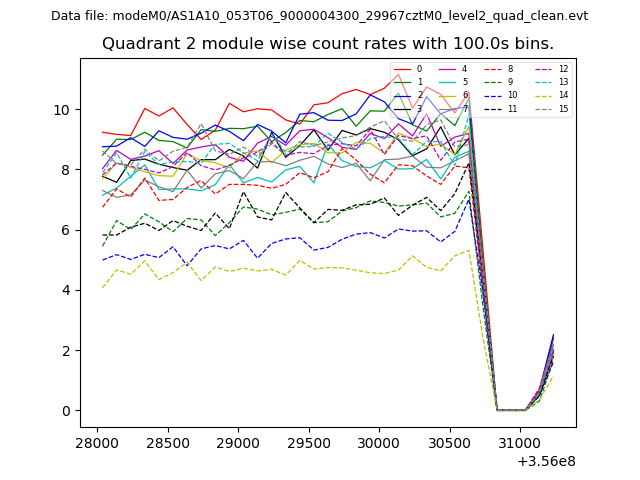
| Module-wise count rates for Quadrant B Data is divided into 100 sec bins |
 |
 |
| Module-wise count rates for Quadrant C Data is divided into 100 sec bins |
 |
 |
| Module-wise count rates for Quadrant D Data is divided into 100 sec bins |
 |
 |
| Parameter | Plot |
|---|---|
| CZT HV Monitor | 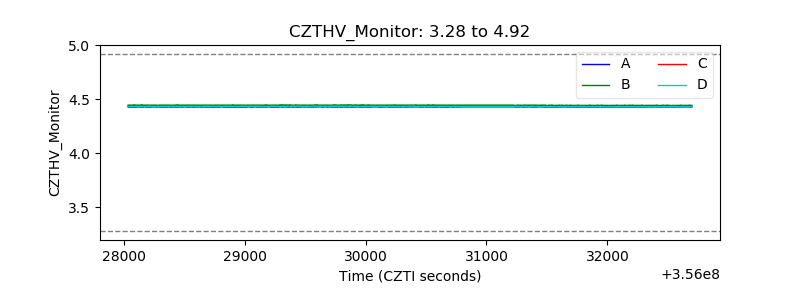 |
| D_VDD | 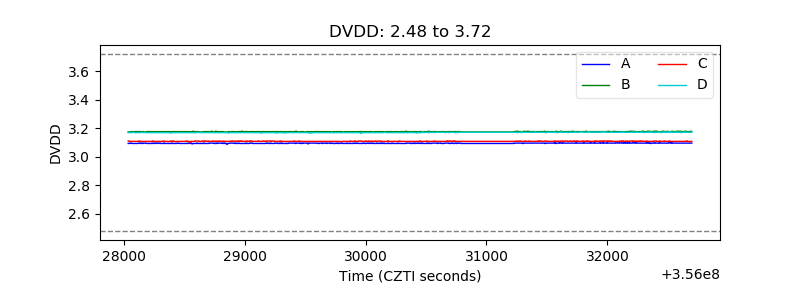 |
| Temperature 1 | 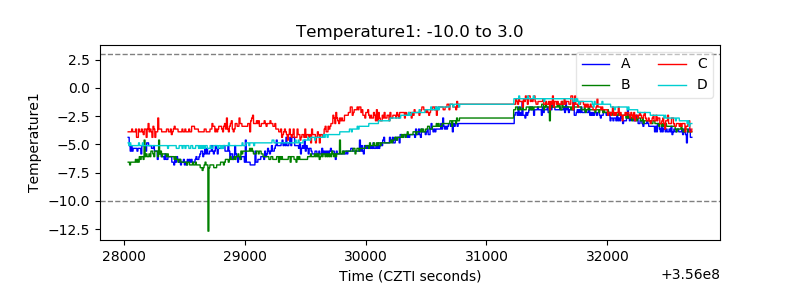 |
| Veto HV Monitor |  |
| Veto LLD | 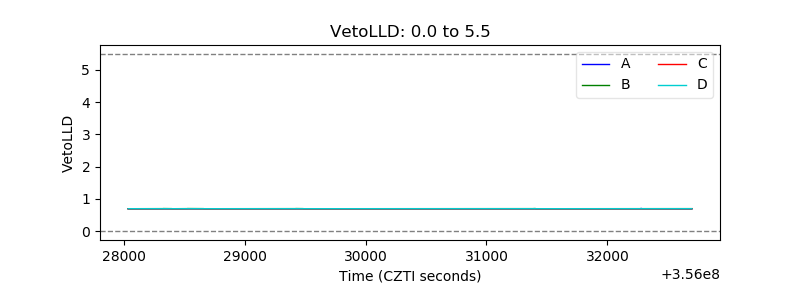 |
| Alpha Counter | 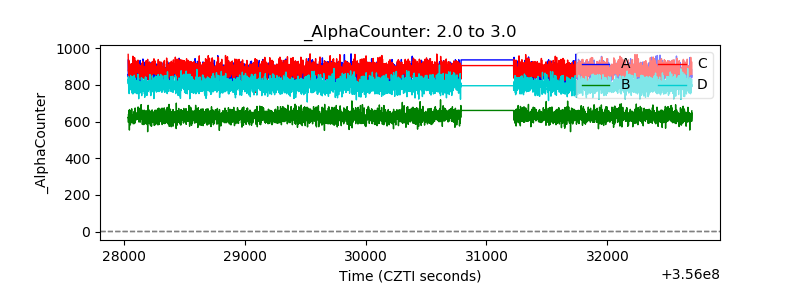 |
| _CPM_Rate | 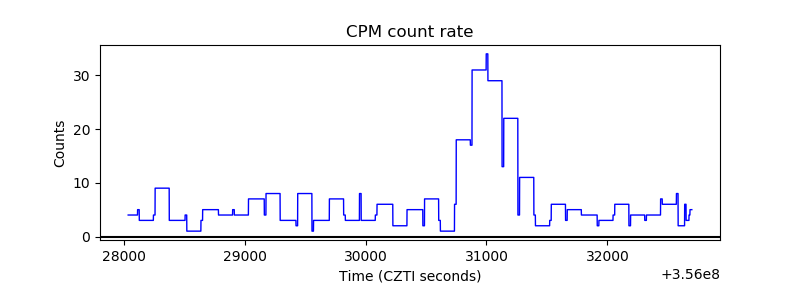 |
| CZT Counter | 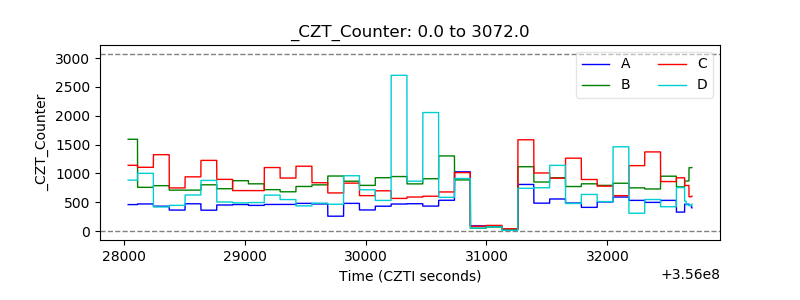 |
| +2.5 Volts monitor |  |
| +5 Volts monitor | 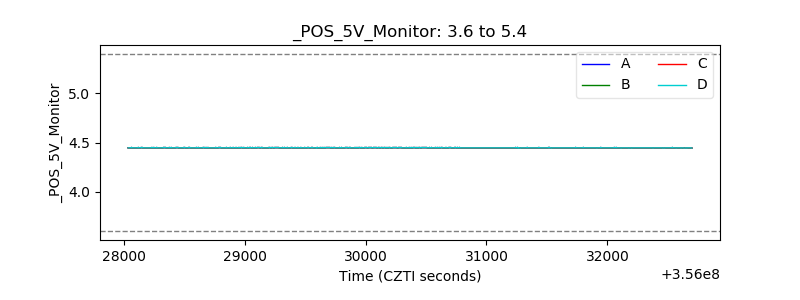 |
| _ROLL_ROT | 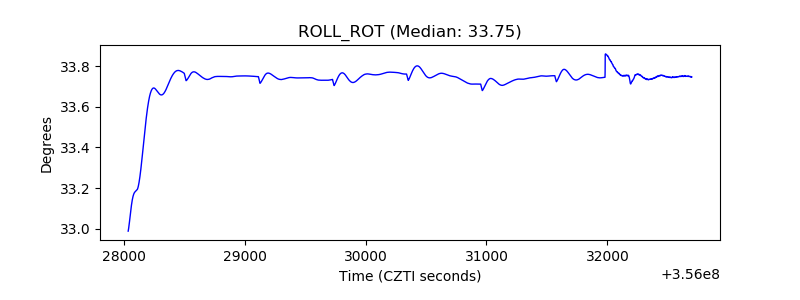 |
| _Roll_DEC | 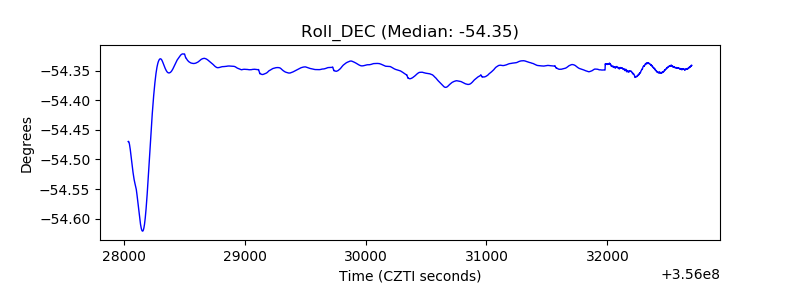 |
| _Roll_RA |  |
| Veto Counter | 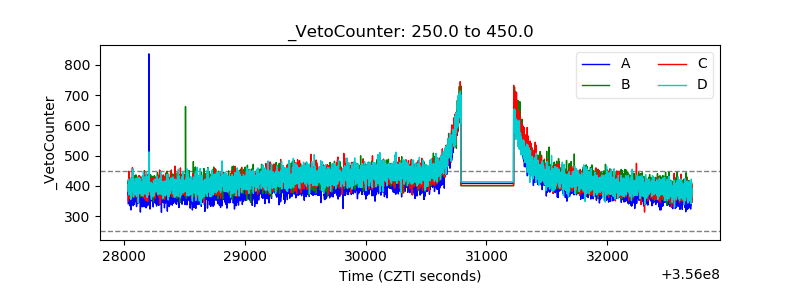 |