| Param | Original file | Final file |
|---|---|---|
| Filename | modeM0/AS1A10_053T06_9000004300_29968cztM0_level2.evt | modeM0/AS1A10_053T06_9000004300_29968cztM0_level2_quad_clean.evt |
| Size (bytes) | 668,145,600 | 87,641,280 |
| Size | 637.2 MB | 83.6 MB |
| Events in quadrant A | 3,938,134 | 546,813 |
| Events in quadrant B | 6,691,773 | 533,911 |
| Events in quadrant C | 4,666,387 | 518,602 |
| Events in quadrant D | 4,418,579 | 519,682 |
| Mode M0 | |||
|---|---|---|---|
| Quadrant | BADHDUFLAG | Total packets | Discarded packets |
| A | 0 | 16604 | 2 |
| B | 0 | 25233 | 2 |
| C | 0 | 18877 | 2 |
| D | 0 | 18115 | 2 |
| Mode M9 | |||
|---|---|---|---|
| Quadrant | BADHDUFLAG | Total packets | Discarded packets |
| A | 0 | 7 | 0 |
| B | 0 | 7 | 0 |
| C | 0 | 7 | 0 |
| D | 0 | 7 | 0 |
| Mode SS | |||
|---|---|---|---|
| Quadrant | BADHDUFLAG | Total packets | Discarded packets |
| A | 0 | 158 | 0 |
| B | 0 | 158 | 0 |
| C | 0 | 158 | 0 |
| D | 0 | 158 | 0 |
| Quadrant | Total seconds | Saturated seconds | Saturation percentage |
|---|---|---|---|
| A | 7689 | 174 | 2.262973% |
| B | 7689 | 366 | 4.760047% |
| C | 7690 | 247 | 3.211964% |
| D | 7690 | 94 | 1.222367% |
Noise dominated data is calculated using 1-second bins in cleaned event files. If a bin has >2000 counts, and if more than 50% of those come from <1% of pixels, then it is considered to be noise-dominated and hence unusable.
| Quadrant | # 1 sec bins | Bins with >0 counts | Bins with >2000 counts | High rate bins dominated by noise | Noise dominated (total time) | Noise dominated (detector-on time) | Marked lightcurve |
|---|---|---|---|---|---|---|---|
| A | 8354 | 7691 | 10 | 10 | 0.12% | 0.13% | 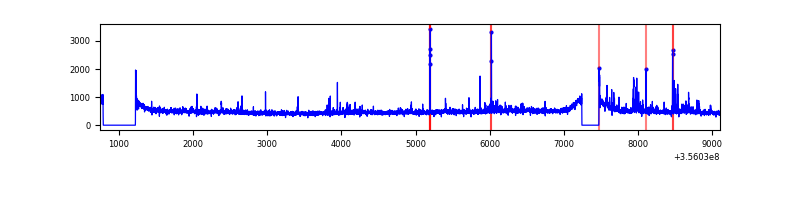 |
| B | 8354 | 7691 | 75 | 75 | 0.90% | 0.98% | 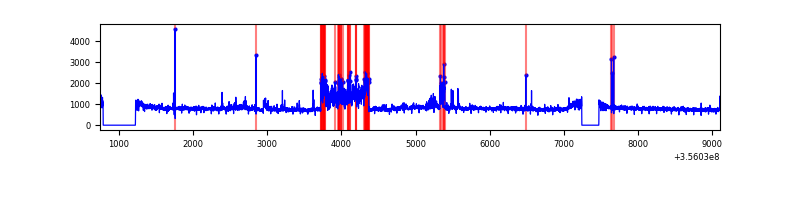 |
| C | 8355 | 7692 | 7 | 7 | 0.08% | 0.09% | 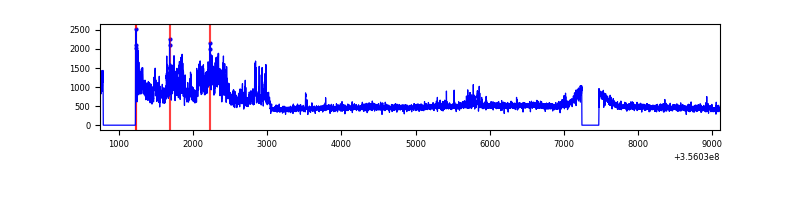 |
| D | 8355 | 7692 | 34 | 34 | 0.41% | 0.44% | 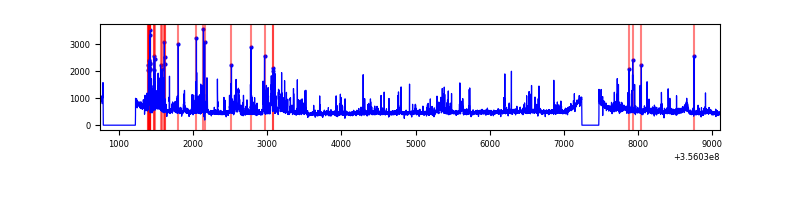 |
Top three noisy pixels from each quadrant. If the there are fewer than three noisy pixels in the level2.evt file, extra rows are filled as -1
| Pixel properties | Quadrant properties | ||||||
|---|---|---|---|---|---|---|---|
| Quadrant | DetID | PixID | Counts | Sigma | Mean | Median | Sigma |
| A | 12 | 96 | 192109 | 992.13 | 959 | 937 | 192.7 |
| A | 8 | 192 | 26418 | 132.24 | 959 | 937 | 192.7 |
| A | 13 | 254 | 15105 | 73.53 | 959 | 937 | 192.7 |
| B | 6 | 159 | 2234248 | 12418.08 | 936 | 912 | 179.8 |
| B | 6 | 36 | 724370 | 4022.66 | 936 | 912 | 179.8 |
| B | 12 | 111 | 22147 | 118.07 | 936 | 912 | 179.8 |
| C | 3 | 233 | 985489 | 4669.59 | 901 | 905 | 210.9 |
| C | 14 | 238 | 148073 | 697.97 | 901 | 905 | 210.9 |
| C | 2 | 114 | 18586 | 83.86 | 901 | 905 | 210.9 |
| D | 7 | 80 | 569379 | 2589.13 | 926 | 903 | 219.6 |
| D | 8 | 195 | 228009 | 1034.36 | 926 | 903 | 219.6 |
| D | 12 | 233 | 68544 | 308.07 | 926 | 903 | 219.6 |
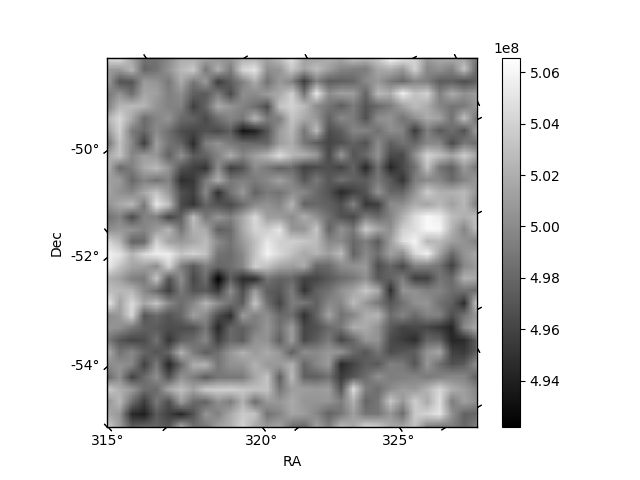
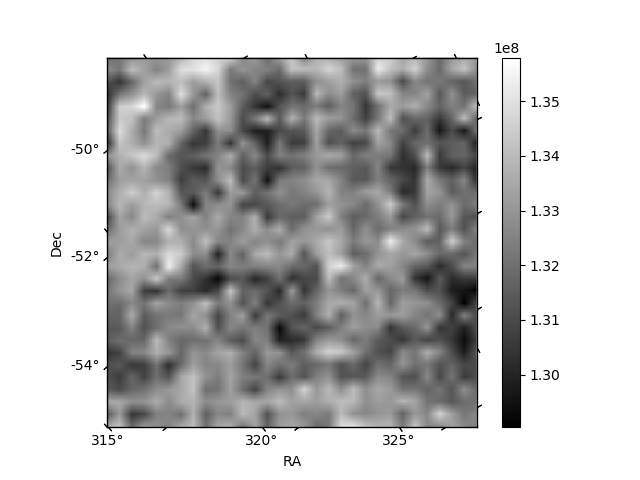
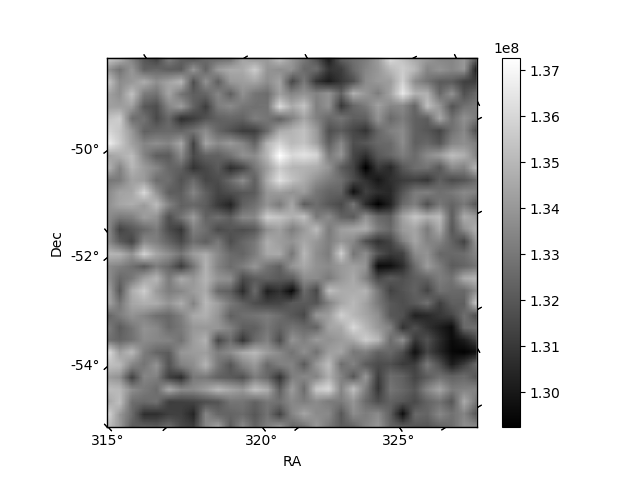
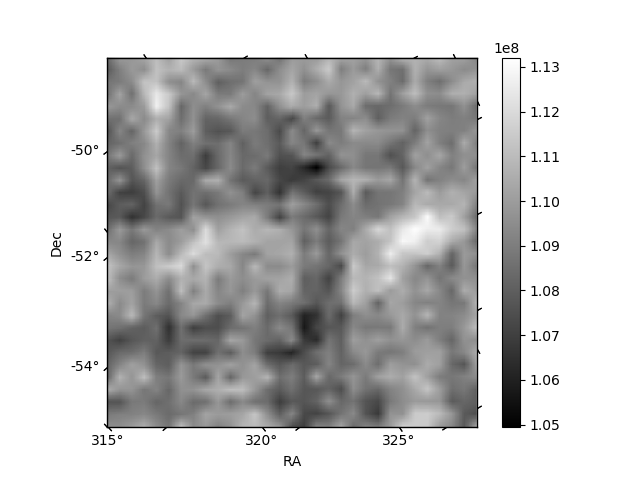
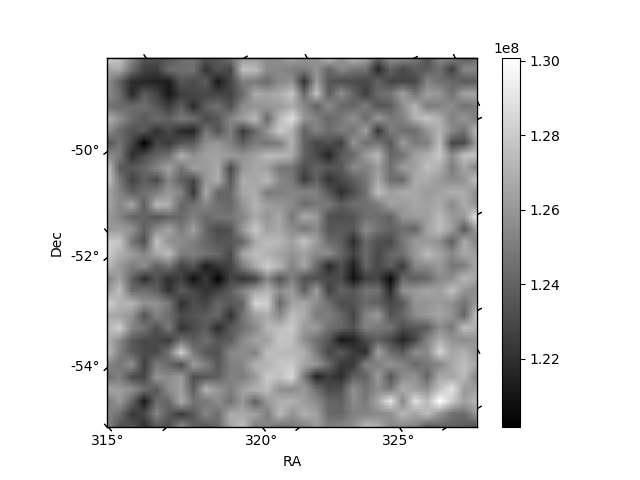
Histogram calculated using DETX and DETY for each event in the final _common_clean file
| Quadrant A | 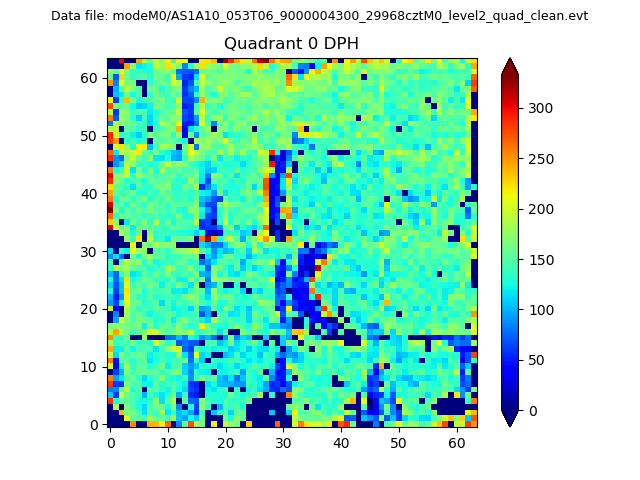 |
 |
Quadrant B |
|---|---|---|---|
| Quadrant D | 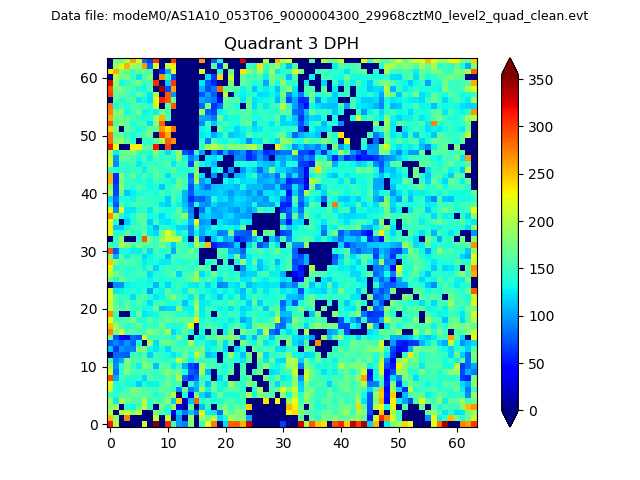 |
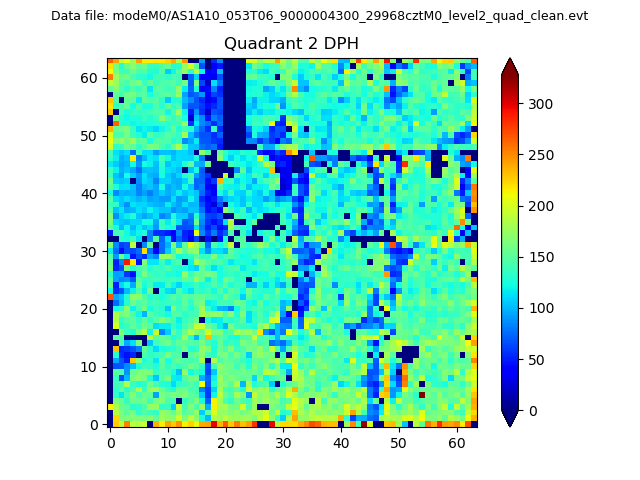 |
Quadrant C |
| Plot type | Count rate plots | Images |
|---|---|---|
| Comparison with Poisson distribution Blue bars denote a histogram of data divided into 1 sec bins. Red curve is a Poisson curve with rate = median count rate of data. |
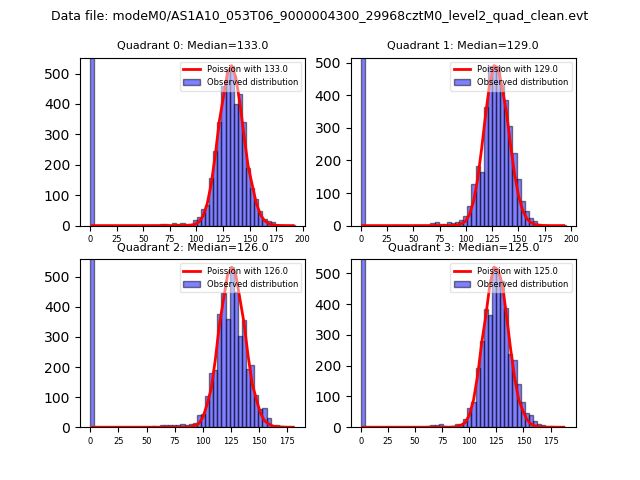 |
 |
| Quadrant-wise count rates Data is divided into 100 sec bins |
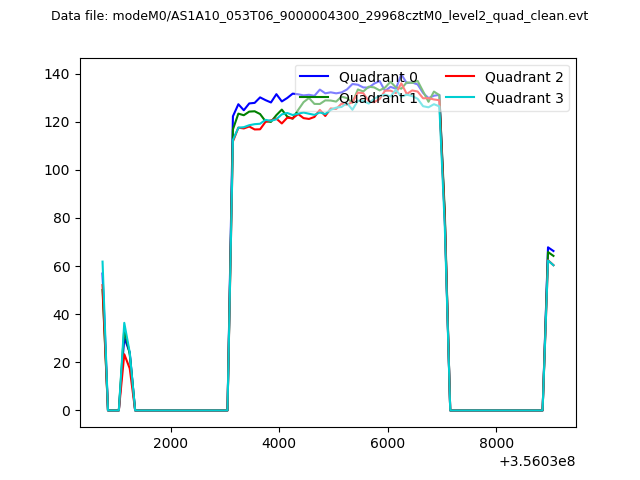 |
|
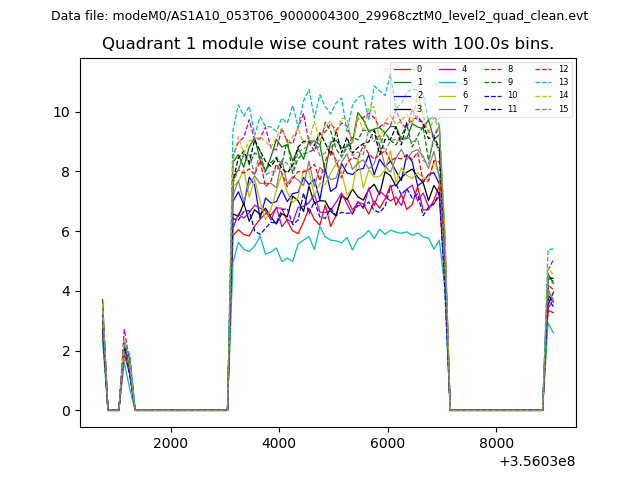
| Module-wise count rates for Quadrant A Data is divided into 100 sec bins |
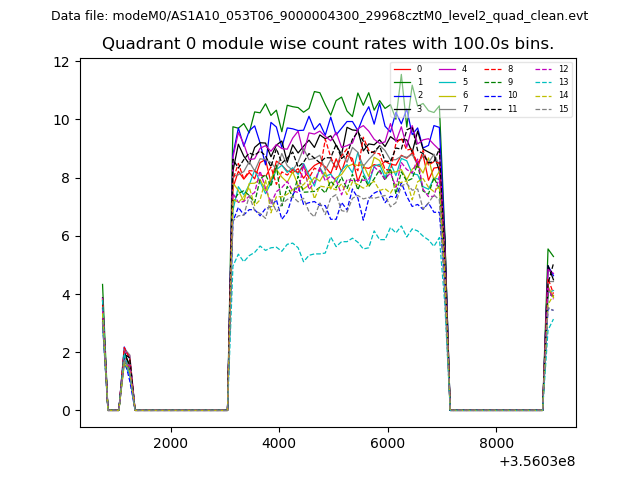 |
 |
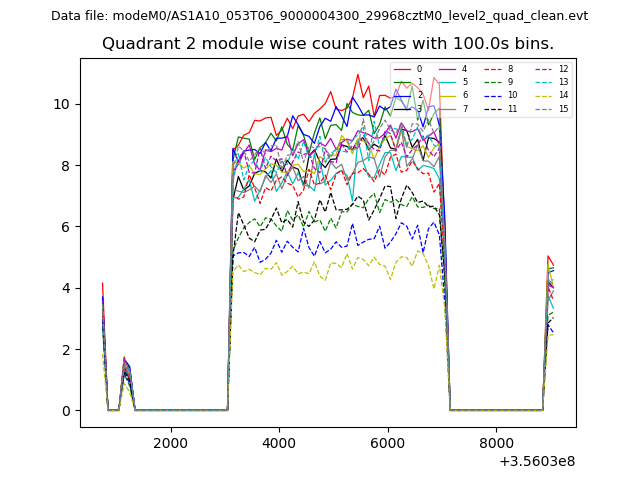
| Module-wise count rates for Quadrant B Data is divided into 100 sec bins |
 |
 |
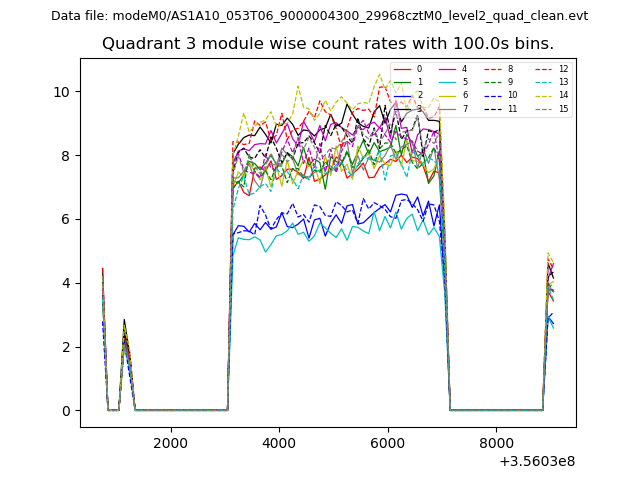
| Module-wise count rates for Quadrant C Data is divided into 100 sec bins |
 |
 |
| Module-wise count rates for Quadrant D Data is divided into 100 sec bins |
 |
 |
| Parameter | Plot |
|---|---|
| CZT HV Monitor | 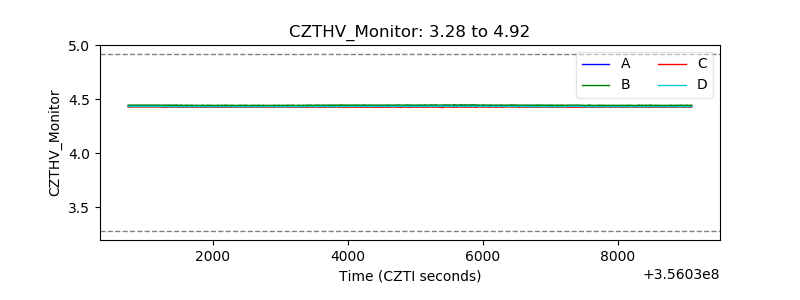 |
| D_VDD | 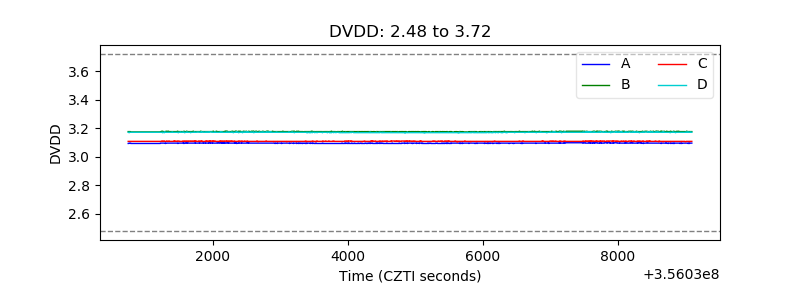 |
| Temperature 1 |  |
| Veto HV Monitor | 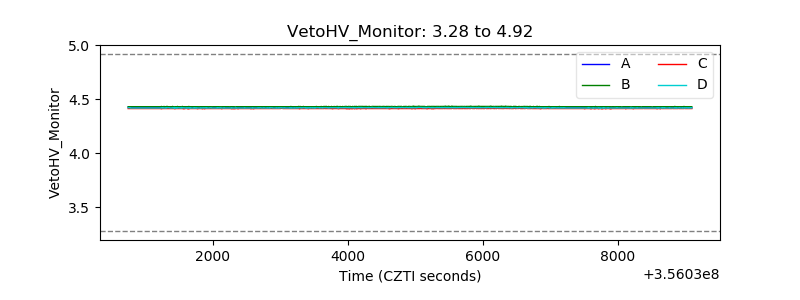 |
| Veto LLD | 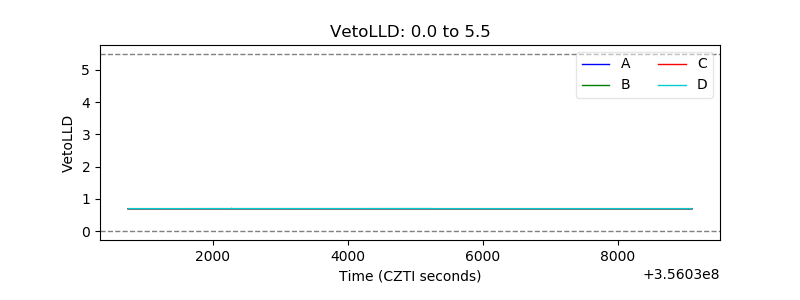 |
| Alpha Counter | 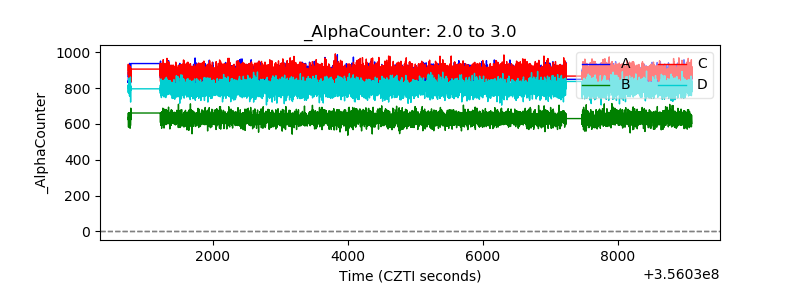 |
| _CPM_Rate | 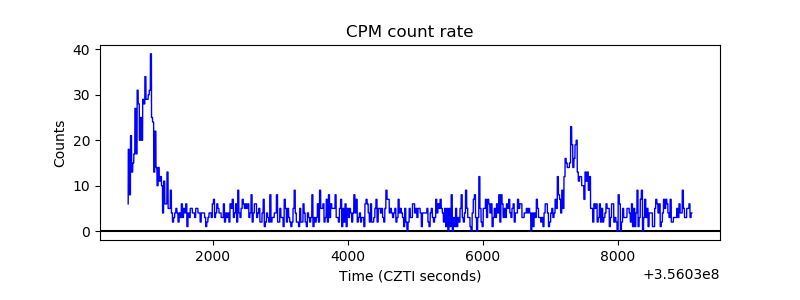 |
| CZT Counter | 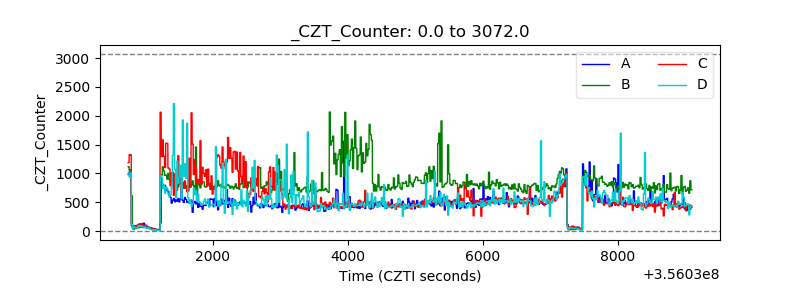 |
| +2.5 Volts monitor |  |
| +5 Volts monitor |  |
| _ROLL_ROT |  |
| _Roll_DEC | 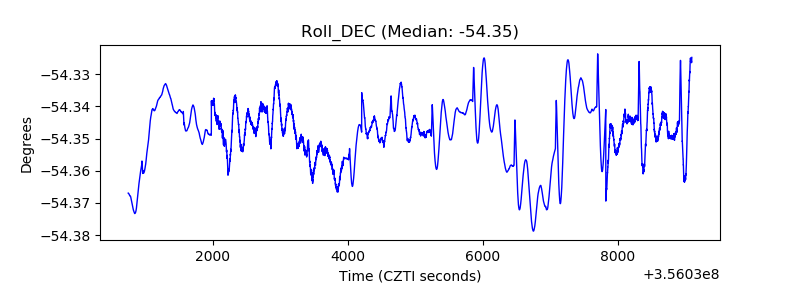 |
| _Roll_RA | 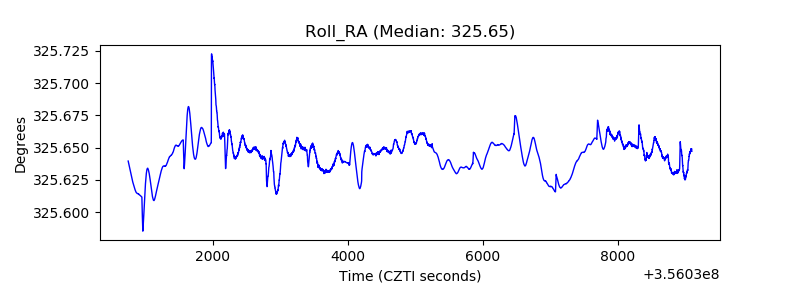 |
| Veto Counter | 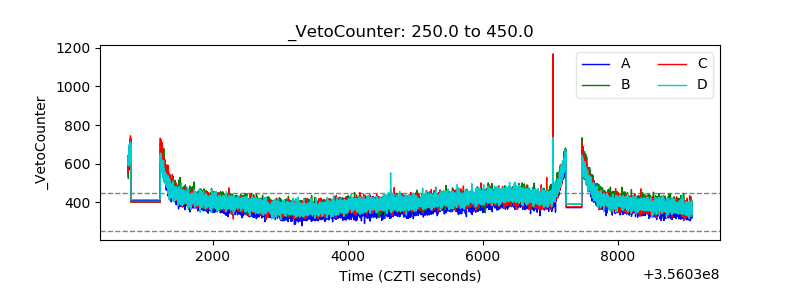 |