| Param | Original file | Final file |
|---|---|---|
| Filename | modeM0/AS1A10_053T06_9000004300_29971cztM0_level2.evt | modeM0/AS1A10_053T06_9000004300_29971cztM0_level2_quad_clean.evt |
| Size (bytes) | 1,186,053,120 | 172,203,840 |
| Size | 1.1 GB | 164.2 MB |
| Events in quadrant A | 5,874,808 | 1,129,700 |
| Events in quadrant B | 9,753,167 | 1,115,381 |
| Events in quadrant C | 12,244,014 | 1,046,080 |
| Events in quadrant D | 7,213,761 | 1,068,334 |
| Mode M0 | |||
|---|---|---|---|
| Quadrant | BADHDUFLAG | Total packets | Discarded packets |
| A | 0 | 25385 | 3 |
| B | 0 | 37951 | 3 |
| C | 0 | 44868 | 3 |
| D | 0 | 29366 | 3 |
| Mode M9 | |||
|---|---|---|---|
| Quadrant | BADHDUFLAG | Total packets | Discarded packets |
| A | 0 | 14 | 0 |
| B | 0 | 15 | 0 |
| C | 0 | 15 | 0 |
| D | 0 | 15 | 0 |
| Mode SS | |||
|---|---|---|---|
| Quadrant | BADHDUFLAG | Total packets | Discarded packets |
| A | 0 | 252 | 0 |
| B | 0 | 252 | 0 |
| C | 0 | 252 | 0 |
| D | 0 | 252 | 0 |
| Quadrant | Total seconds | Saturated seconds | Saturation percentage |
|---|---|---|---|
| A | 12381 | 100 | 0.807689% |
| B | 12381 | 207 | 1.671917% |
| C | 12381 | 1811 | 14.627251% |
| D | 12381 | 352 | 2.843066% |
Noise dominated data is calculated using 1-second bins in cleaned event files. If a bin has >2000 counts, and if more than 50% of those come from <1% of pixels, then it is considered to be noise-dominated and hence unusable.
| Quadrant | # 1 sec bins | Bins with >0 counts | Bins with >2000 counts | High rate bins dominated by noise | Noise dominated (total time) | Noise dominated (detector-on time) | Marked lightcurve |
|---|---|---|---|---|---|---|---|
| A | 13611 | 12383 | 2 | 2 | 0.01% | 0.02% | 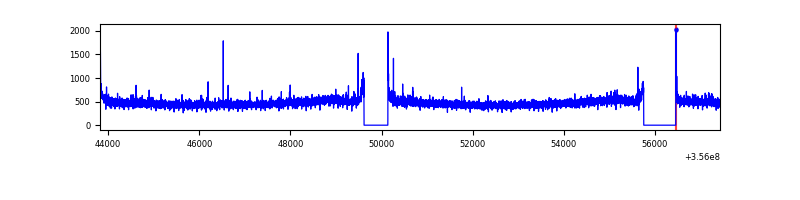 |
| B | 13611 | 12383 | 5 | 5 | 0.04% | 0.04% | 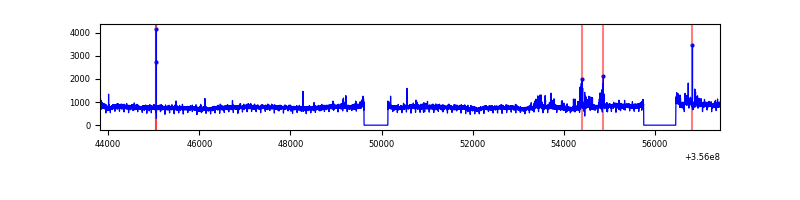 |
| C | 13611 | 12383 | 932 | 932 | 6.85% | 7.53% | 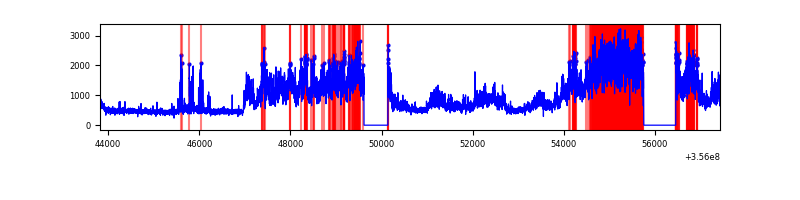 |
| D | 13611 | 12383 | 232 | 232 | 1.70% | 1.87% | 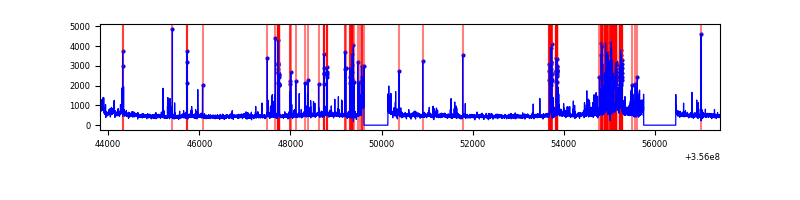 |
Top three noisy pixels from each quadrant. If the there are fewer than three noisy pixels in the level2.evt file, extra rows are filled as -1
| Pixel properties | Quadrant properties | ||||||
|---|---|---|---|---|---|---|---|
| Quadrant | DetID | PixID | Counts | Sigma | Mean | Median | Sigma |
| A | 3 | 1 | 43917 | 141.68 | 1493 | 1463 | 299.6 |
| A | 8 | 192 | 41779 | 134.55 | 1493 | 1463 | 299.6 |
| A | 13 | 254 | 23637 | 74.0 | 1493 | 1463 | 299.6 |
| B | 6 | 159 | 3643677 | 12861.08 | 1472 | 1431 | 283.2 |
| B | 6 | 36 | 272504 | 957.18 | 1472 | 1431 | 283.2 |
| B | 12 | 111 | 35132 | 119.0 | 1472 | 1431 | 283.2 |
| C | 3 | 233 | 6653058 | 20597.57 | 1373 | 1382 | 322.9 |
| C | 14 | 238 | 219481 | 675.36 | 1373 | 1382 | 322.9 |
| C | 2 | 114 | 27986 | 82.38 | 1373 | 1382 | 322.9 |
| D | 7 | 80 | 694987 | 2044.72 | 1433 | 1395 | 339.2 |
| D | 12 | 233 | 391323 | 1149.51 | 1433 | 1395 | 339.2 |
| D | 8 | 195 | 373636 | 1097.37 | 1433 | 1395 | 339.2 |
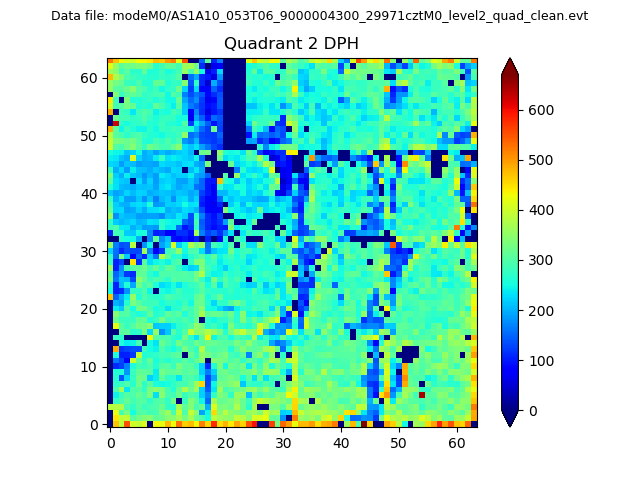
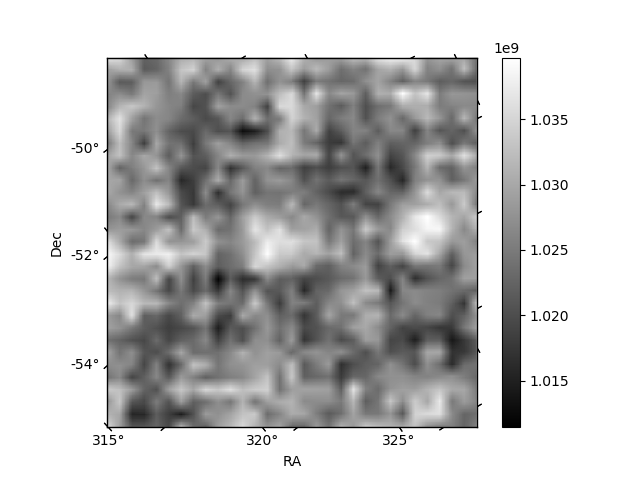
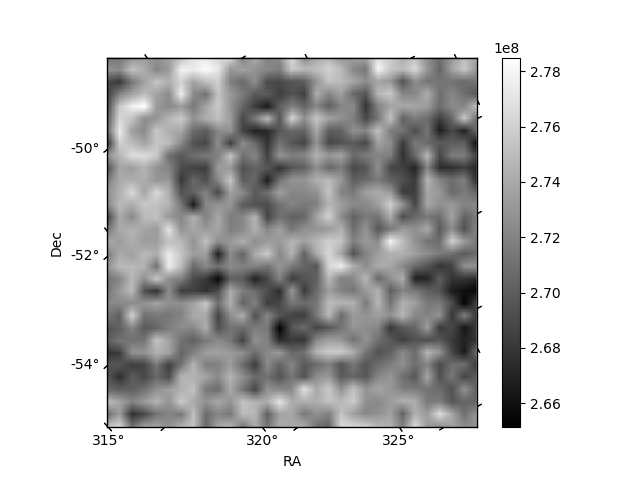
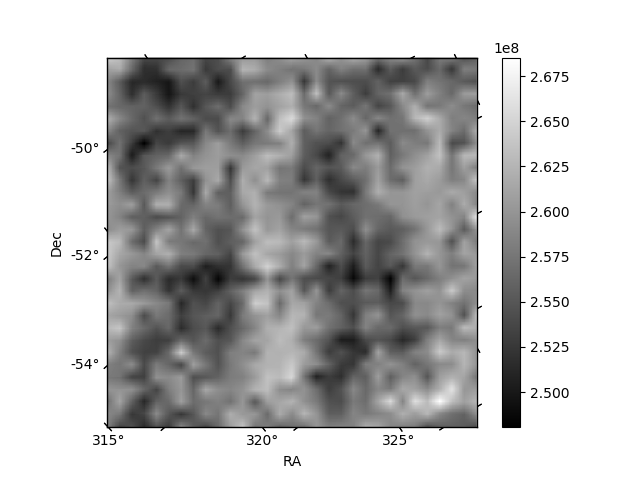
Histogram calculated using DETX and DETY for each event in the final _common_clean file
| Quadrant A | 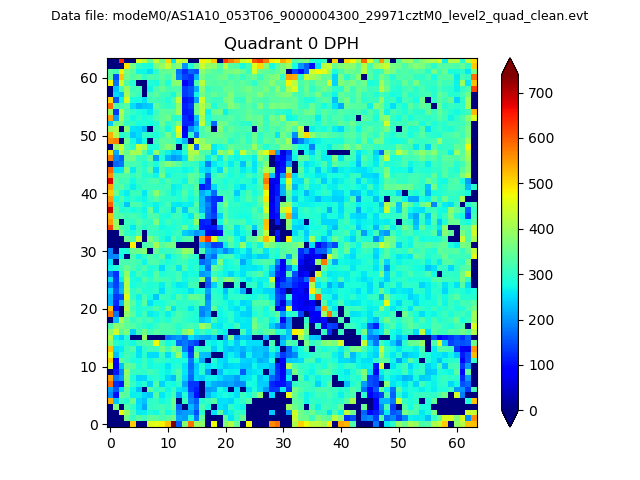 |
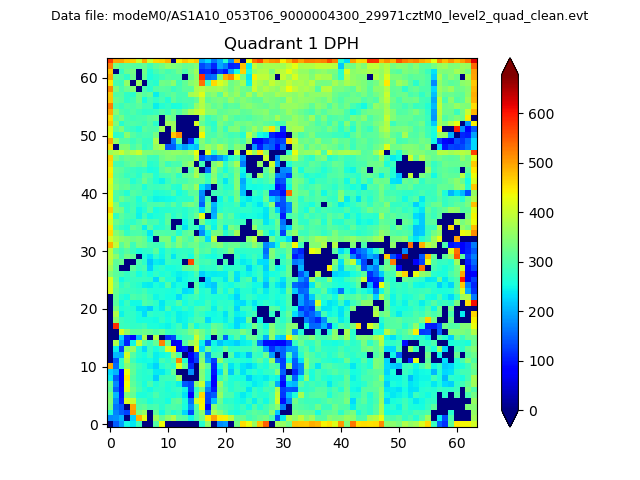 |
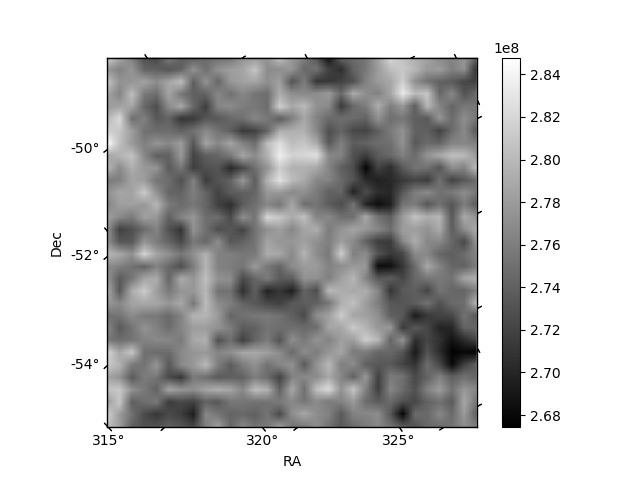
Quadrant B |
|---|---|---|---|
| Quadrant D | 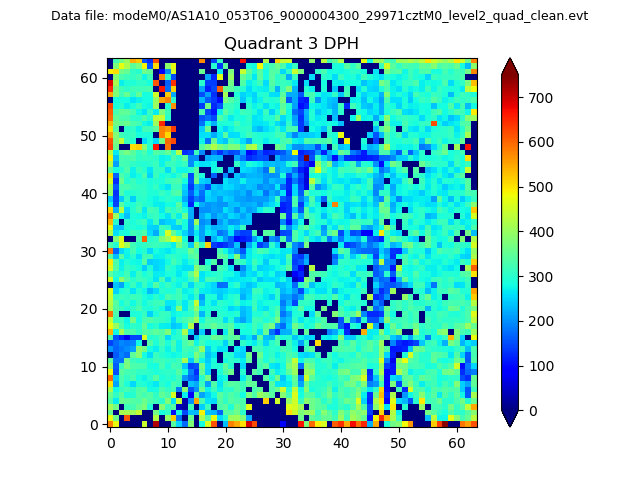 |
 |
Quadrant C |
| Plot type | Count rate plots | Images |
|---|---|---|
| Comparison with Poisson distribution Blue bars denote a histogram of data divided into 1 sec bins. Red curve is a Poisson curve with rate = median count rate of data. |
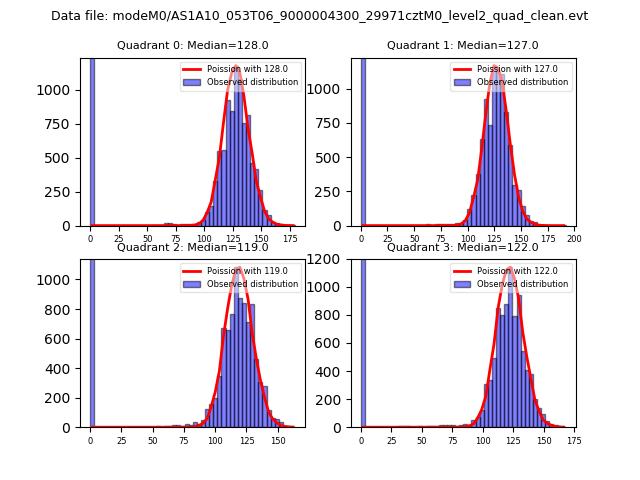 |
 |
| Quadrant-wise count rates Data is divided into 100 sec bins |
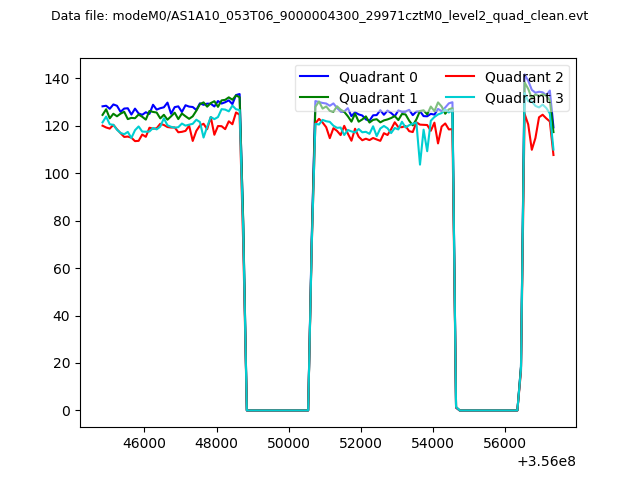 |
|
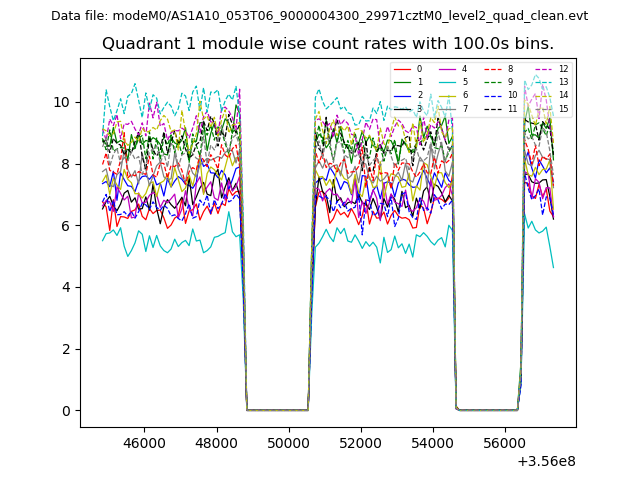
| Module-wise count rates for Quadrant A Data is divided into 100 sec bins |
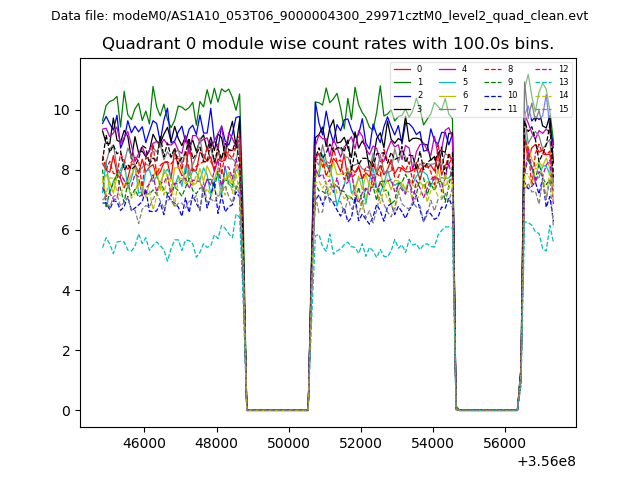 |
 |
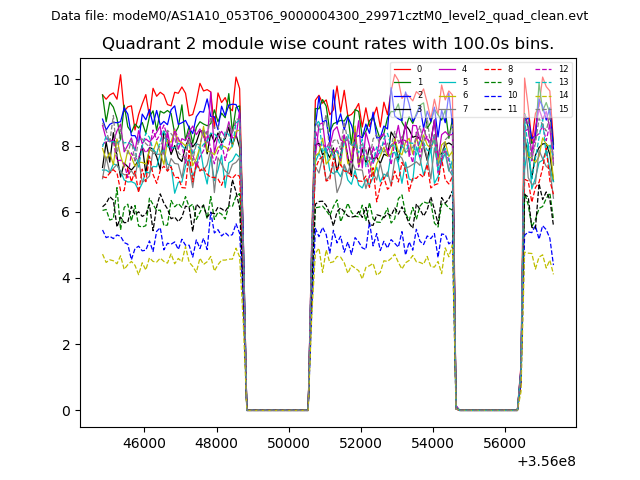
| Module-wise count rates for Quadrant B Data is divided into 100 sec bins |
 |
 |
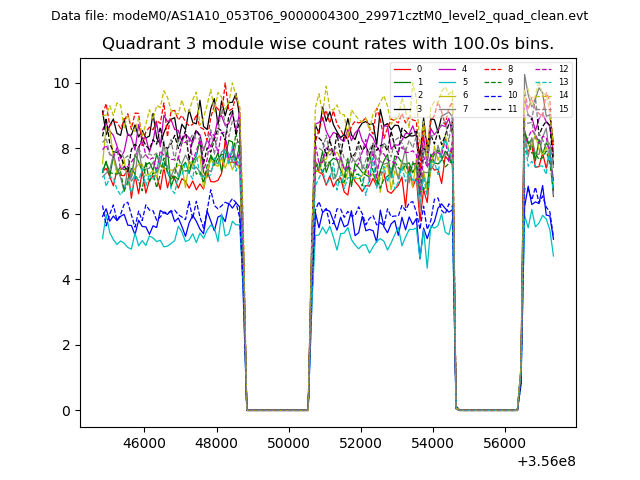
| Module-wise count rates for Quadrant C Data is divided into 100 sec bins |
 |
 |
| Module-wise count rates for Quadrant D Data is divided into 100 sec bins |
 |
 |
| Parameter | Plot |
|---|---|
| CZT HV Monitor | 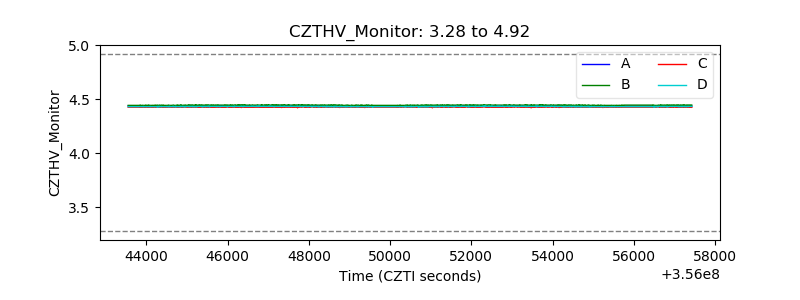 |
| D_VDD | 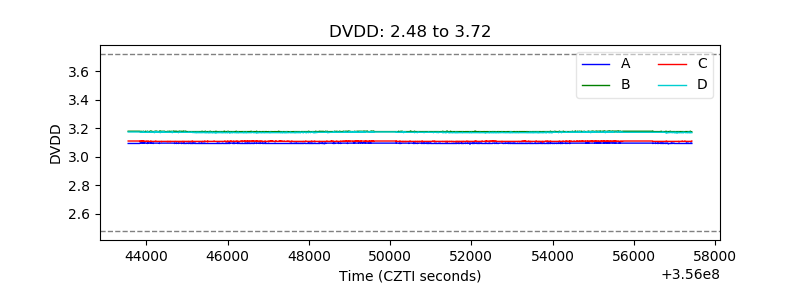 |
| Temperature 1 |  |
| Veto HV Monitor | 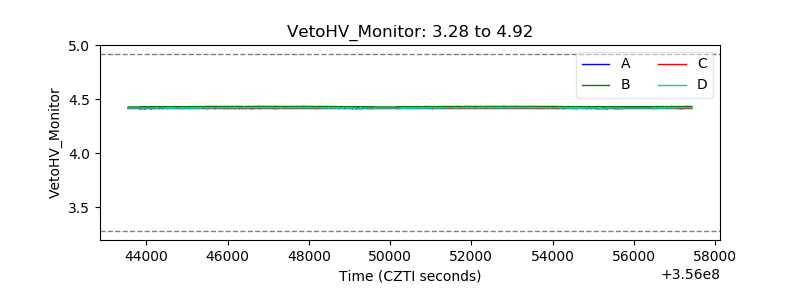 |
| Veto LLD | 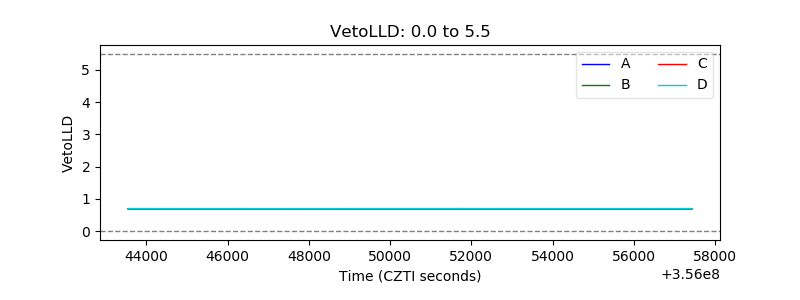 |
| Alpha Counter | 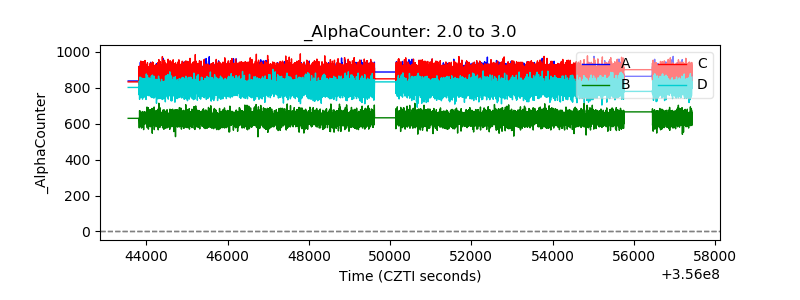 |
| _CPM_Rate | 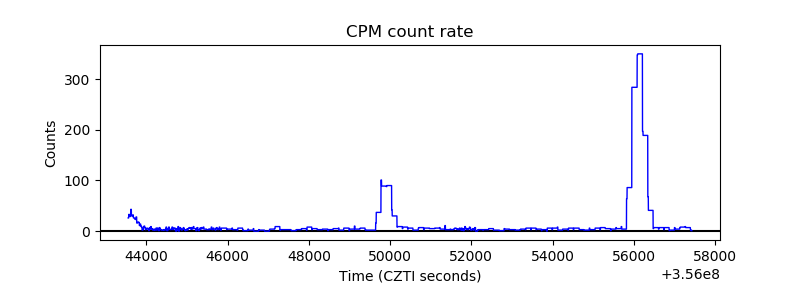 |
| CZT Counter | 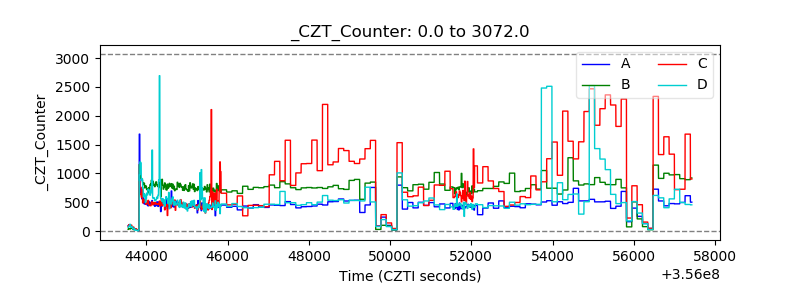 |
| +2.5 Volts monitor | 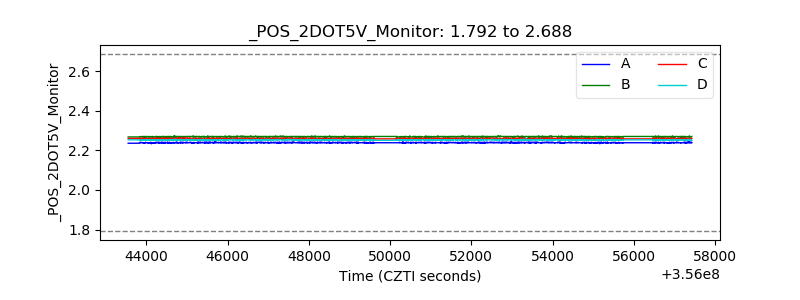 |
| +5 Volts monitor |  |
| _ROLL_ROT | 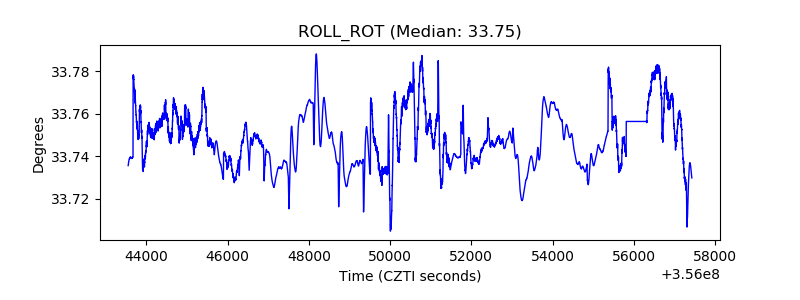 |
| _Roll_DEC | 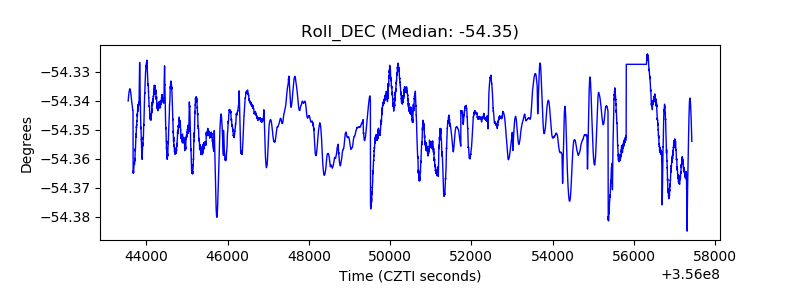 |
| _Roll_RA | 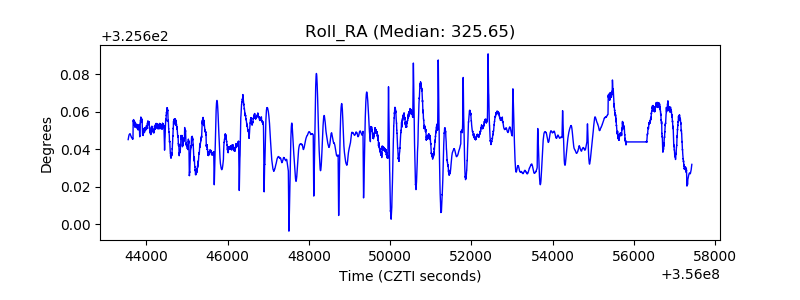 |
| Veto Counter | 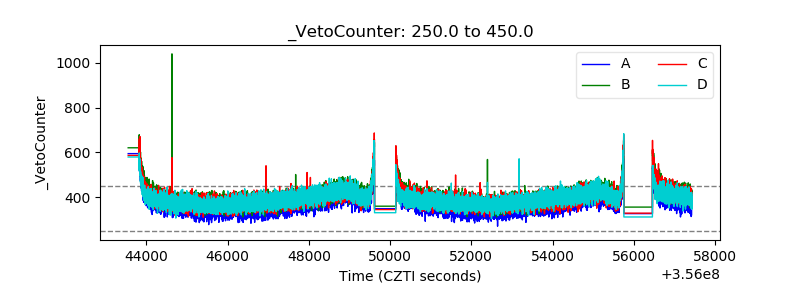 |