| Param | Original file | Final file |
|---|---|---|
| Filename | modeM0/AS1A10_053T06_9000004300_29972cztM0_level2.evt | modeM0/AS1A10_053T06_9000004300_29972cztM0_level2_quad_clean.evt |
| Size (bytes) | 107,124,480 | 17,991,360 |
| Size | 102.2 MB | 17.2 MB |
| Events in quadrant A | 505,142 | 122,528 |
| Events in quadrant B | 930,212 | 120,439 |
| Events in quadrant C | 1,232,897 | 108,948 |
| Events in quadrant D | 506,373 | 116,444 |
| Mode M0 | |||
|---|---|---|---|
| Quadrant | BADHDUFLAG | Total packets | Discarded packets |
| A | 0 | 2059 | 1 |
| B | 0 | 3403 | 1 |
| C | 0 | 4351 | 1 |
| D | 0 | 2083 | 1 |
| Mode M9 | |||
|---|---|---|---|
| Quadrant | BADHDUFLAG | Total packets | Discarded packets |
| A | 0 | 7 | 0 |
| B | 0 | 7 | 0 |
| C | 0 | 7 | 0 |
| D | 0 | 7 | 0 |
| Mode SS | |||
|---|---|---|---|
| Quadrant | BADHDUFLAG | Total packets | Discarded packets |
| A | 0 | 22 | 0 |
| B | 0 | 22 | 0 |
| C | 0 | 22 | 0 |
| D | 0 | 22 | 0 |
| Quadrant | Total seconds | Saturated seconds | Saturation percentage |
|---|---|---|---|
| A | 981 | 19 | 1.936799% |
| B | 981 | 39 | 3.975535% |
| C | 982 | 196 | 19.959267% |
| D | 982 | 14 | 1.425662% |
Noise dominated data is calculated using 1-second bins in cleaned event files. If a bin has >2000 counts, and if more than 50% of those come from <1% of pixels, then it is considered to be noise-dominated and hence unusable.
| Quadrant | # 1 sec bins | Bins with >0 counts | Bins with >2000 counts | High rate bins dominated by noise | Noise dominated (total time) | Noise dominated (detector-on time) | Marked lightcurve |
|---|---|---|---|---|---|---|---|
| A | 1686 | 982 | 2 | 2 | 0.12% | 0.20% | 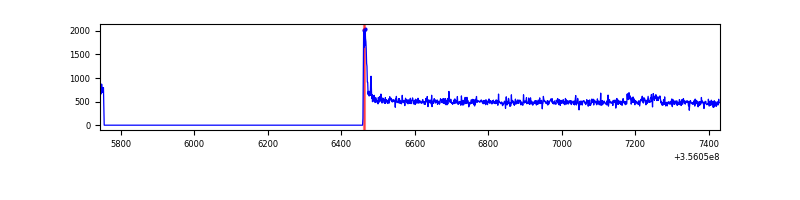 |
| B | 1686 | 982 | 1 | 1 | 0.06% | 0.10% | 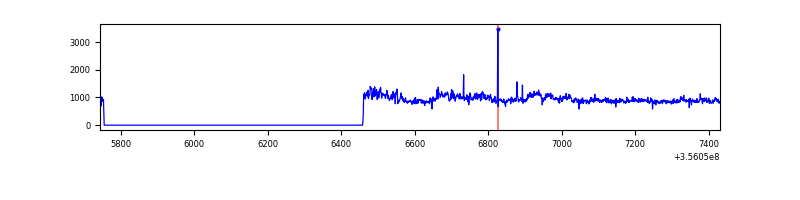 |
| C | 1687 | 983 | 67 | 67 | 3.97% | 6.82% | 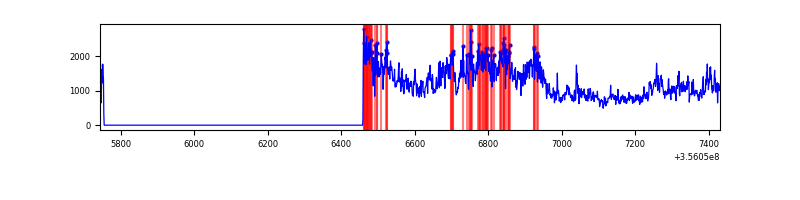 |
| D | 1687 | 983 | 1 | 1 | 0.06% | 0.10% | 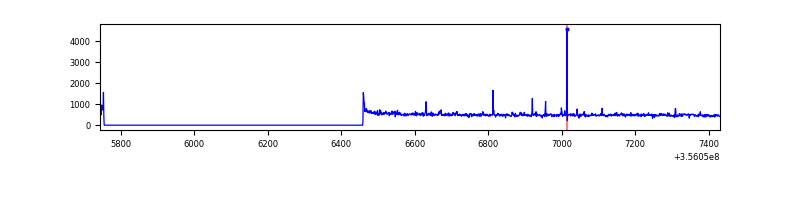 |
Top three noisy pixels from each quadrant. If the there are fewer than three noisy pixels in the level2.evt file, extra rows are filled as -1
| Pixel properties | Quadrant properties | ||||||
|---|---|---|---|---|---|---|---|
| Quadrant | DetID | PixID | Counts | Sigma | Mean | Median | Sigma |
| A | 8 | 192 | 13773 | 494.51 | 124 | 122 | 27.6 |
| A | 15 | 174 | 6771 | 240.86 | 124 | 122 | 27.6 |
| A | 13 | 254 | 1936 | 65.71 | 124 | 122 | 27.6 |
| B | 6 | 159 | 300131 | 11329.79 | 124 | 121 | 26.5 |
| B | 6 | 36 | 131592 | 4964.97 | 124 | 121 | 26.5 |
| B | 0 | 183 | 6260 | 231.84 | 124 | 121 | 26.5 |
| C | 3 | 233 | 766325 | 26302.83 | 114 | 114 | 29.1 |
| C | 14 | 238 | 18223 | 621.65 | 114 | 114 | 29.1 |
| C | 2 | 114 | 2217 | 72.19 | 114 | 114 | 29.1 |
| D | 8 | 195 | 23822 | 772.54 | 120 | 116 | 30.7 |
| D | 2 | 153 | 6978 | 223.61 | 120 | 116 | 30.7 |
| D | 1 | 52 | 4594 | 145.92 | 120 | 116 | 30.7 |
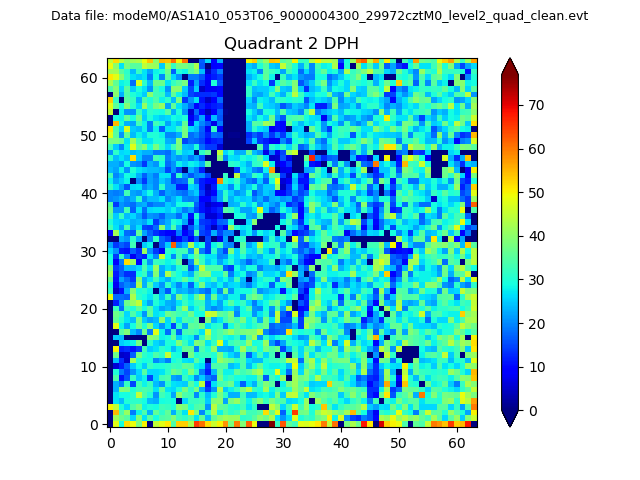
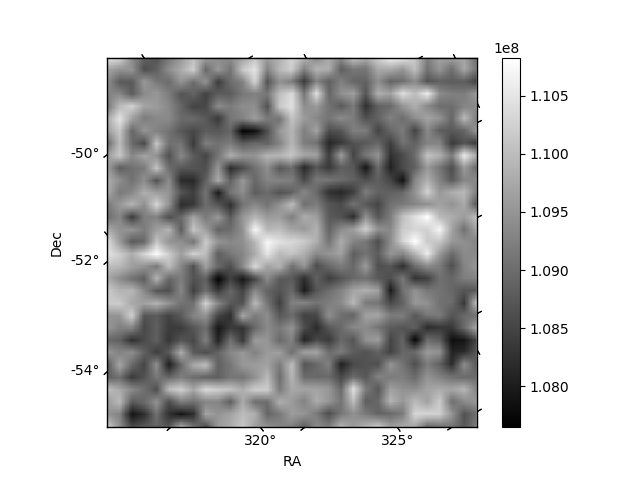
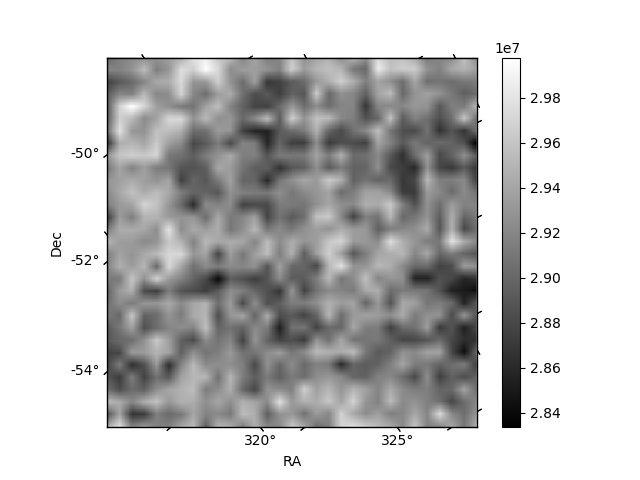
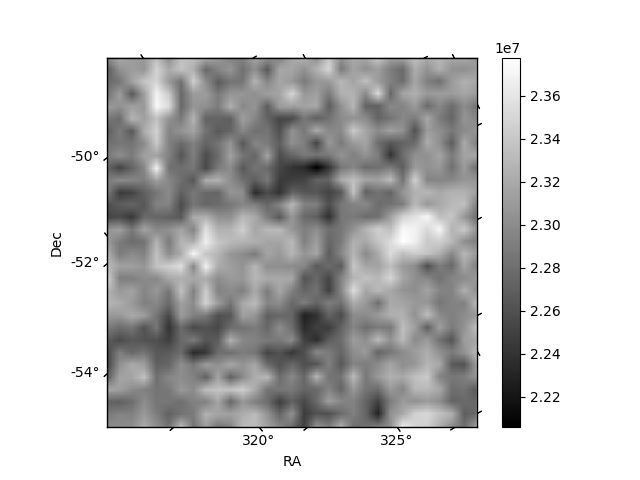
Histogram calculated using DETX and DETY for each event in the final _common_clean file
| Quadrant A | 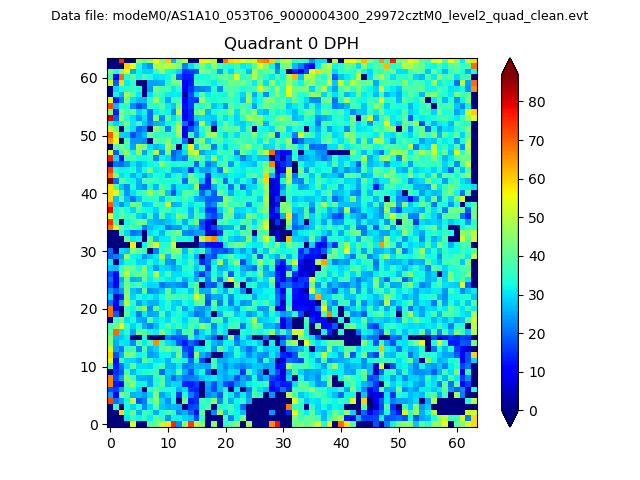 |
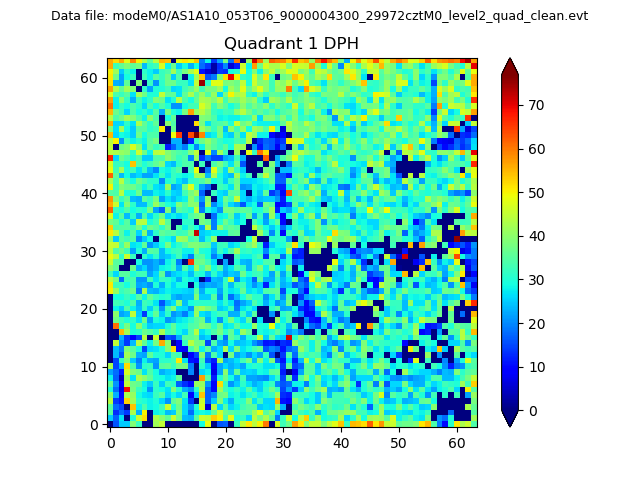 |
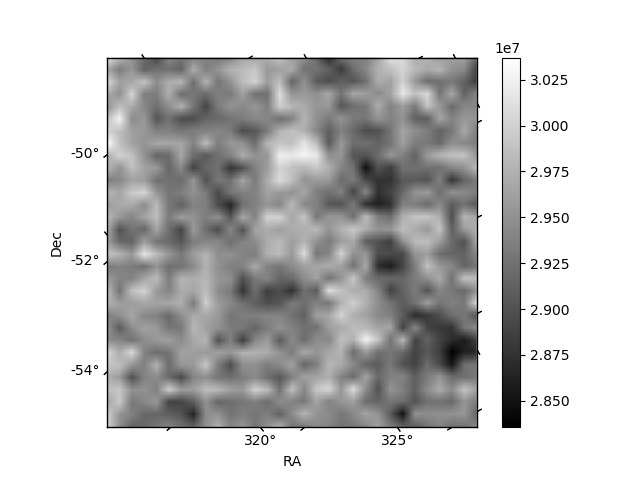
Quadrant B |
|---|---|---|---|
| Quadrant D | 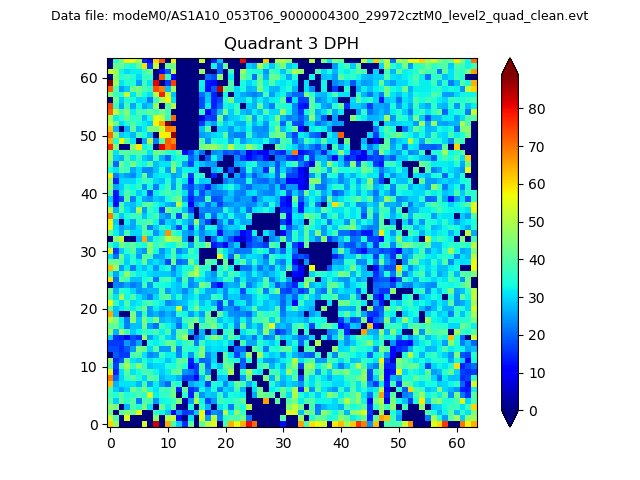 |
 |
Quadrant C |
| Plot type | Count rate plots | Images |
|---|---|---|
| Comparison with Poisson distribution Blue bars denote a histogram of data divided into 1 sec bins. Red curve is a Poisson curve with rate = median count rate of data. |
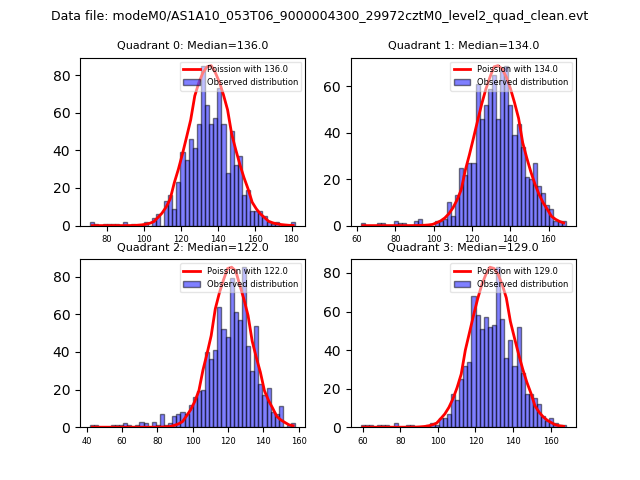 |
 |
| Quadrant-wise count rates Data is divided into 100 sec bins |
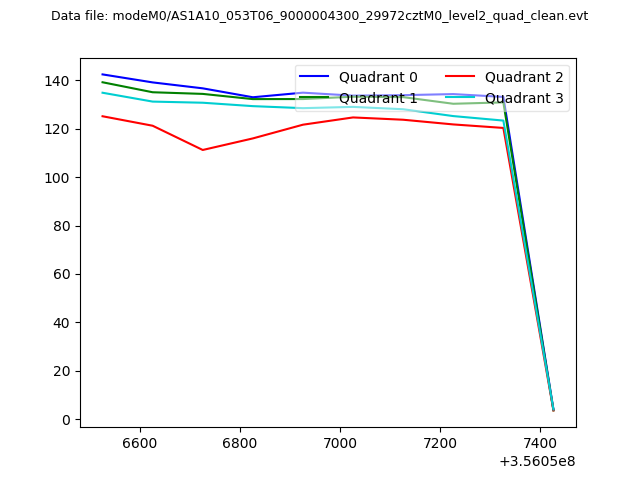 |
|
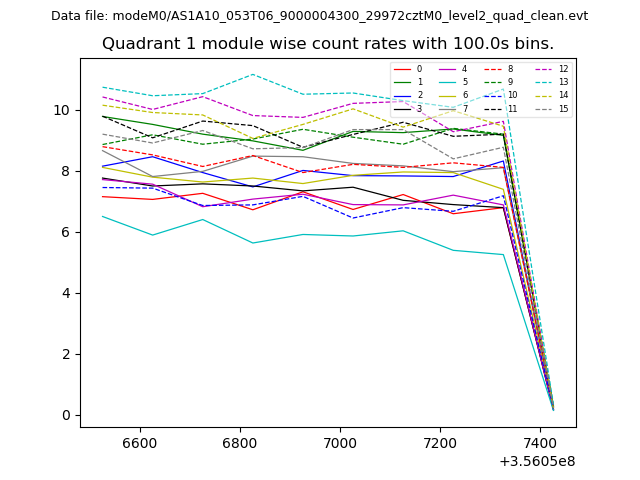
| Module-wise count rates for Quadrant A Data is divided into 100 sec bins |
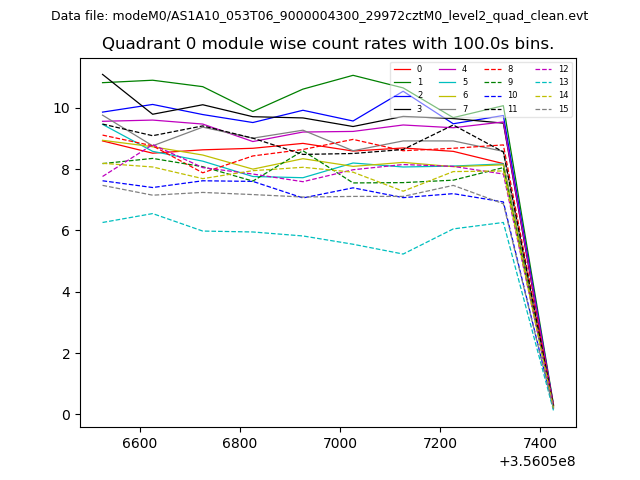 |
 |
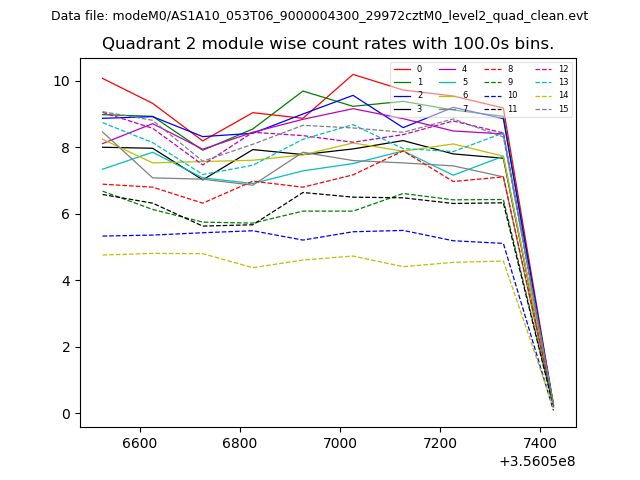
| Module-wise count rates for Quadrant B Data is divided into 100 sec bins |
 |
 |
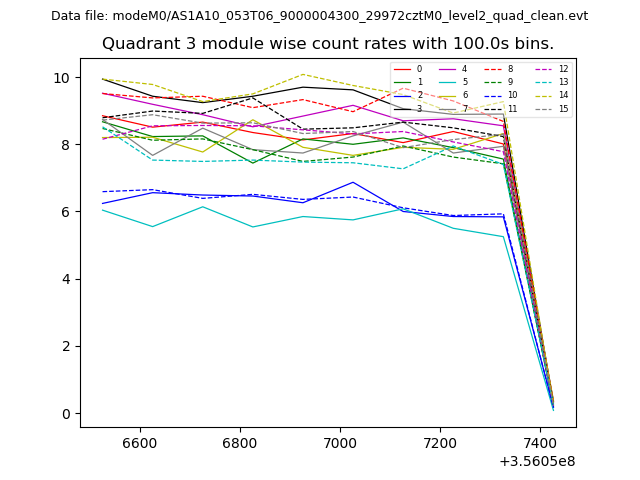
| Module-wise count rates for Quadrant C Data is divided into 100 sec bins |
 |
 |
| Module-wise count rates for Quadrant D Data is divided into 100 sec bins |
 |
 |
| Parameter | Plot |
|---|---|
| CZT HV Monitor | 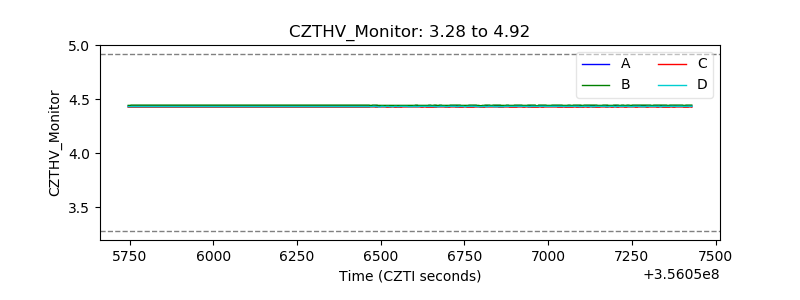 |
| D_VDD | 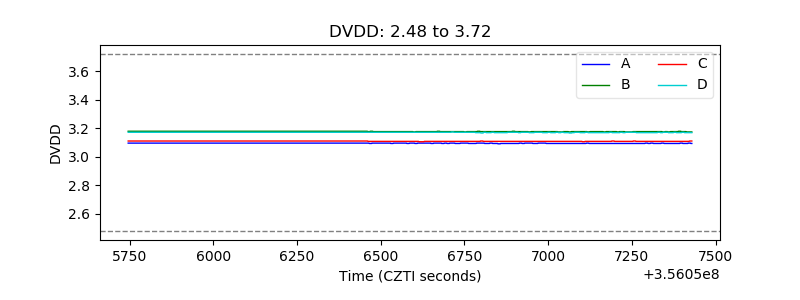 |
| Temperature 1 | 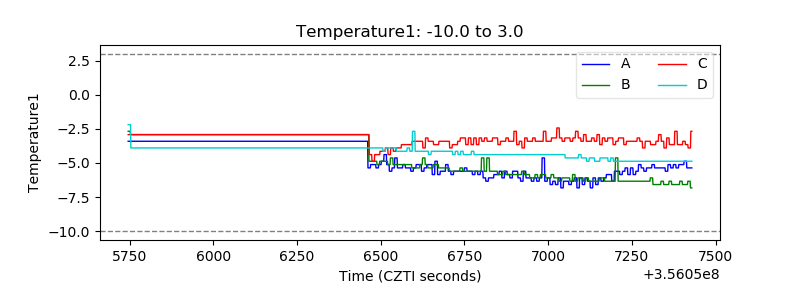 |
| Veto HV Monitor | 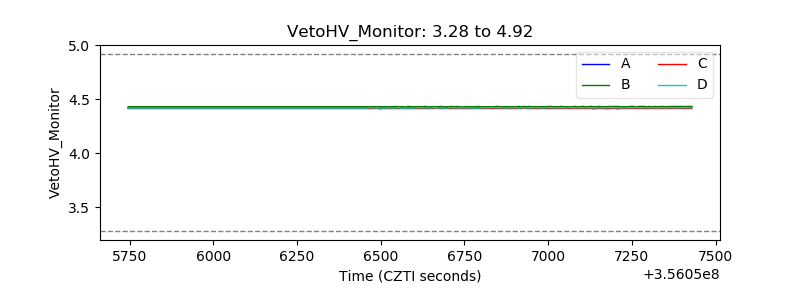 |
| Veto LLD | 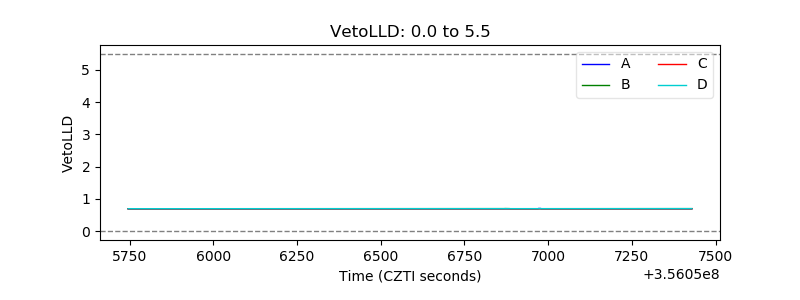 |
| Alpha Counter | 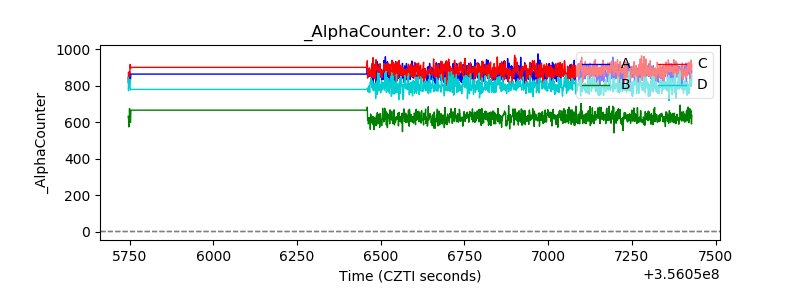 |
| _CPM_Rate | 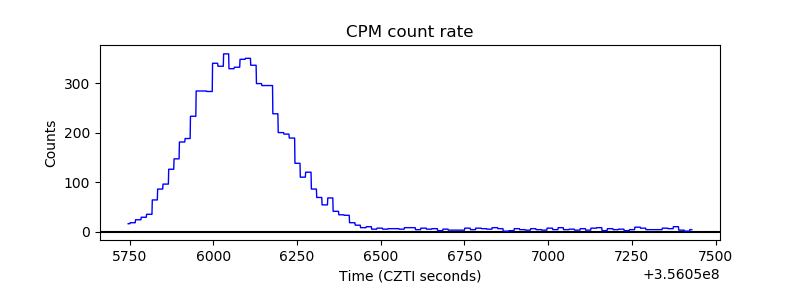 |
| CZT Counter | 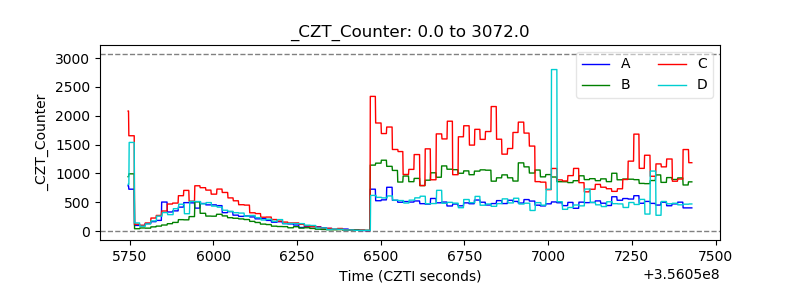 |
| +2.5 Volts monitor |  |
| +5 Volts monitor |  |
| _ROLL_ROT | 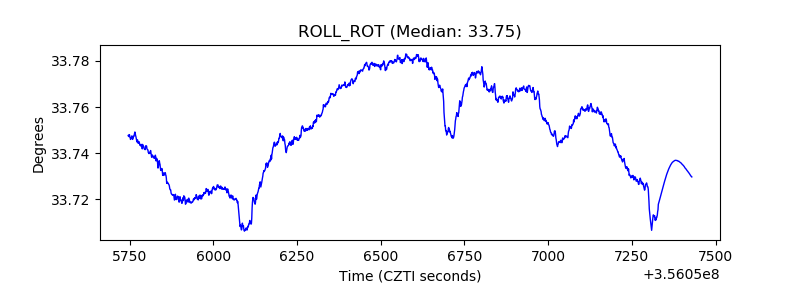 |
| _Roll_DEC | 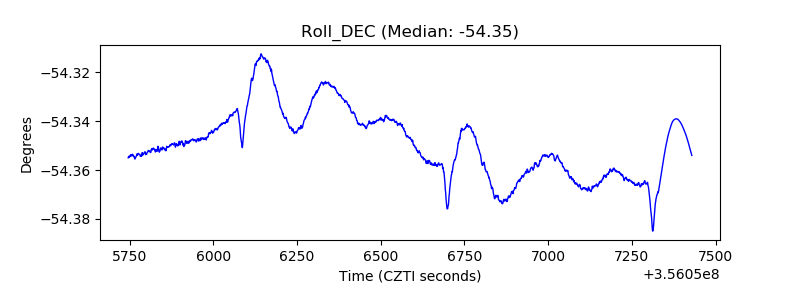 |
| _Roll_RA | 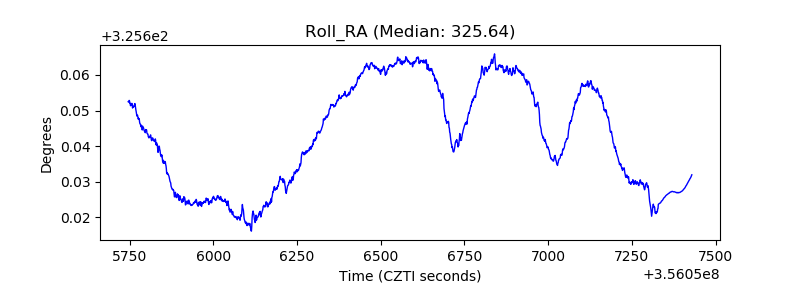 |
| Veto Counter | 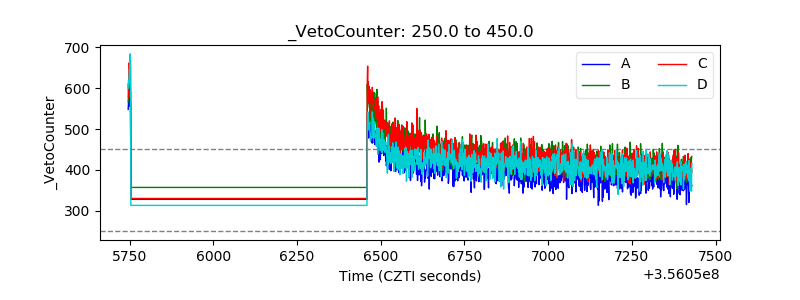 |