| Param | Original file | Final file |
|---|---|---|
| Filename | modeM0/AS1A10_053T11_9000004302_29972cztM0_level2.evt | modeM0/AS1A10_053T11_9000004302_29972cztM0_level2_quad_clean.evt |
| Size (bytes) | 441,057,600 | 40,245,120 |
| Size | 420.6 MB | 38.4 MB |
| Events in quadrant A | 2,661,775 | 212,335 |
| Events in quadrant B | 4,532,691 | 210,023 |
| Events in quadrant C | 2,705,320 | 206,369 |
| Events in quadrant D | 3,084,595 | 204,481 |
| Mode M9 | |||
|---|---|---|---|
| Quadrant | BADHDUFLAG | Total packets | Discarded packets |
| A | 0 | 8 | 0 |
| B | 0 | 8 | 0 |
| C | 0 | 8 | 0 |
| D | 0 | 8 | 0 |
| Mode SS | |||
|---|---|---|---|
| Quadrant | BADHDUFLAG | Total packets | Discarded packets |
| A | 0 | 114 | 0 |
| B | 0 | 114 | 0 |
| C | 0 | 114 | 0 |
| D | 0 | 114 | 0 |
| Mode M0 | |||
|---|---|---|---|
| Quadrant | BADHDUFLAG | Total packets | Discarded packets |
| A | 0 | 11412 | 1 |
| B | 0 | 17125 | 1 |
| C | 0 | 11301 | 1 |
| D | 0 | 12571 | 1 |
| Quadrant | Total seconds | Saturated seconds | Saturation percentage |
|---|---|---|---|
| A | 5488 | 27 | 0.491983% |
| B | 5488 | 82 | 1.494169% |
| C | 5488 | 53 | 0.965743% |
| D | 5488 | 71 | 1.293732% |
Noise dominated data is calculated using 1-second bins in cleaned event files. If a bin has >2000 counts, and if more than 50% of those come from <1% of pixels, then it is considered to be noise-dominated and hence unusable.
| Quadrant | # 1 sec bins | Bins with >0 counts | Bins with >2000 counts | High rate bins dominated by noise | Noise dominated (total time) | Noise dominated (detector-on time) | Marked lightcurve |
|---|---|---|---|---|---|---|---|
| A | 6343 | 5489 | 7 | 7 | 0.11% | 0.13% | 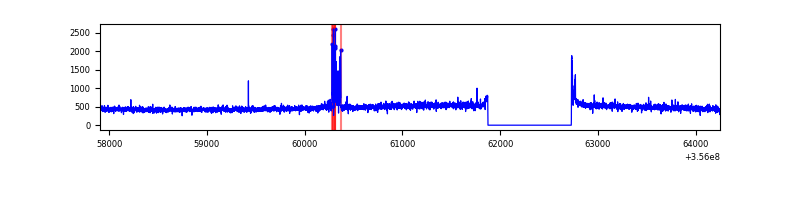 |
| B | 6343 | 5489 | 2 | 2 | 0.03% | 0.04% | 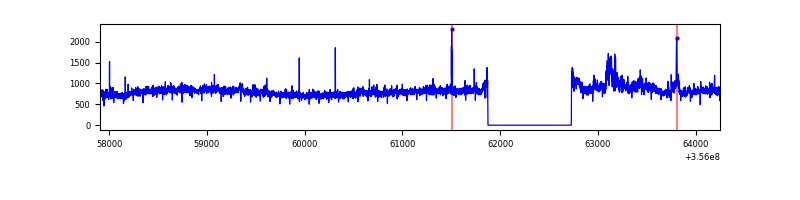 |
| C | 6343 | 5489 | 0 | 0 | 0.00% | 0.00% | 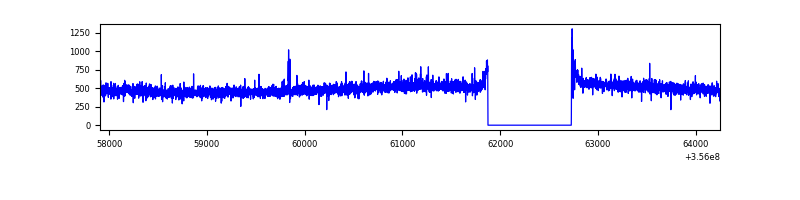 |
| D | 6343 | 5489 | 50 | 50 | 0.79% | 0.91% | 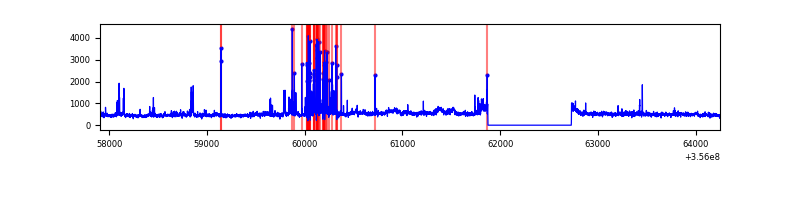 |
Top three noisy pixels from each quadrant. If the there are fewer than three noisy pixels in the level2.evt file, extra rows are filled as -1
| Pixel properties | Quadrant properties | ||||||
|---|---|---|---|---|---|---|---|
| Quadrant | DetID | PixID | Counts | Sigma | Mean | Median | Sigma |
| A | 12 | 96 | 61037 | 453.98 | 667 | 654 | 133.0 |
| A | 8 | 192 | 12645 | 90.15 | 667 | 654 | 133.0 |
| A | 13 | 254 | 10064 | 70.75 | 667 | 654 | 133.0 |
| B | 6 | 159 | 1604797 | 12559.45 | 657 | 640 | 127.7 |
| B | 6 | 36 | 331852 | 2593.16 | 657 | 640 | 127.7 |
| B | 12 | 111 | 15746 | 118.27 | 657 | 640 | 127.7 |
| C | 14 | 238 | 104364 | 675.54 | 646 | 650 | 153.5 |
| C | 3 | 233 | 65682 | 423.59 | 646 | 650 | 153.5 |
| C | 2 | 114 | 12570 | 77.64 | 646 | 650 | 153.5 |
| D | 8 | 195 | 256681 | 1657.61 | 650 | 633 | 154.5 |
| D | 12 | 233 | 240134 | 1550.48 | 650 | 633 | 154.5 |
| D | 13 | 249 | 53687 | 343.46 | 650 | 633 | 154.5 |
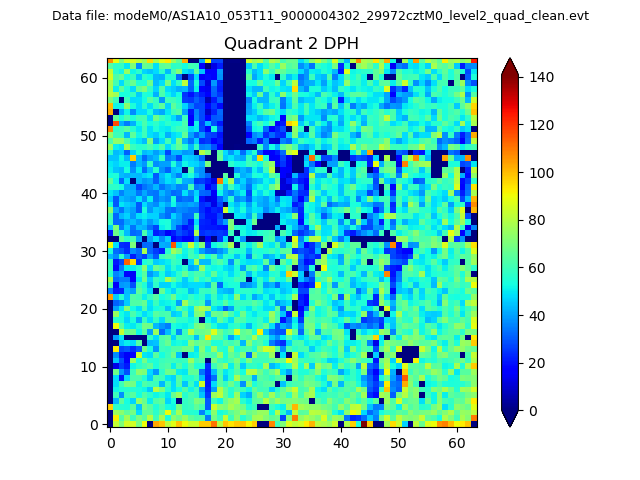
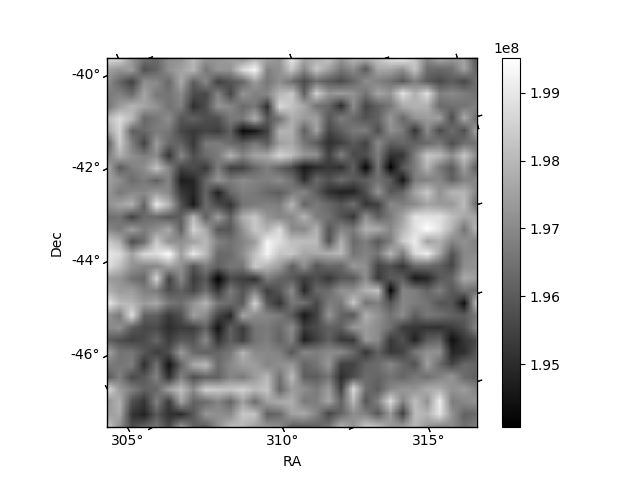
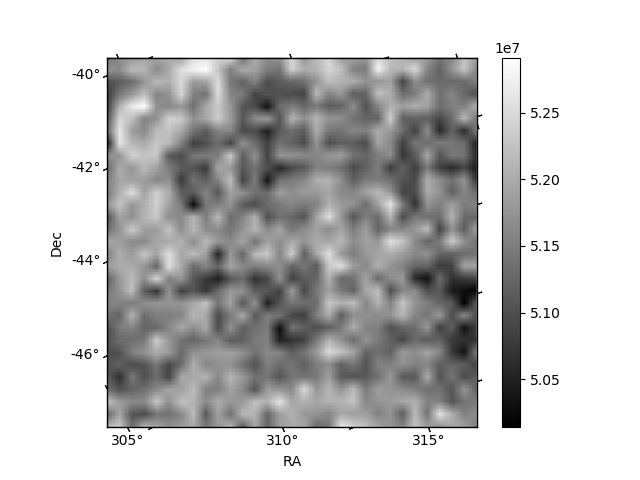
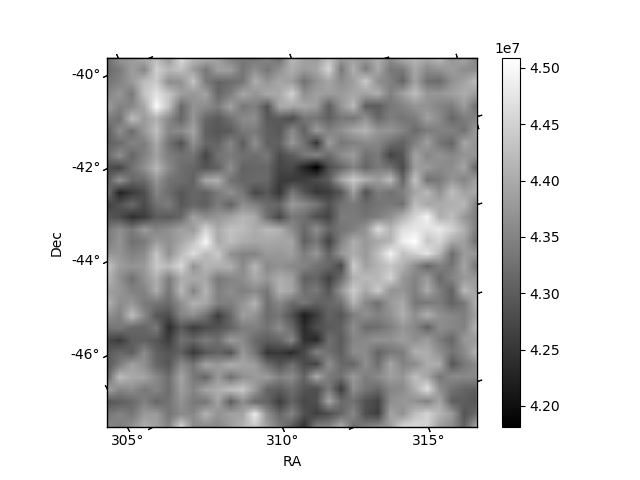
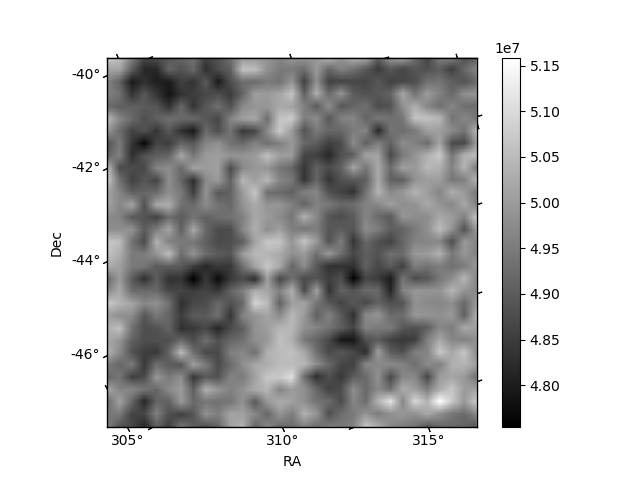
Histogram calculated using DETX and DETY for each event in the final _common_clean file
| Quadrant A | 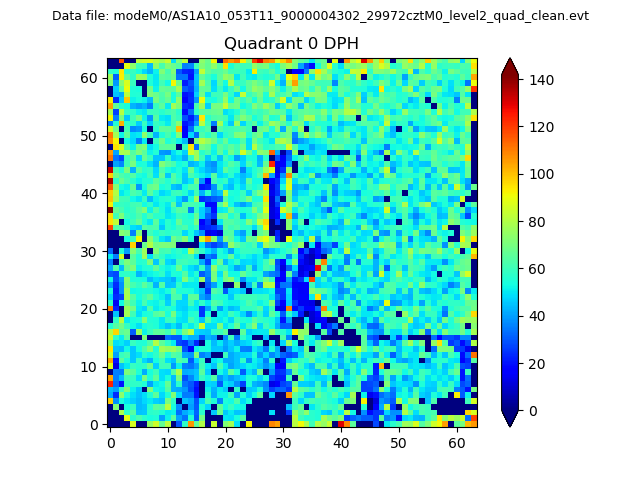 |
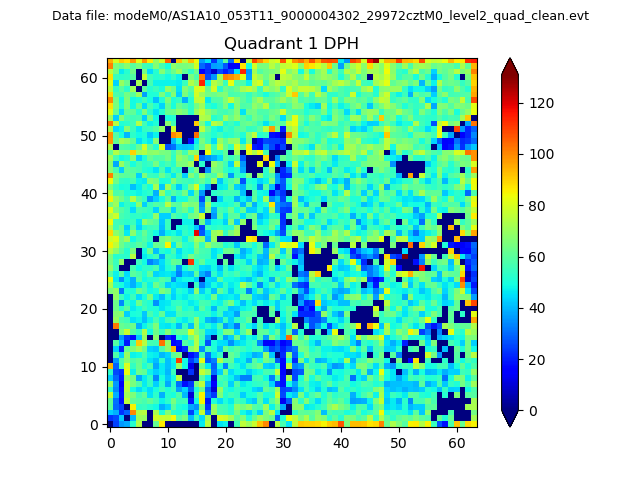 |
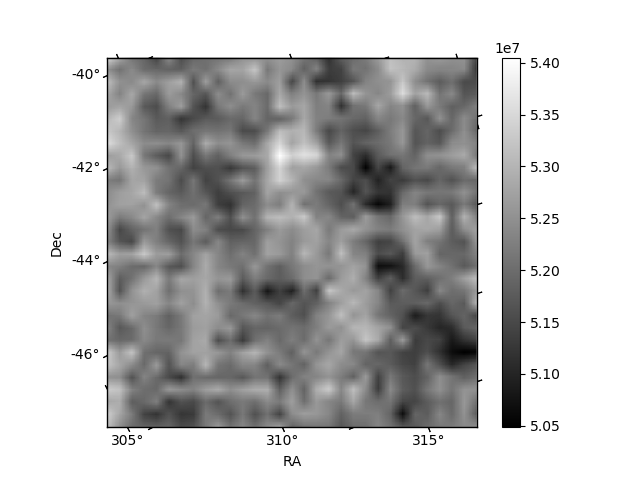
Quadrant B |
|---|---|---|---|
| Quadrant D | 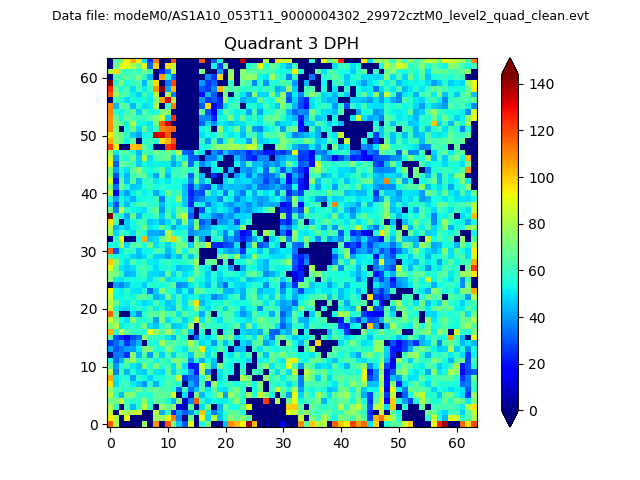 |
 |
Quadrant C |
| Plot type | Count rate plots | Images |
|---|---|---|
| Comparison with Poisson distribution Blue bars denote a histogram of data divided into 1 sec bins. Red curve is a Poisson curve with rate = median count rate of data. |
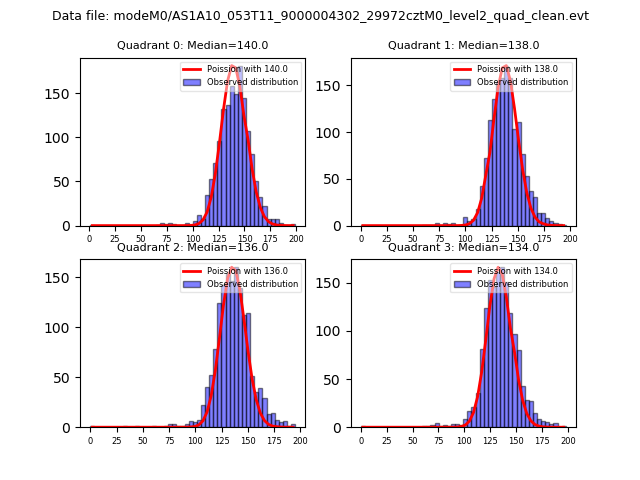 |
 |
| Quadrant-wise count rates Data is divided into 100 sec bins |
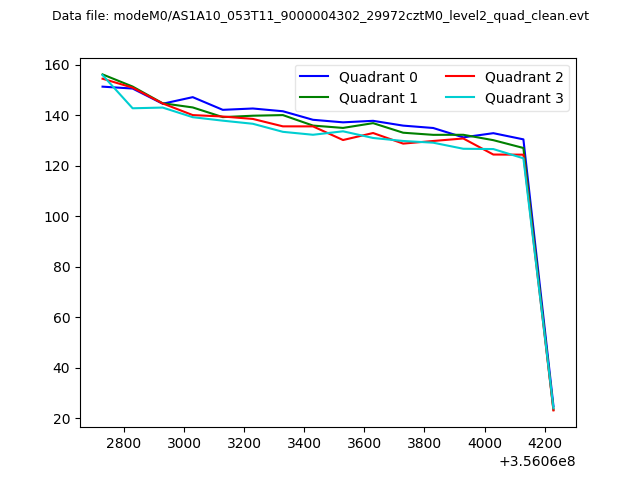 |
|
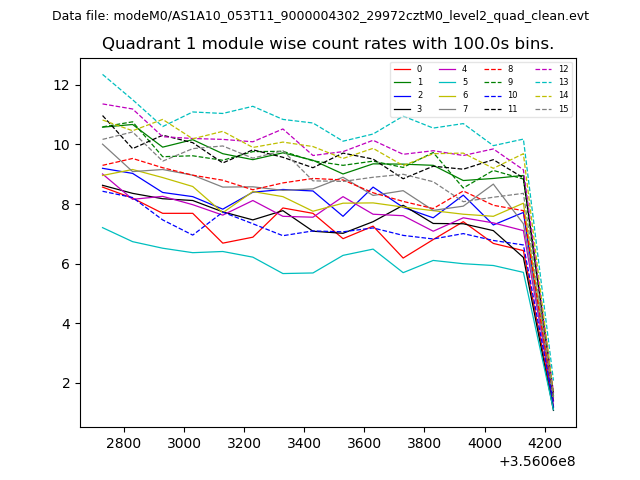
| Module-wise count rates for Quadrant A Data is divided into 100 sec bins |
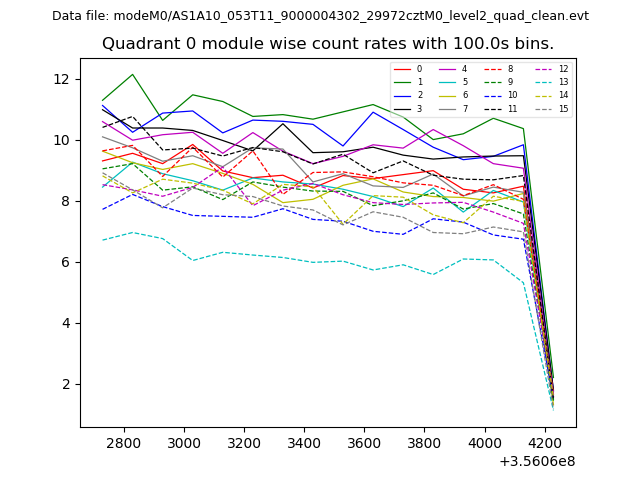 |
 |
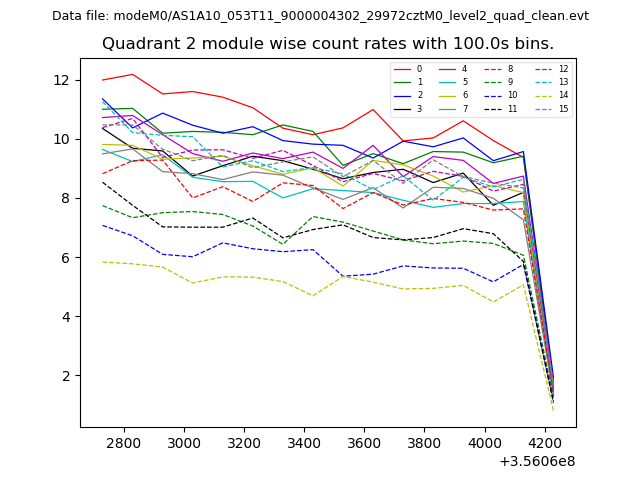
| Module-wise count rates for Quadrant B Data is divided into 100 sec bins |
 |
 |
| Module-wise count rates for Quadrant C Data is divided into 100 sec bins |
 |
 |
| Module-wise count rates for Quadrant D Data is divided into 100 sec bins |
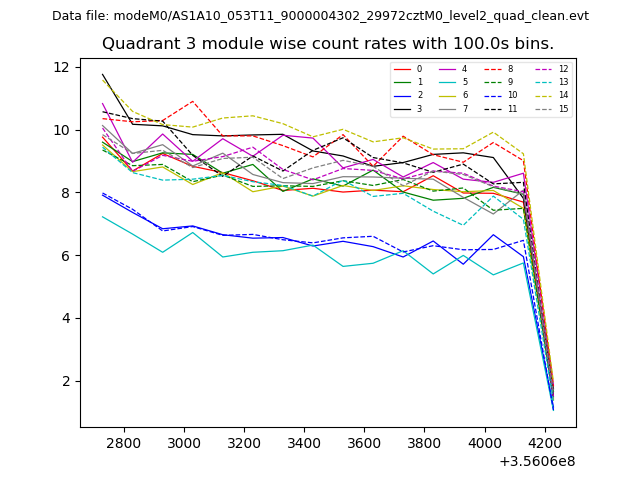 |
 |
| Parameter | Plot |
|---|---|
| CZT HV Monitor | 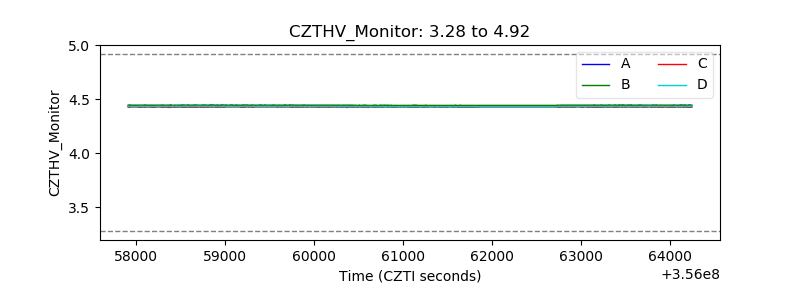 |
| D_VDD | 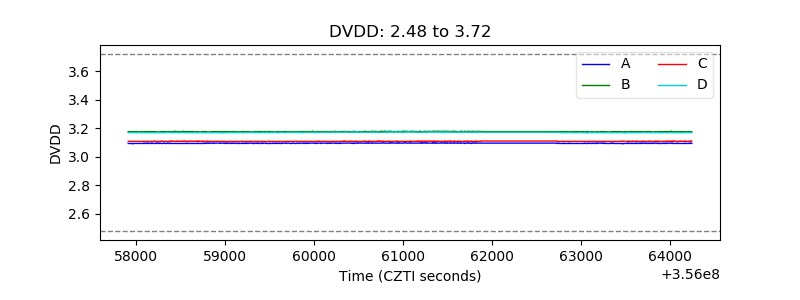 |
| Temperature 1 | 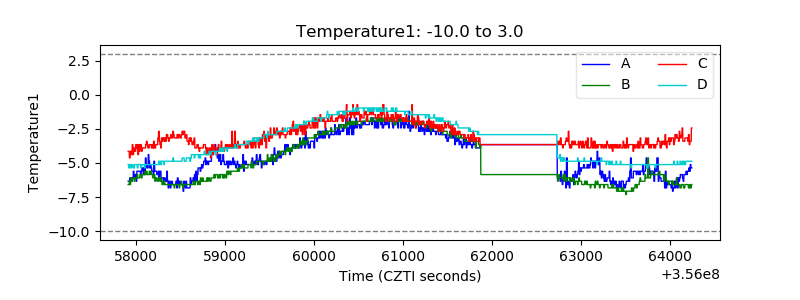 |
| Veto HV Monitor | 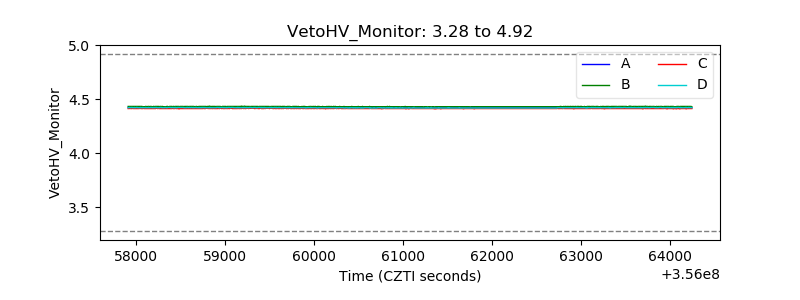 |
| Veto LLD | 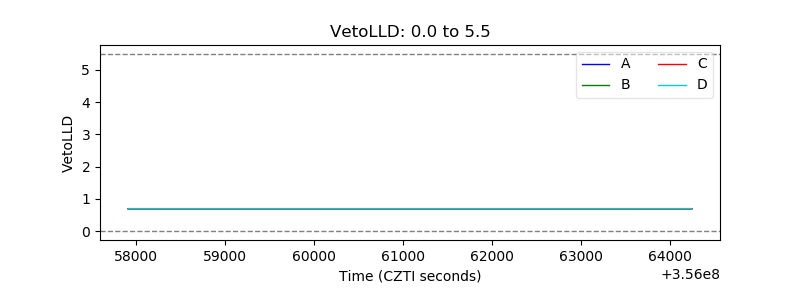 |
| Alpha Counter | 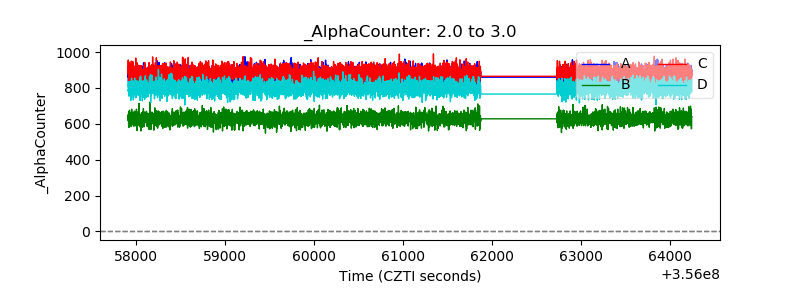 |
| _CPM_Rate | 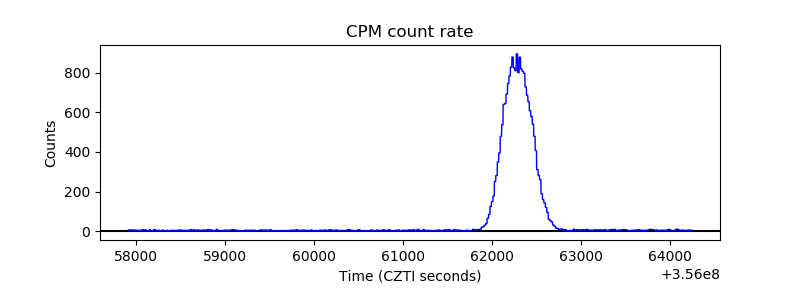 |
| CZT Counter | 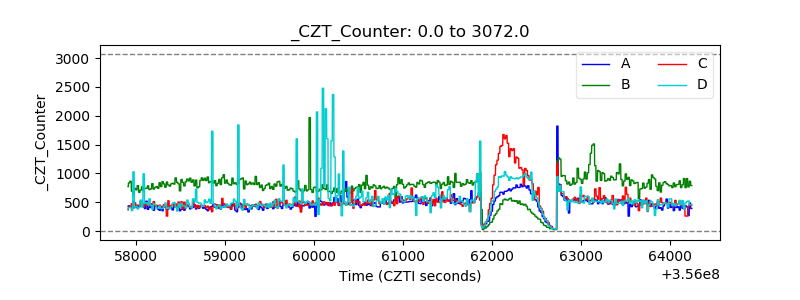 |
| +2.5 Volts monitor |  |
| +5 Volts monitor |  |
| _ROLL_ROT | 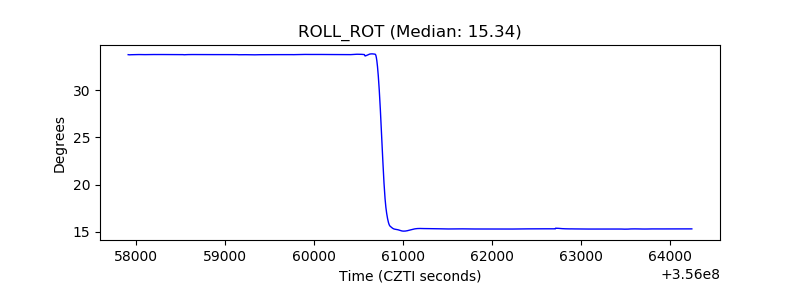 |
| _Roll_DEC | 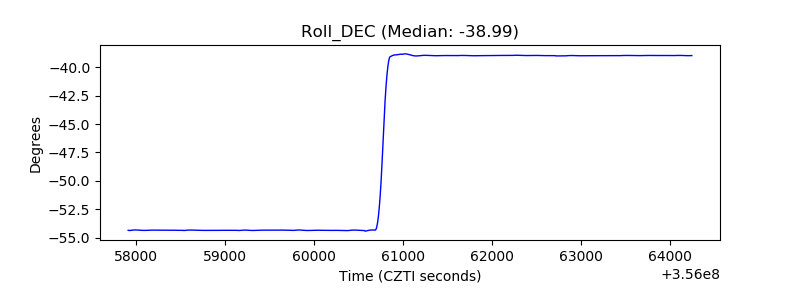 |
| _Roll_RA | 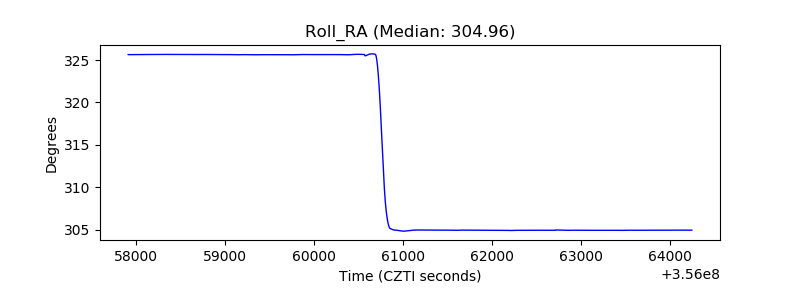 |
| Veto Counter | 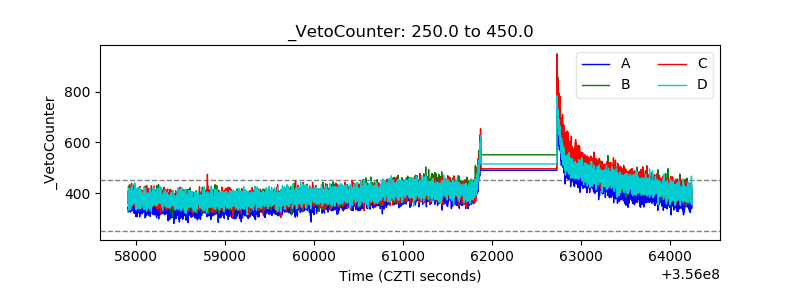 |