| Param | Original file | Final file |
|---|---|---|
| Filename | modeM0/AS1A10_053T11_9000004302_29973cztM0_level2.evt | modeM0/AS1A10_053T11_9000004302_29973cztM0_level2_quad_clean.evt |
| Size (bytes) | 503,527,680 | 89,994,240 |
| Size | 480.2 MB | 85.8 MB |
| Events in quadrant A | 3,059,126 | 581,179 |
| Events in quadrant B | 5,192,183 | 576,628 |
| Events in quadrant C | 3,252,364 | 566,763 |
| Events in quadrant D | 3,316,547 | 558,926 |
| Mode M9 | |||
|---|---|---|---|
| Quadrant | BADHDUFLAG | Total packets | Discarded packets |
| A | 0 | 10 | 0 |
| B | 0 | 10 | 0 |
| C | 0 | 10 | 0 |
| D | 0 | 10 | 0 |
| Mode SS | |||
|---|---|---|---|
| Quadrant | BADHDUFLAG | Total packets | Discarded packets |
| A | 0 | 128 | 0 |
| B | 0 | 128 | 0 |
| C | 0 | 128 | 0 |
| D | 0 | 128 | 0 |
| Mode M0 | |||
|---|---|---|---|
| Quadrant | BADHDUFLAG | Total packets | Discarded packets |
| A | 0 | 13016 | 1 |
| B | 0 | 19744 | 1 |
| C | 0 | 13328 | 1 |
| D | 0 | 13669 | 1 |
| Quadrant | Total seconds | Saturated seconds | Saturation percentage |
|---|---|---|---|
| A | 6332 | 21 | 0.331649% |
| B | 6333 | 84 | 1.326386% |
| C | 6333 | 86 | 1.357966% |
| D | 6333 | 47 | 0.742144% |
Noise dominated data is calculated using 1-second bins in cleaned event files. If a bin has >2000 counts, and if more than 50% of those come from <1% of pixels, then it is considered to be noise-dominated and hence unusable.
| Quadrant | # 1 sec bins | Bins with >0 counts | Bins with >2000 counts | High rate bins dominated by noise | Noise dominated (total time) | Noise dominated (detector-on time) | Marked lightcurve |
|---|---|---|---|---|---|---|---|
| A | 7337 | 6333 | 0 | 0 | 0.00% | 0.00% | 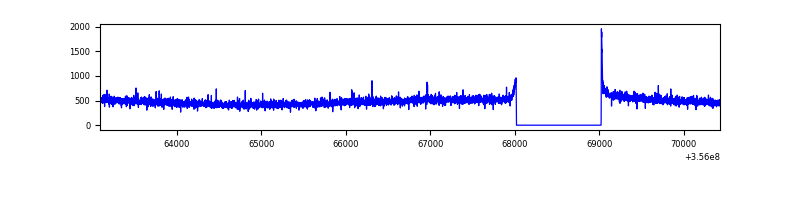 |
| B | 7338 | 6334 | 4 | 4 | 0.05% | 0.06% | 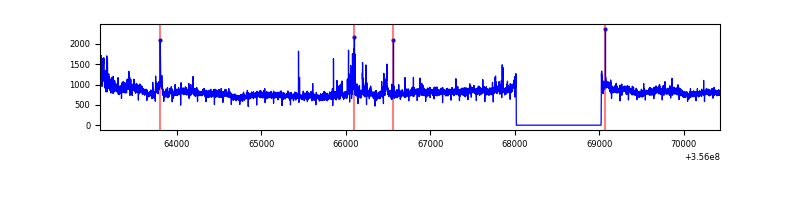 |
| C | 7338 | 6334 | 0 | 0 | 0.00% | 0.00% | 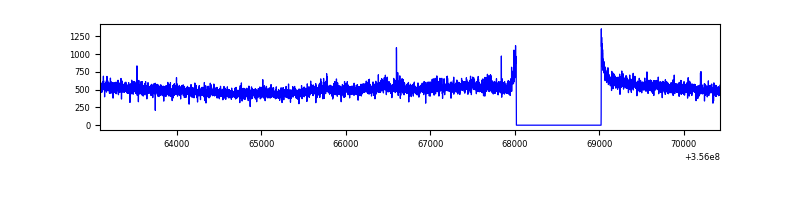 |
| D | 7338 | 6334 | 23 | 23 | 0.31% | 0.36% | 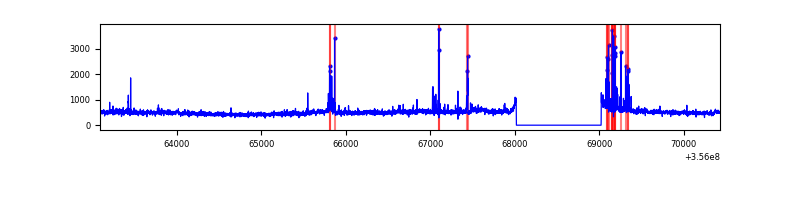 |
Top three noisy pixels from each quadrant. If the there are fewer than three noisy pixels in the level2.evt file, extra rows are filled as -1
| Pixel properties | Quadrant properties | ||||||
|---|---|---|---|---|---|---|---|
| Quadrant | DetID | PixID | Counts | Sigma | Mean | Median | Sigma |
| A | 8 | 192 | 14015 | 83.94 | 787 | 770 | 157.8 |
| A | 13 | 254 | 11450 | 67.68 | 787 | 770 | 157.8 |
| A | 3 | 137 | 7703 | 43.94 | 787 | 770 | 157.8 |
| B | 6 | 159 | 1853216 | 12358.12 | 778 | 758 | 149.9 |
| B | 6 | 36 | 267304 | 1778.18 | 778 | 758 | 149.9 |
| B | 12 | 111 | 17926 | 114.53 | 778 | 758 | 149.9 |
| C | 3 | 233 | 141241 | 782.52 | 763 | 769 | 179.5 |
| C | 14 | 238 | 122685 | 679.15 | 763 | 769 | 179.5 |
| C | 2 | 114 | 14994 | 79.24 | 763 | 769 | 179.5 |
| D | 8 | 195 | 227435 | 1248.2 | 769 | 750 | 181.6 |
| D | 2 | 250 | 108318 | 592.3 | 769 | 750 | 181.6 |
| D | 12 | 233 | 37357 | 201.57 | 769 | 750 | 181.6 |
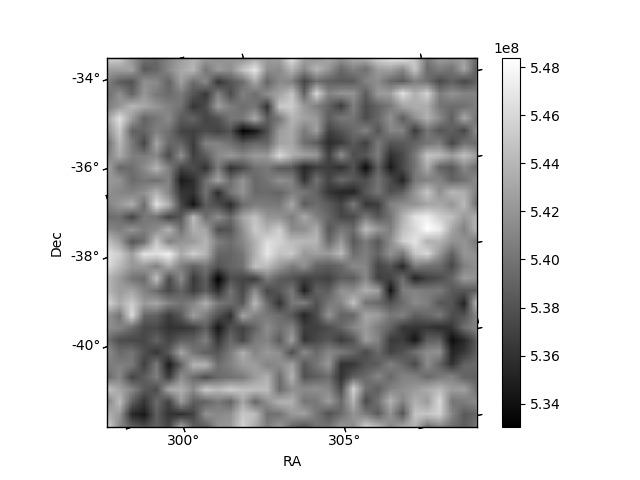
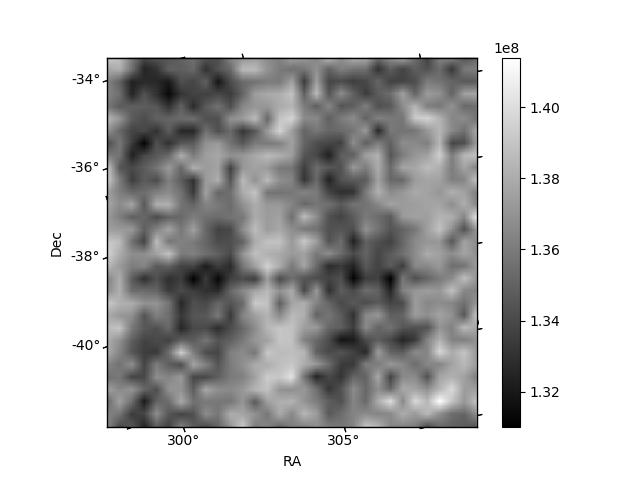
Histogram calculated using DETX and DETY for each event in the final _common_clean file
| Quadrant A | 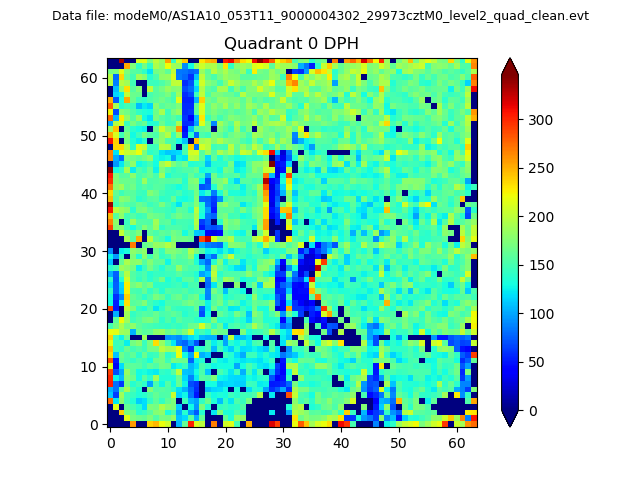 |
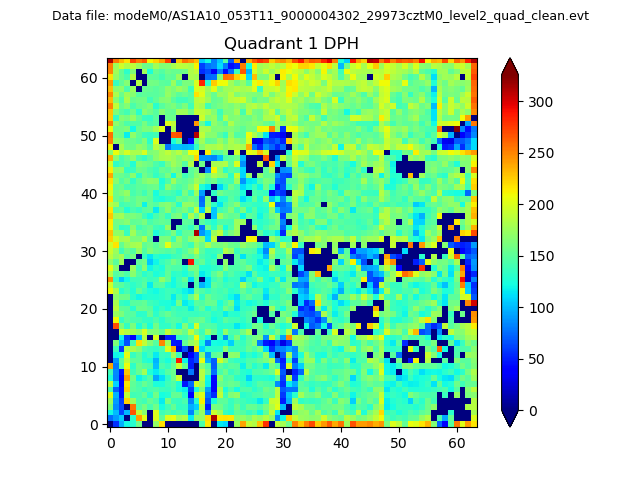 |
Quadrant B |
|---|---|---|---|
| Quadrant D | 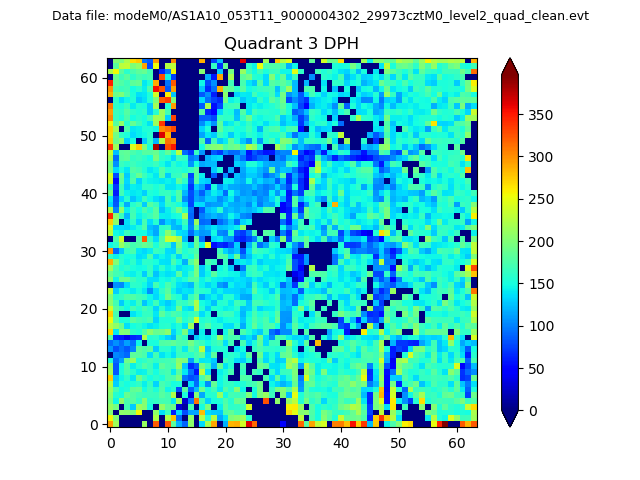 |
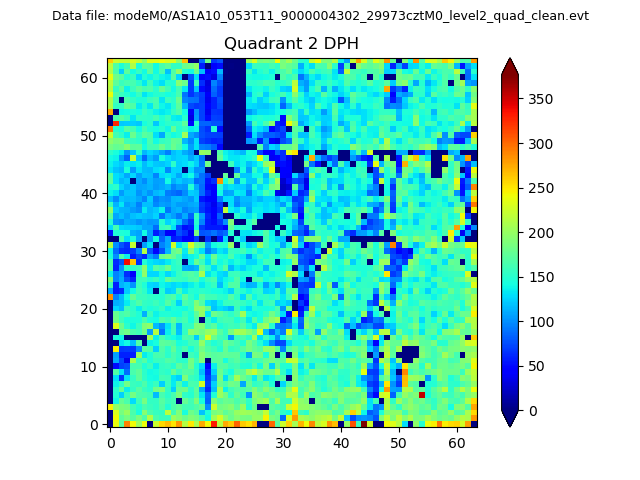 |
Quadrant C |
| Plot type | Count rate plots | Images |
|---|---|---|
| Comparison with Poisson distribution Blue bars denote a histogram of data divided into 1 sec bins. Red curve is a Poisson curve with rate = median count rate of data. |
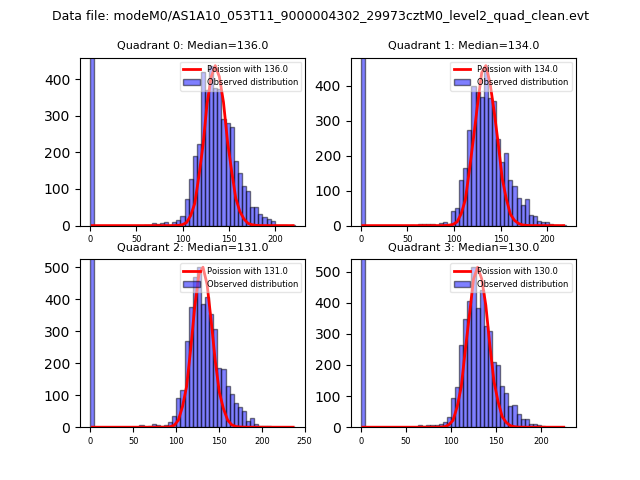 |
 |
| Quadrant-wise count rates Data is divided into 100 sec bins |
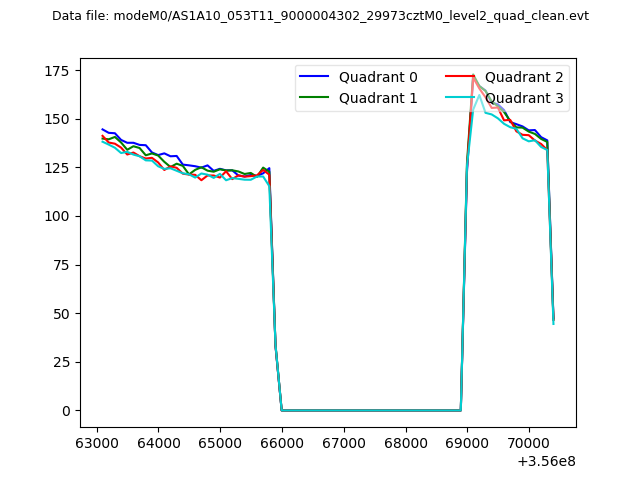 |
|
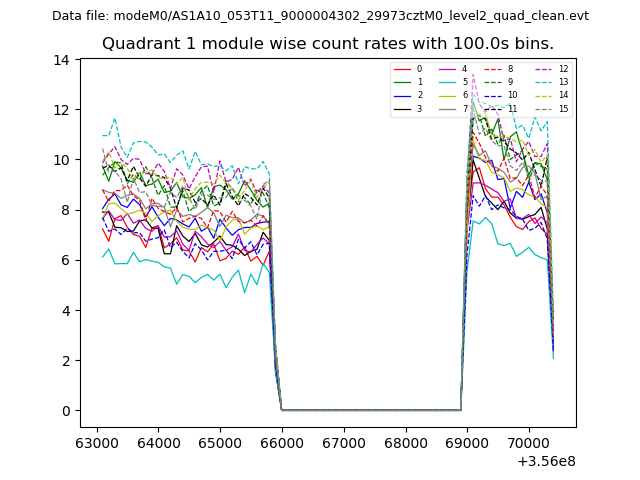
| Module-wise count rates for Quadrant A Data is divided into 100 sec bins |
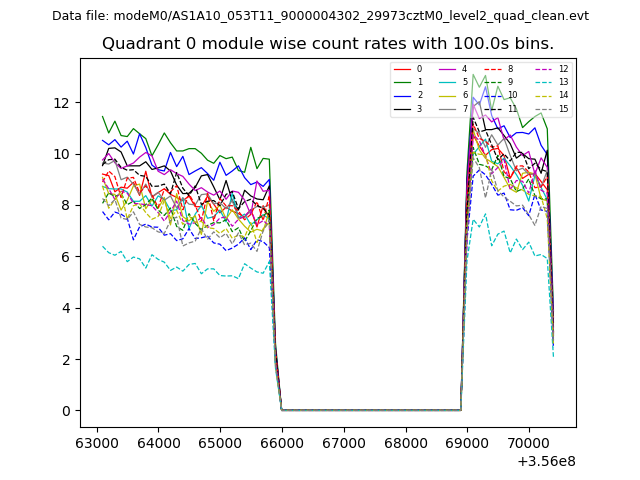 |
 |
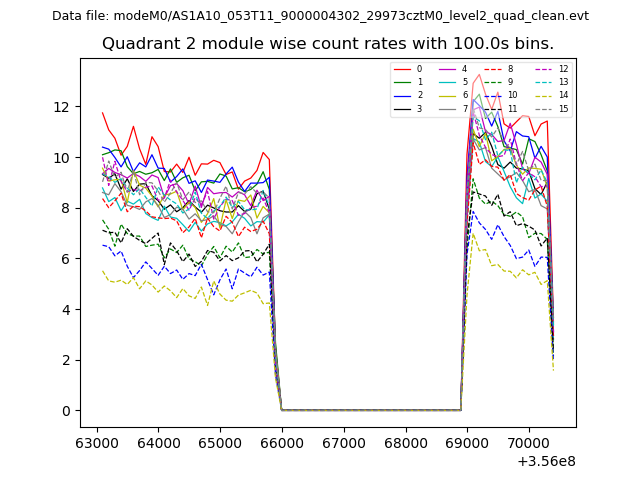
| Module-wise count rates for Quadrant B Data is divided into 100 sec bins |
 |
 |
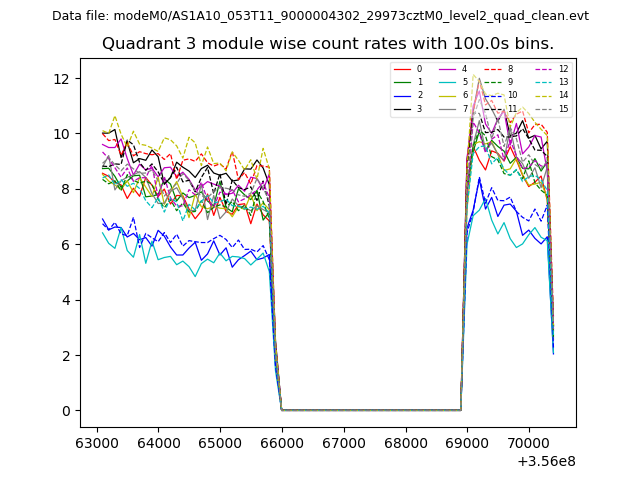
| Module-wise count rates for Quadrant C Data is divided into 100 sec bins |
 |
 |
| Module-wise count rates for Quadrant D Data is divided into 100 sec bins |
 |
 |
| Parameter | Plot |
|---|---|
| CZT HV Monitor | 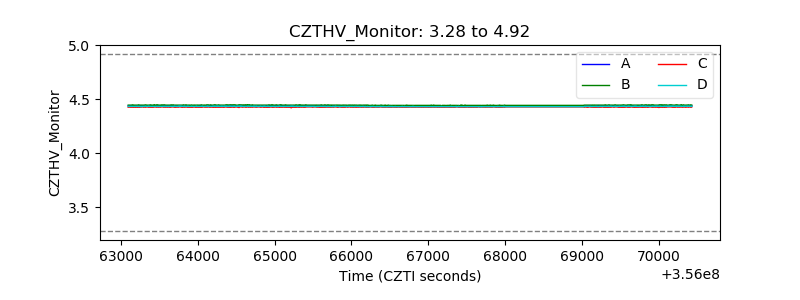 |
| D_VDD | 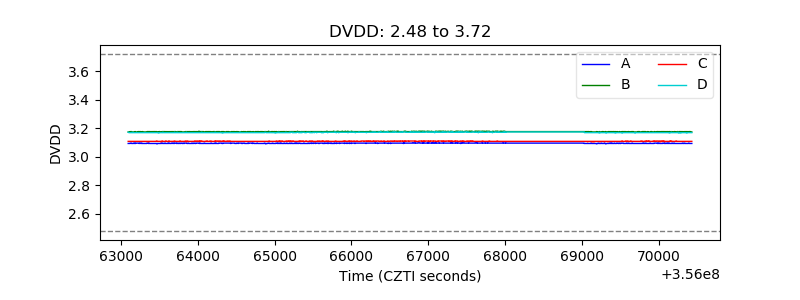 |
| Temperature 1 | 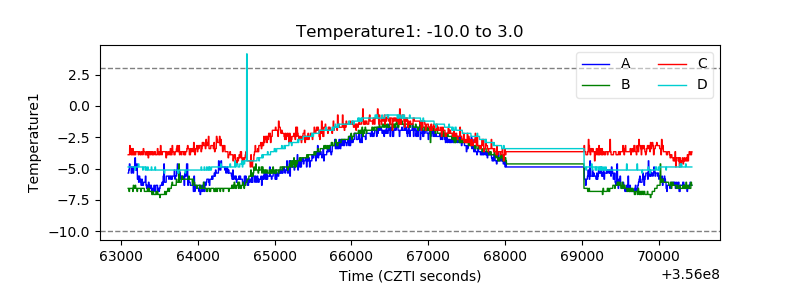 |
| Veto HV Monitor | 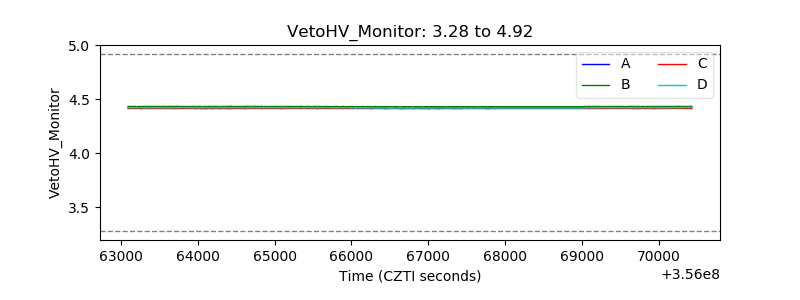 |
| Veto LLD | 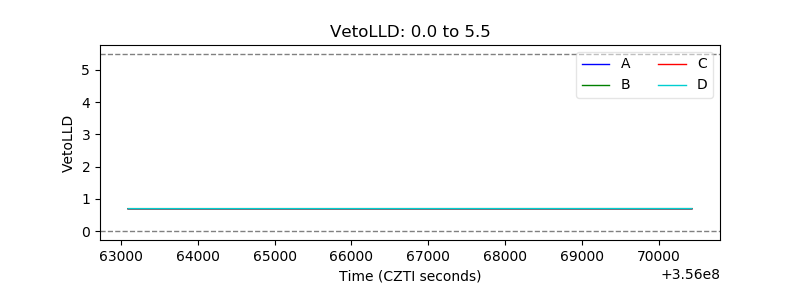 |
| Alpha Counter | 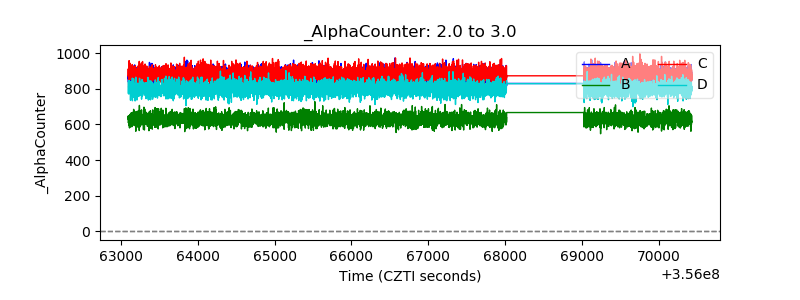 |
| _CPM_Rate |  |
| CZT Counter | 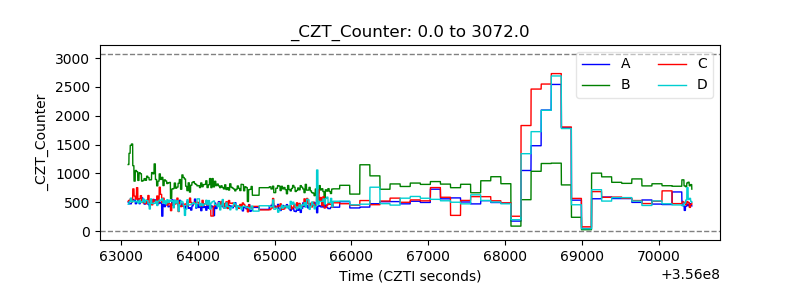 |
| +2.5 Volts monitor |  |
| +5 Volts monitor | 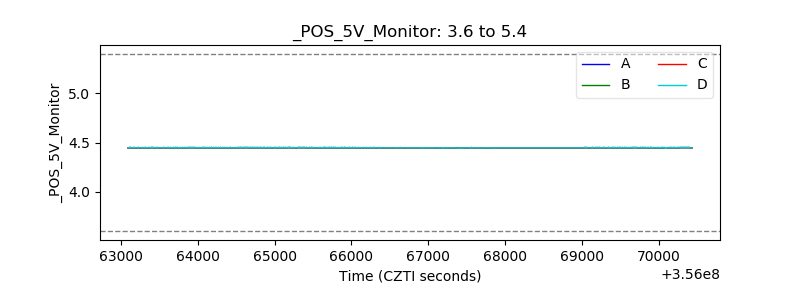 |
| _ROLL_ROT | 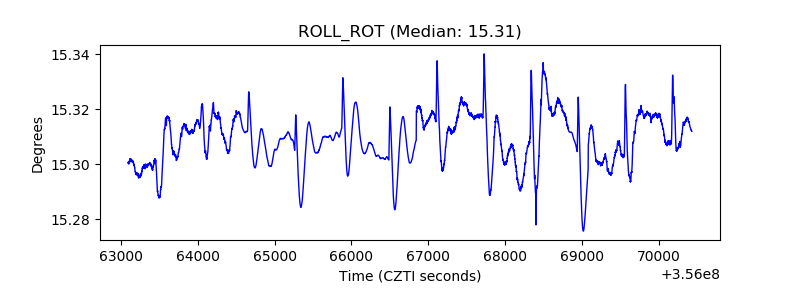 |
| _Roll_DEC | 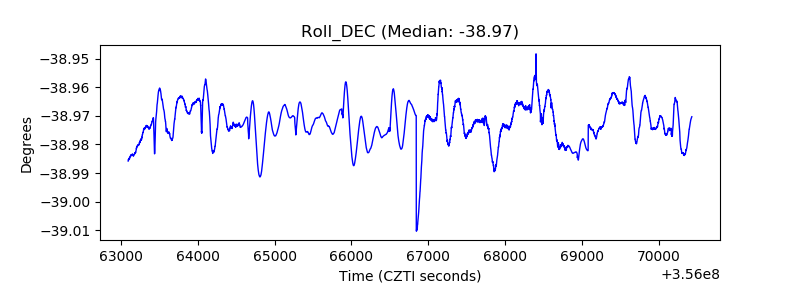 |
| _Roll_RA | 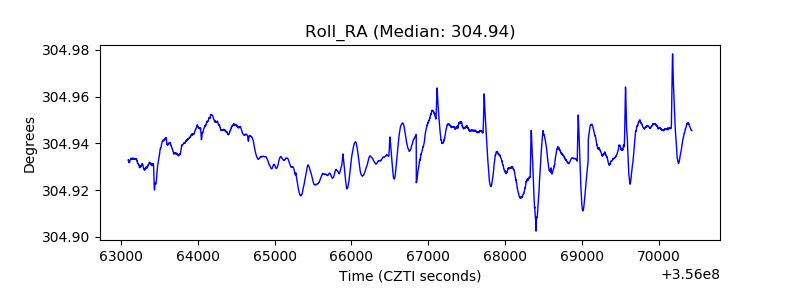 |
| Veto Counter | 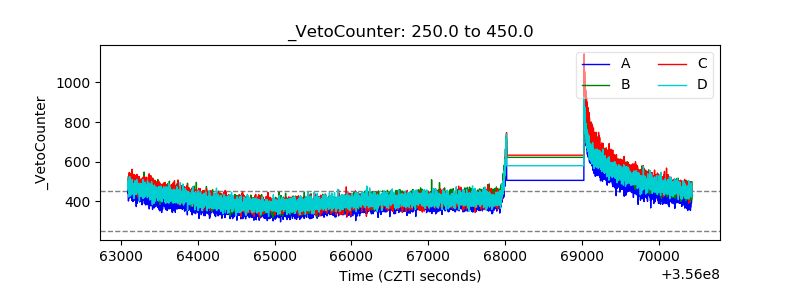 |