| Param | Original file | Final file |
|---|---|---|
| Filename | modeM0/AS1A10_053T11_9000004302_29976cztM0_level2.evt | modeM0/AS1A10_053T11_9000004302_29976cztM0_level2_quad_clean.evt |
| Size (bytes) | 159,940,800 | 33,258,240 |
| Size | 152.5 MB | 31.7 MB |
| Events in quadrant A | 930,821 | 223,757 |
| Events in quadrant B | 1,890,519 | 214,131 |
| Events in quadrant C | 937,493 | 216,484 |
| Events in quadrant D | 953,660 | 214,386 |
| Mode SS | |||
|---|---|---|---|
| Quadrant | BADHDUFLAG | Total packets | Discarded packets |
| A | 0 | 48 | 10 |
| B | 0 | 48 | 6 |
| C | 0 | 48 | 8 |
| D | 0 | 47 | 7 |
| Mode M0 | |||
|---|---|---|---|
| Quadrant | BADHDUFLAG | Total packets | Discarded packets |
| A | 0 | 4942 | 1032 |
| B | 0 | 9030 | 2109 |
| C | 0 | 4974 | 1119 |
| D | 0 | 5117 | 1209 |
| Quadrant | Total seconds | Saturated seconds | Saturation percentage |
|---|---|---|---|
| A | 1943 | 0 | 0.000000% |
| B | 1803 | 51 | 2.828619% |
| C | 1898 | 4 | 0.210748% |
| D | 1892 | 2 | 0.105708% |
Noise dominated data is calculated using 1-second bins in cleaned event files. If a bin has >2000 counts, and if more than 50% of those come from <1% of pixels, then it is considered to be noise-dominated and hence unusable.
| Quadrant | # 1 sec bins | Bins with >0 counts | Bins with >2000 counts | High rate bins dominated by noise | Noise dominated (total time) | Noise dominated (detector-on time) | Marked lightcurve |
|---|---|---|---|---|---|---|---|
| A | 2373 | 2139 | 0 | 0 | 0.00% | 0.00% | 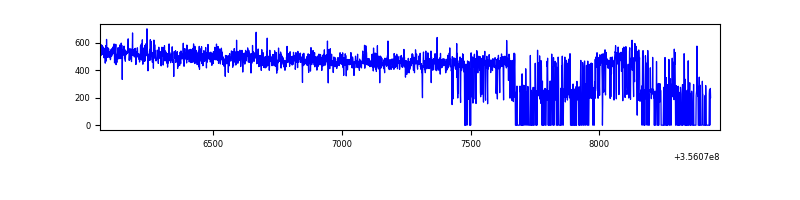 |
| B | 2353 | 2002 | 29 | 29 | 1.23% | 1.45% | 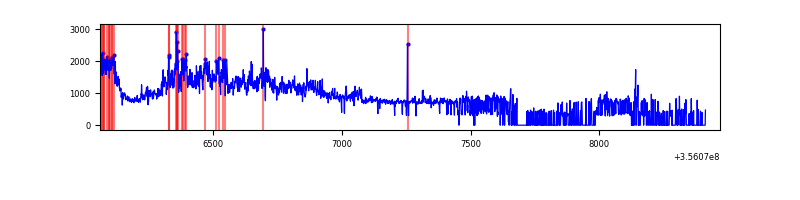 |
| C | 2408 | 2087 | 0 | 0 | 0.00% | 0.00% | 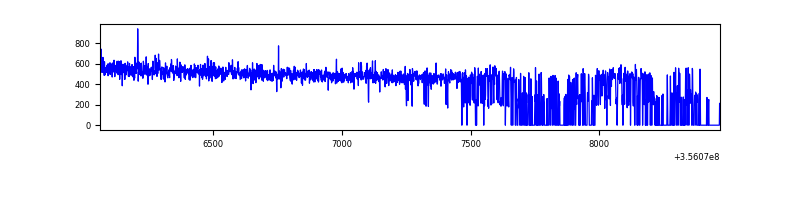 |
| D | 2386 | 2092 | 1 | 1 | 0.04% | 0.05% | 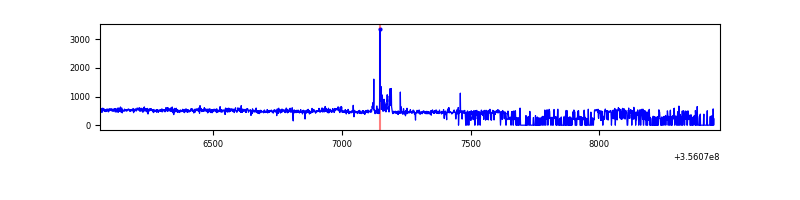 |
Top three noisy pixels from each quadrant. If the there are fewer than three noisy pixels in the level2.evt file, extra rows are filled as -1
| Pixel properties | Quadrant properties | ||||||
|---|---|---|---|---|---|---|---|
| Quadrant | DetID | PixID | Counts | Sigma | Mean | Median | Sigma |
| A | 13 | 254 | 3337 | 62.61 | 241 | 236 | 49.5 |
| A | 3 | 137 | 2153 | 38.7 | 241 | 236 | 49.5 |
| A | 0 | 226 | 2073 | 37.09 | 241 | 236 | 49.5 |
| B | 6 | 36 | 528151 | 12576.41 | 216 | 211 | 42.0 |
| B | 6 | 159 | 506029 | 12049.43 | 216 | 211 | 42.0 |
| B | 4 | 67 | 5762 | 132.23 | 216 | 211 | 42.0 |
| C | 14 | 238 | 37928 | 685.56 | 227 | 229 | 55.0 |
| C | 3 | 233 | 8246 | 145.78 | 227 | 229 | 55.0 |
| C | 2 | 114 | 4399 | 75.82 | 227 | 229 | 55.0 |
| D | 8 | 195 | 49455 | 893.67 | 231 | 226 | 55.1 |
| D | 2 | 250 | 27263 | 490.81 | 231 | 226 | 55.1 |
| D | 2 | 234 | 6882 | 120.83 | 231 | 226 | 55.1 |
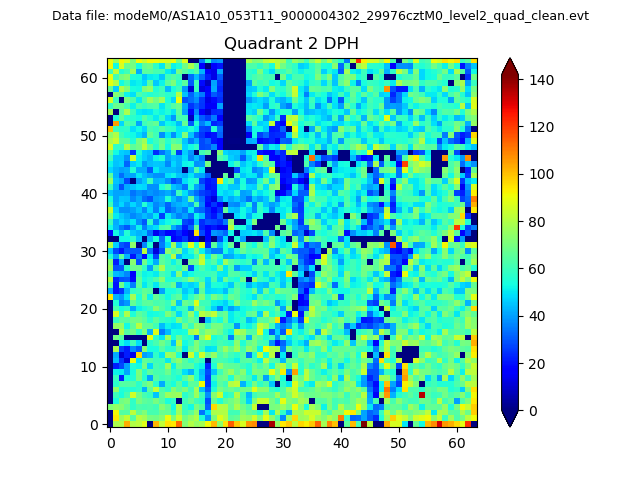
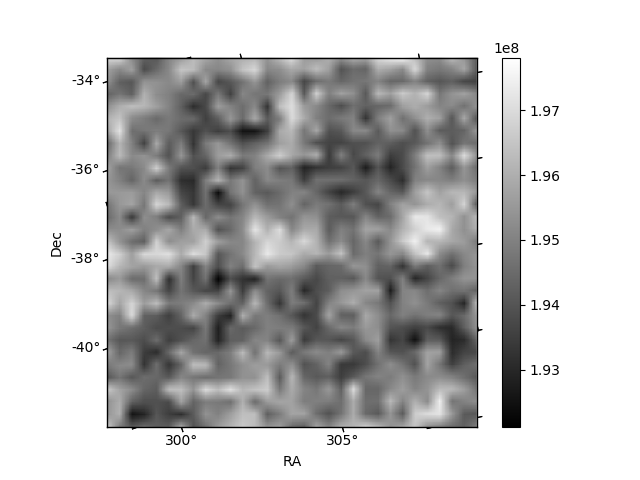
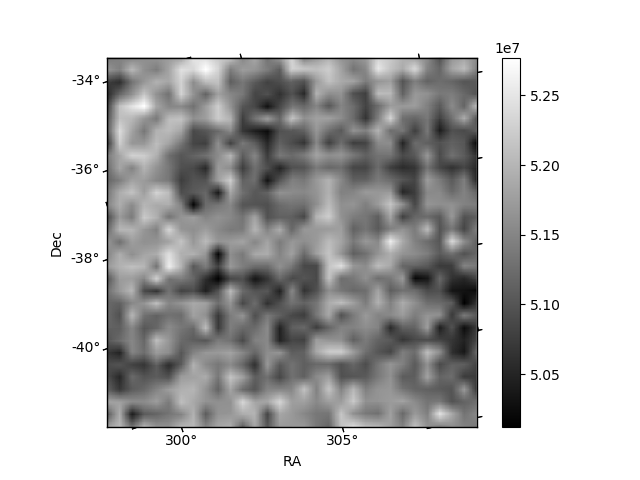
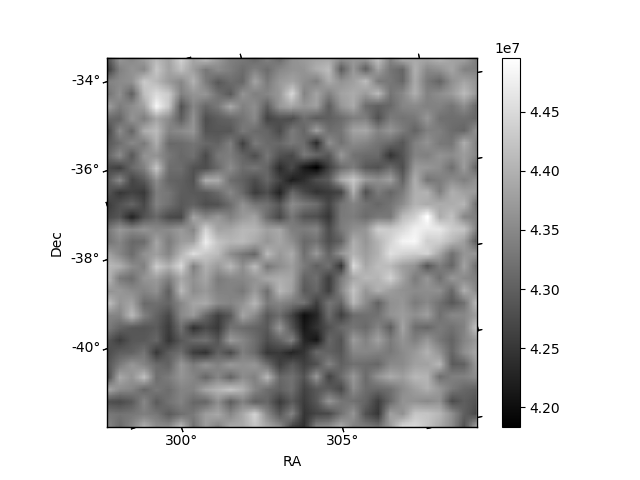
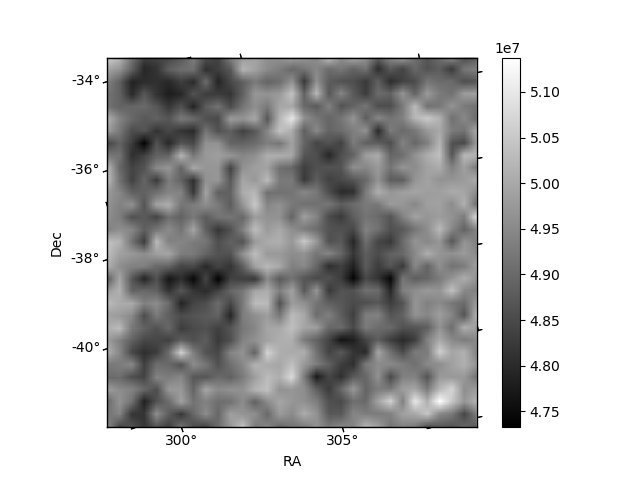
Histogram calculated using DETX and DETY for each event in the final _common_clean file
| Quadrant A | 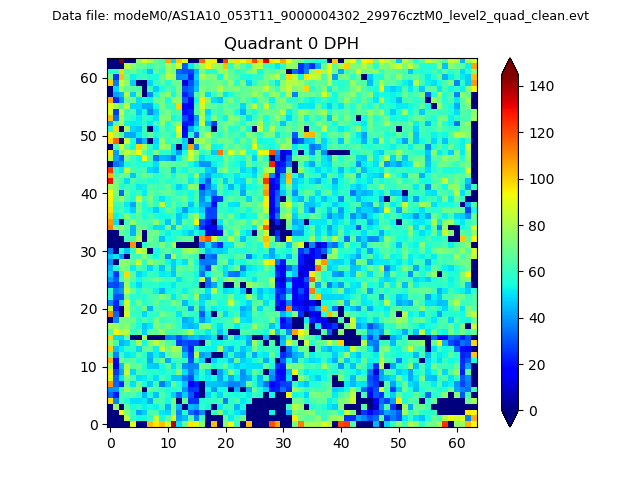 |
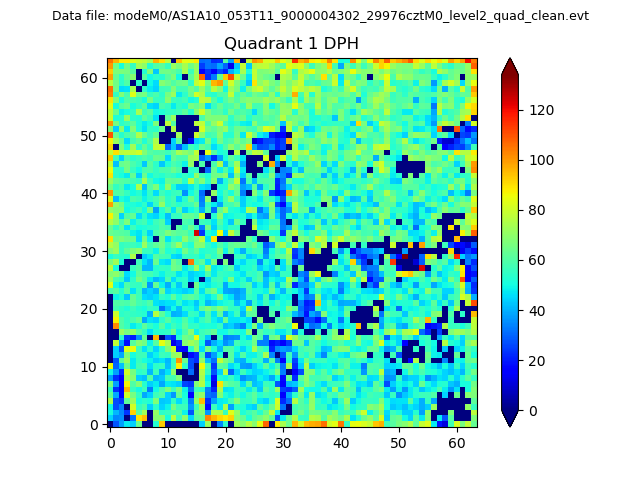 |
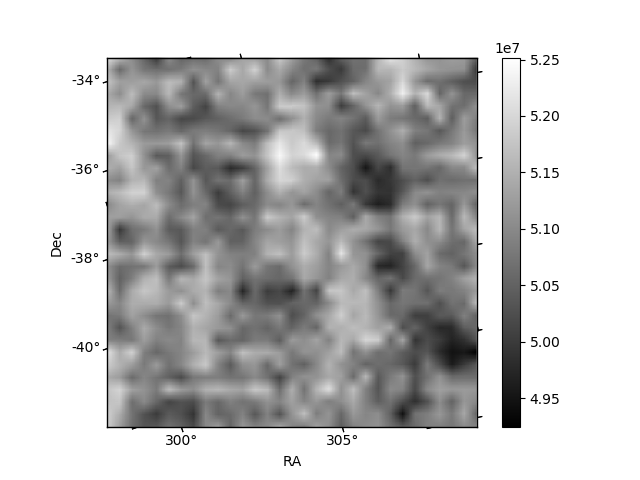
Quadrant B |
|---|---|---|---|
| Quadrant D | 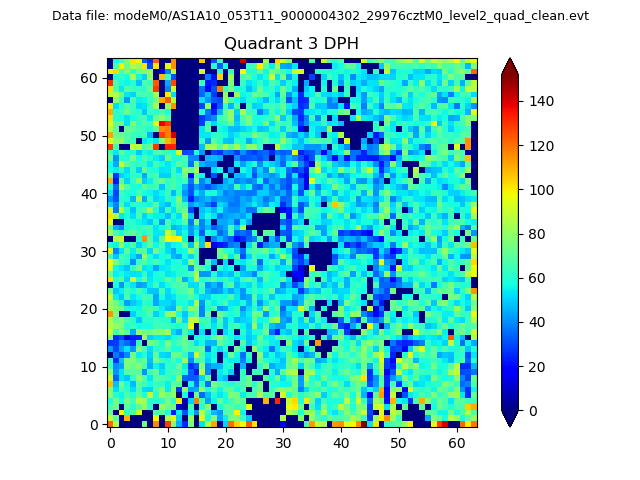 |
 |
Quadrant C |
| Plot type | Count rate plots | Images |
|---|---|---|
| Comparison with Poisson distribution Blue bars denote a histogram of data divided into 1 sec bins. Red curve is a Poisson curve with rate = median count rate of data. |
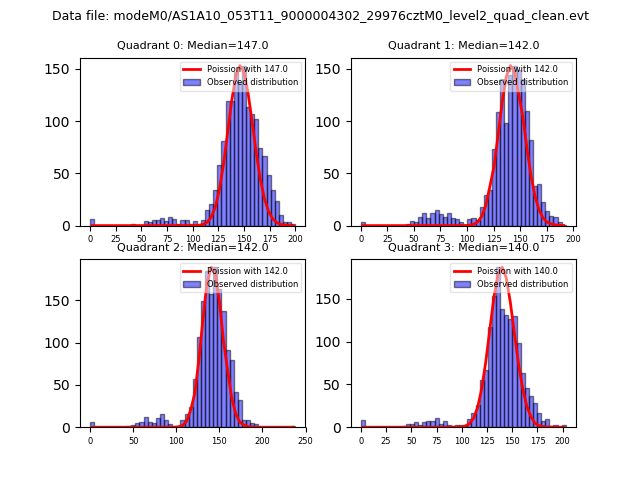 |
 |
| Quadrant-wise count rates Data is divided into 100 sec bins |
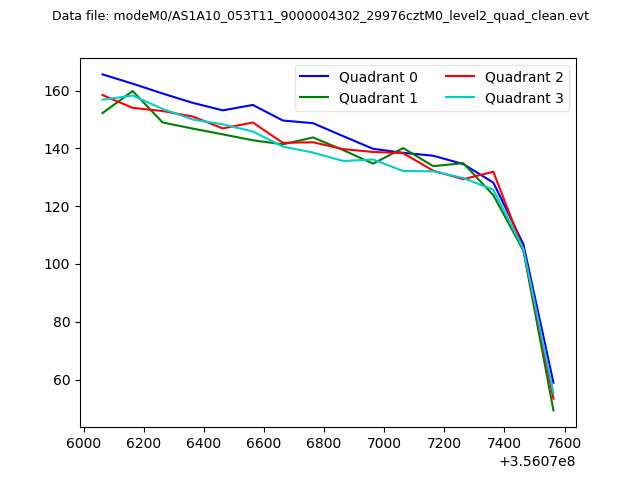 |
|
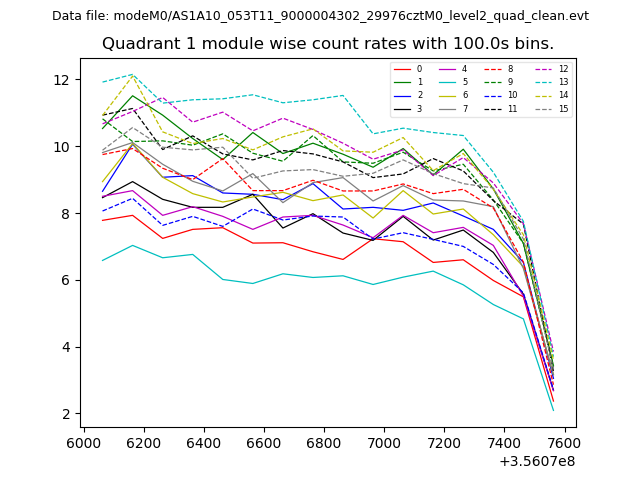
| Module-wise count rates for Quadrant A Data is divided into 100 sec bins |
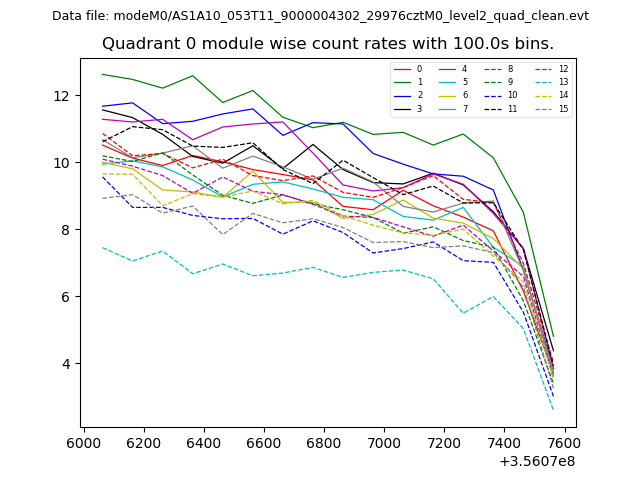 |
 |
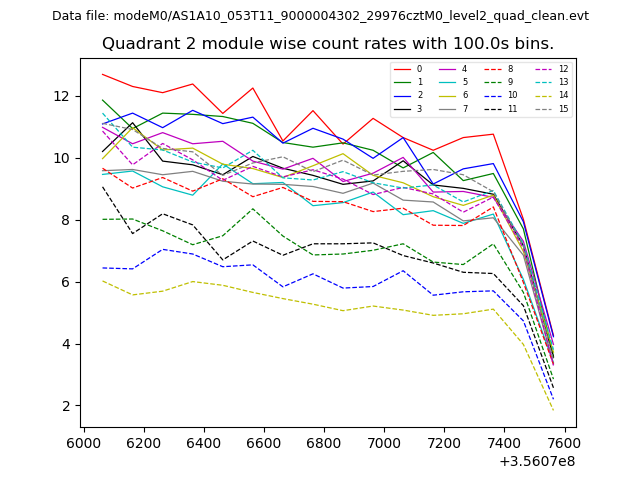
| Module-wise count rates for Quadrant B Data is divided into 100 sec bins |
 |
 |
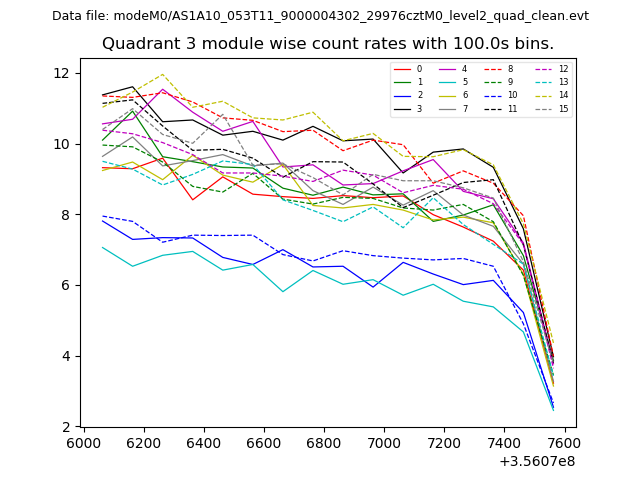
| Module-wise count rates for Quadrant C Data is divided into 100 sec bins |
 |
 |
| Module-wise count rates for Quadrant D Data is divided into 100 sec bins |
 |
 |
| Parameter | Plot |
|---|---|
| CZT HV Monitor | 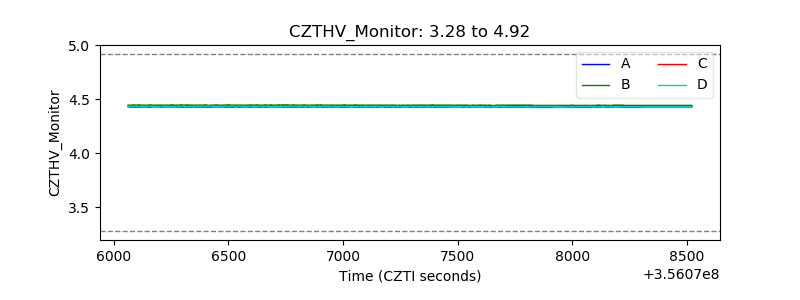 |
| D_VDD | 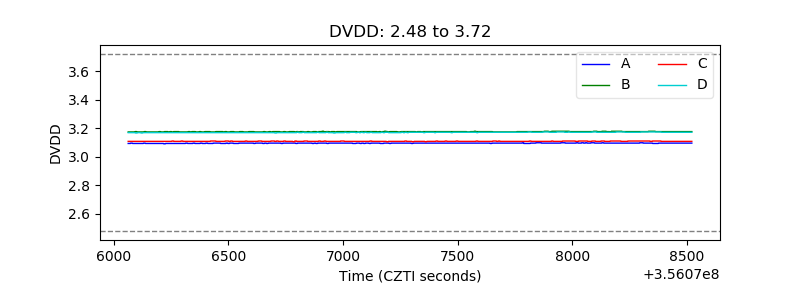 |
| Temperature 1 | 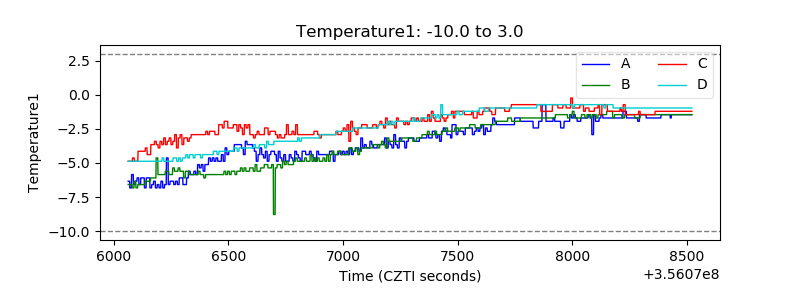 |
| Veto HV Monitor | 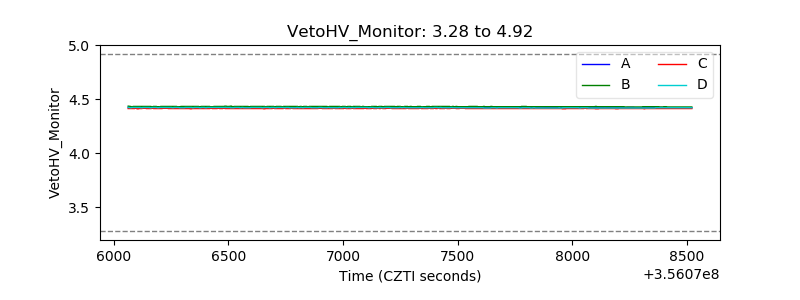 |
| Veto LLD | 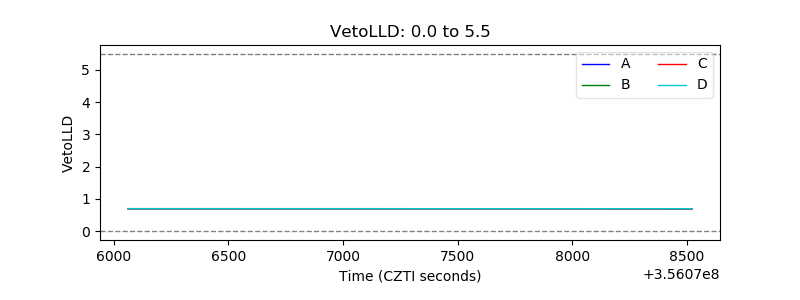 |
| Alpha Counter | 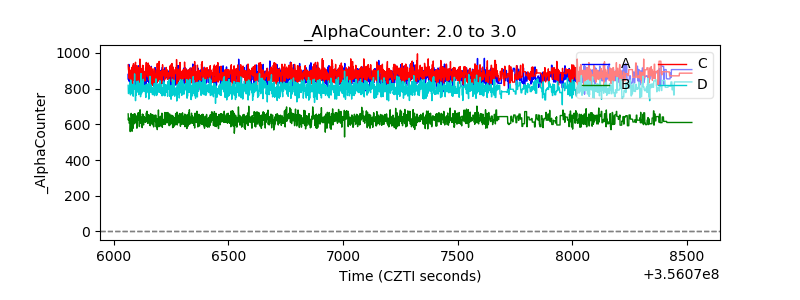 |
| _CPM_Rate | 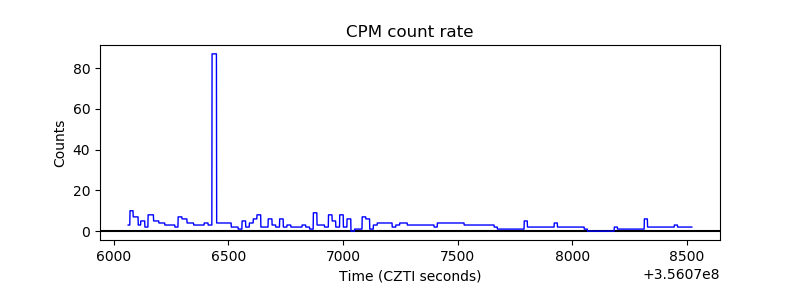 |
| CZT Counter | 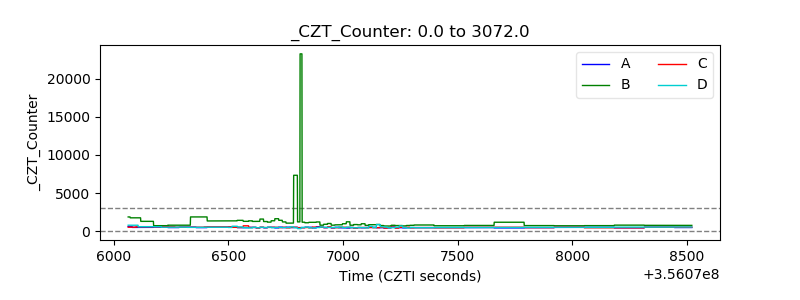 |
| +2.5 Volts monitor |  |
| +5 Volts monitor |  |
| _ROLL_ROT | 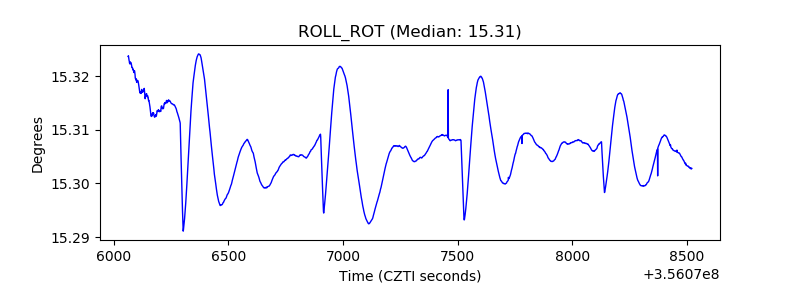 |
| _Roll_DEC | 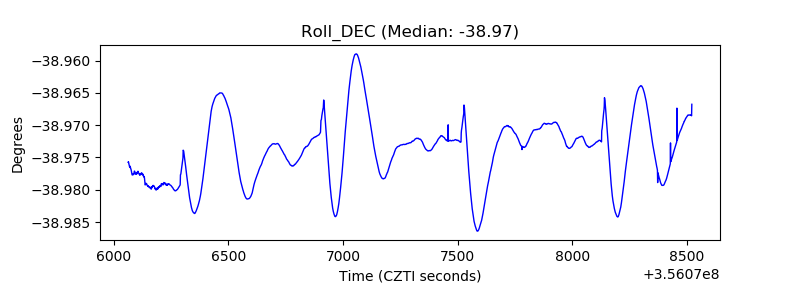 |
| _Roll_RA | 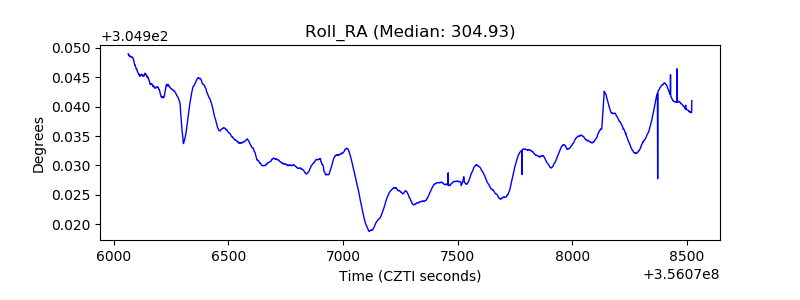 |
| Veto Counter | 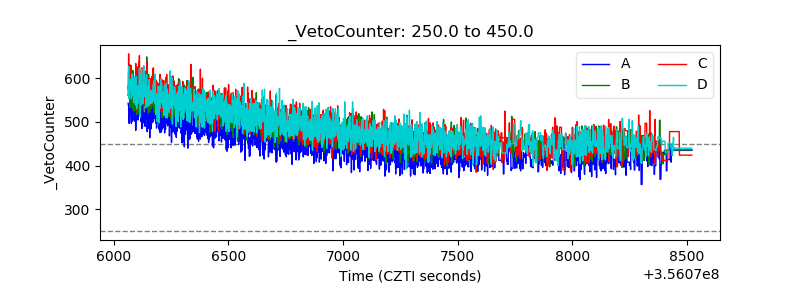 |