| Param | Original file | Final file |
|---|---|---|
| Filename | modeM0/AS1A10_053T11_9000004302_29977cztM0_level2.evt | modeM0/AS1A10_053T11_9000004302_29977cztM0_level2_quad_clean.evt |
| Size (bytes) | 1,372,389,120 | 221,227,200 |
| Size | 1.3 GB | 211.0 MB |
| Events in quadrant A | 8,245,625 | 1,449,530 |
| Events in quadrant B | 15,196,067 | 1,411,034 |
| Events in quadrant C | 8,495,500 | 1,384,300 |
| Events in quadrant D | 8,574,424 | 1,378,455 |
| Mode M9 | |||
|---|---|---|---|
| Quadrant | BADHDUFLAG | Total packets | Discarded packets |
| A | 0 | 37 | 0 |
| B | 0 | 37 | 0 |
| C | 0 | 37 | 0 |
| D | 0 | 37 | 0 |
| Mode SS | |||
|---|---|---|---|
| Quadrant | BADHDUFLAG | Total packets | Discarded packets |
| A | 0 | 316 | 0 |
| B | 0 | 316 | 0 |
| C | 0 | 316 | 0 |
| D | 0 | 316 | 0 |
| Mode M0 | |||
|---|---|---|---|
| Quadrant | BADHDUFLAG | Total packets | Discarded packets |
| A | 0 | 33918 | 3 |
| B | 0 | 55818 | 3 |
| C | 0 | 34441 | 3 |
| D | 0 | 34637 | 3 |
| Quadrant | Total seconds | Saturated seconds | Saturation percentage |
|---|---|---|---|
| A | 15617 | 166 | 1.062944% |
| B | 15617 | 919 | 5.884613% |
| C | 15617 | 306 | 1.959403% |
| D | 15617 | 131 | 0.838829% |
Noise dominated data is calculated using 1-second bins in cleaned event files. If a bin has >2000 counts, and if more than 50% of those come from <1% of pixels, then it is considered to be noise-dominated and hence unusable.
| Quadrant | # 1 sec bins | Bins with >0 counts | Bins with >2000 counts | High rate bins dominated by noise | Noise dominated (total time) | Noise dominated (detector-on time) | Marked lightcurve |
|---|---|---|---|---|---|---|---|
| A | 19247 | 15620 | 9 | 9 | 0.05% | 0.06% | 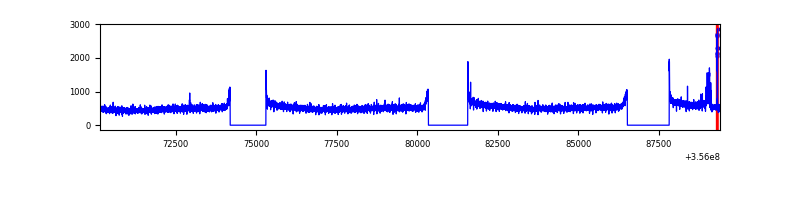 |
| B | 19247 | 15619 | 415 | 415 | 2.16% | 2.66% | 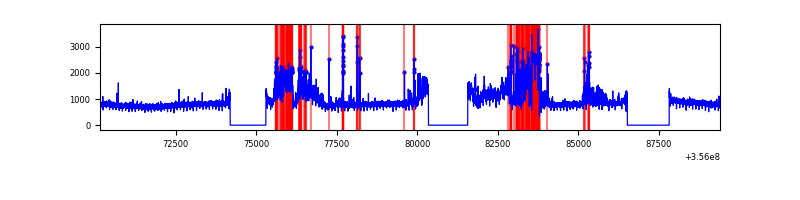 |
| C | 19247 | 15620 | 4 | 4 | 0.02% | 0.03% | 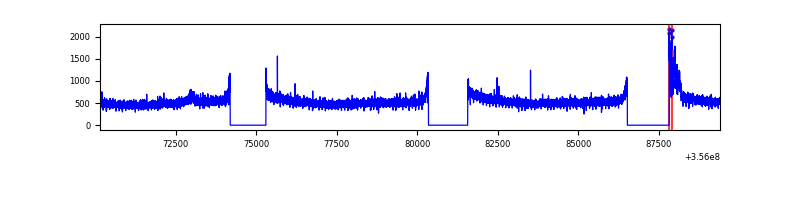 |
| D | 19247 | 15620 | 22 | 22 | 0.11% | 0.14% | 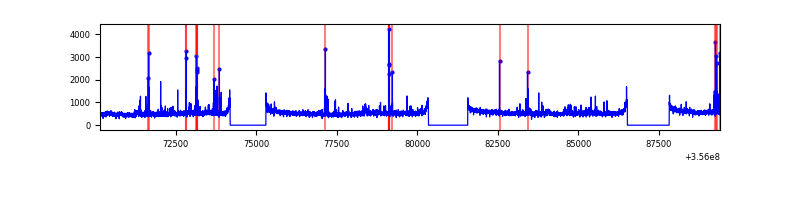 |
Top three noisy pixels from each quadrant. If the there are fewer than three noisy pixels in the level2.evt file, extra rows are filled as -1
| Pixel properties | Quadrant properties | ||||||
|---|---|---|---|---|---|---|---|
| Quadrant | DetID | PixID | Counts | Sigma | Mean | Median | Sigma |
| A | 15 | 174 | 105001 | 249.31 | 2099 | 2061 | 412.9 |
| A | 8 | 192 | 37460 | 85.73 | 2099 | 2061 | 412.9 |
| A | 13 | 254 | 28391 | 63.77 | 2099 | 2061 | 412.9 |
| B | 6 | 159 | 4381382 | 11667.43 | 2011 | 1965 | 375.4 |
| B | 6 | 36 | 2870903 | 7643.29 | 2011 | 1965 | 375.4 |
| B | 12 | 111 | 44690 | 113.83 | 2011 | 1965 | 375.4 |
| C | 3 | 233 | 337667 | 728.5 | 1998 | 2022 | 460.7 |
| C | 14 | 238 | 326680 | 704.66 | 1998 | 2022 | 460.7 |
| C | 2 | 114 | 37408 | 76.8 | 1998 | 2022 | 460.7 |
| D | 8 | 195 | 530872 | 1103.39 | 2055 | 2009 | 479.3 |
| D | 2 | 250 | 101182 | 206.91 | 2055 | 2009 | 479.3 |
| D | 7 | 69 | 83379 | 169.77 | 2055 | 2009 | 479.3 |
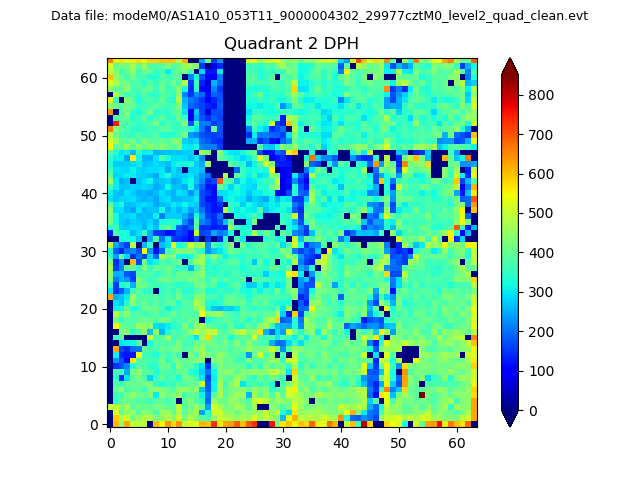
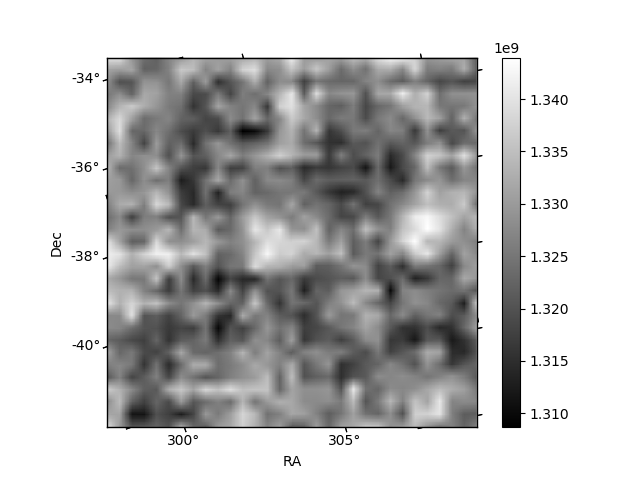
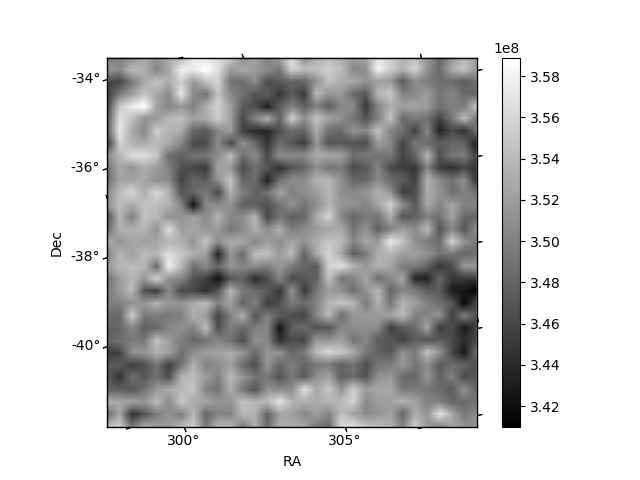
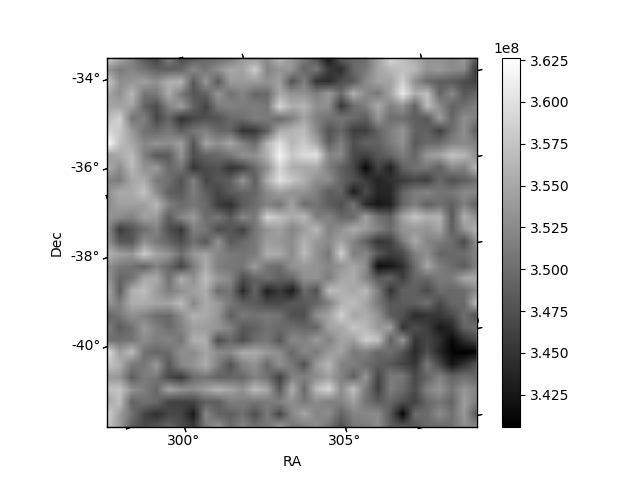
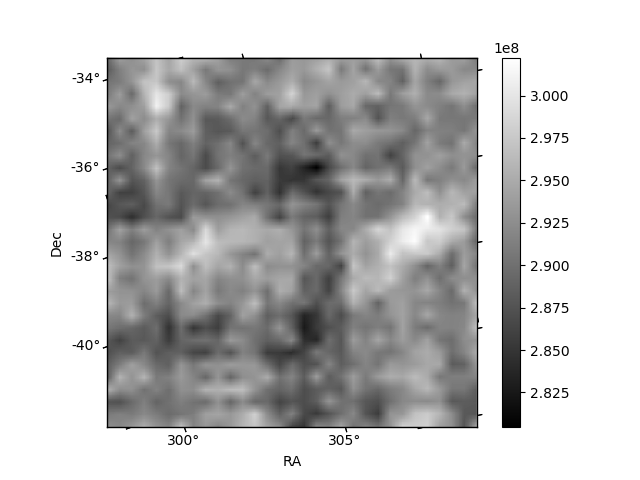
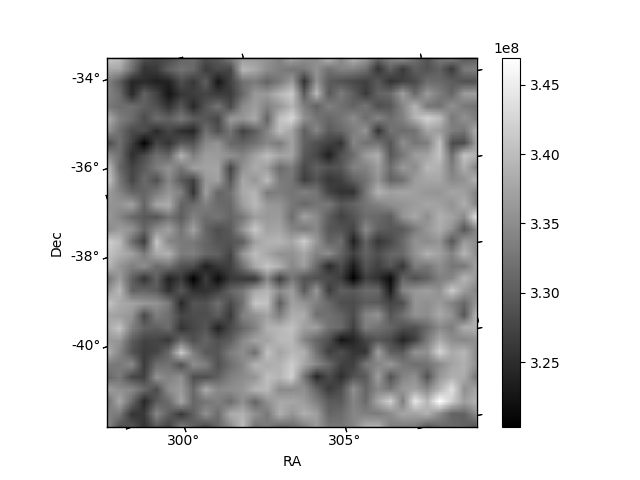
Histogram calculated using DETX and DETY for each event in the final _common_clean file
| Quadrant A | 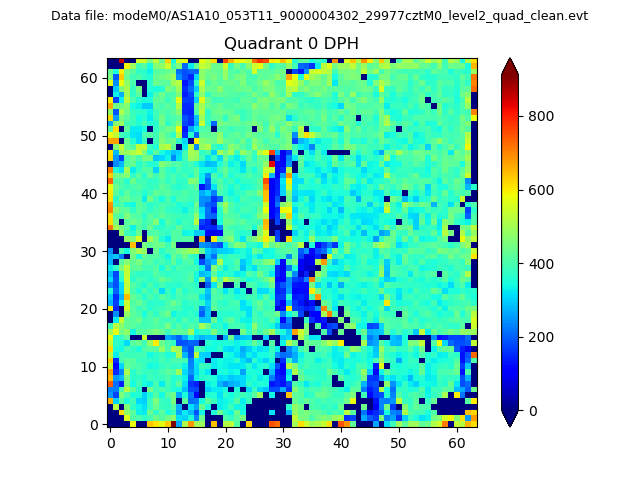 |
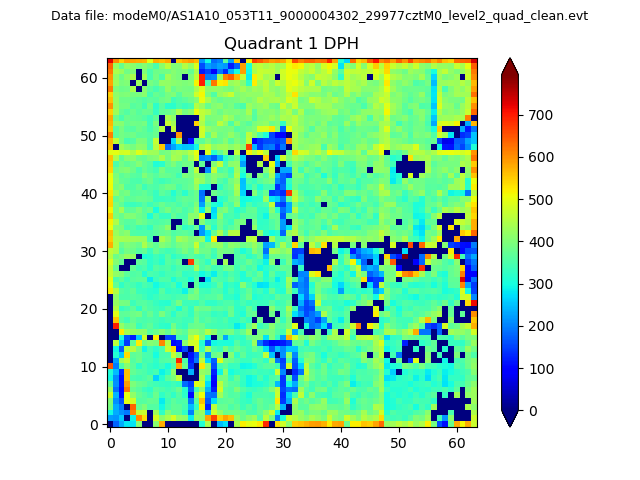 |
Quadrant B |
|---|---|---|---|
| Quadrant D | 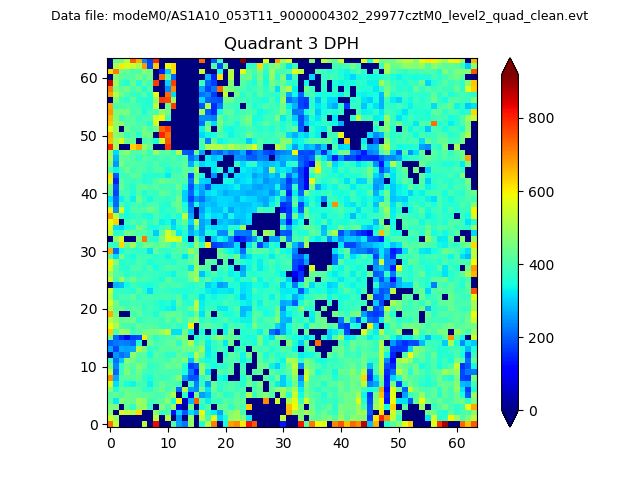 |
 |
Quadrant C |
| Plot type | Count rate plots | Images |
|---|---|---|
| Comparison with Poisson distribution Blue bars denote a histogram of data divided into 1 sec bins. Red curve is a Poisson curve with rate = median count rate of data. |
 |
 |
| Quadrant-wise count rates Data is divided into 100 sec bins |
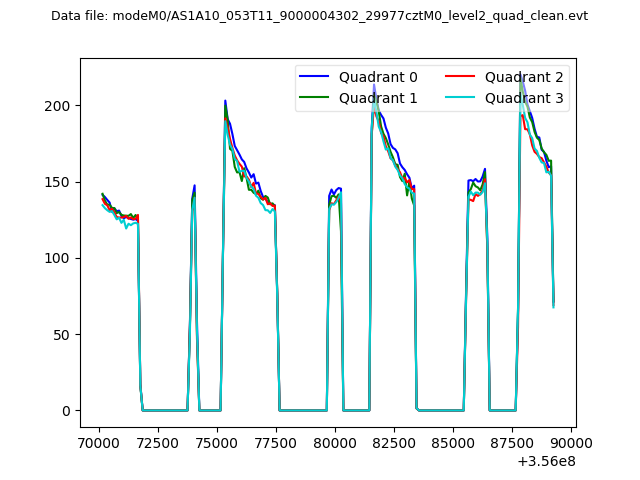 |
|
| Module-wise count rates for Quadrant A Data is divided into 100 sec bins |
 |
 |
| Module-wise count rates for Quadrant B Data is divided into 100 sec bins |
 |
 |
| Module-wise count rates for Quadrant C Data is divided into 100 sec bins |
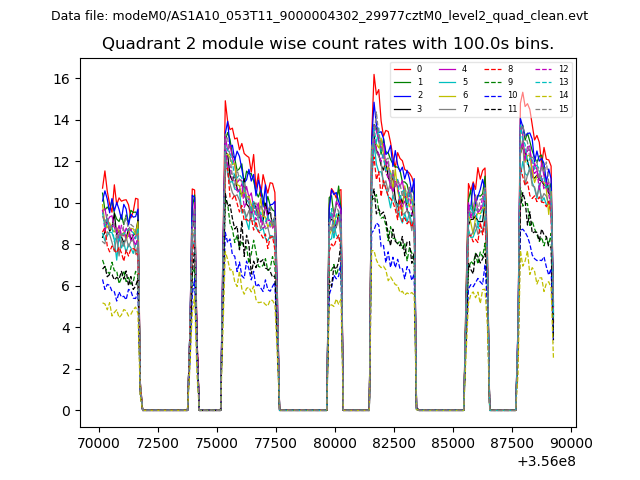 |
 |
| Module-wise count rates for Quadrant D Data is divided into 100 sec bins |
 |
 |
| Parameter | Plot |
|---|---|
| CZT HV Monitor | 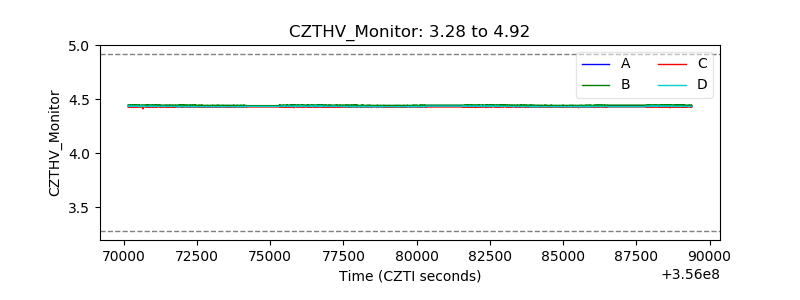 |
| D_VDD | 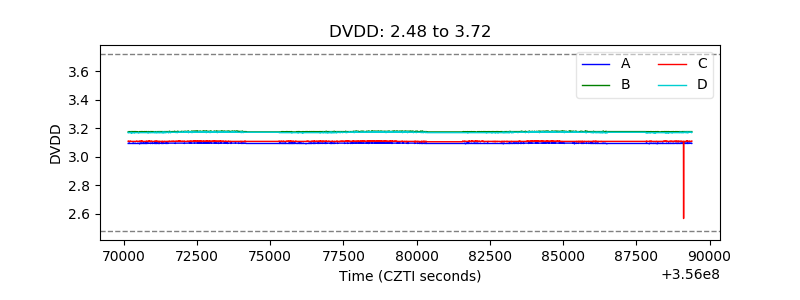 |
| Temperature 1 | 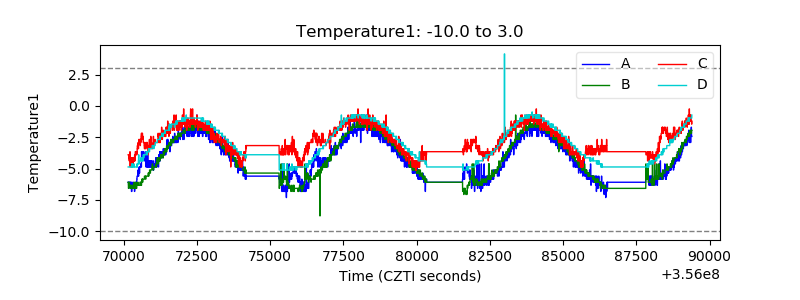 |
| Veto HV Monitor | 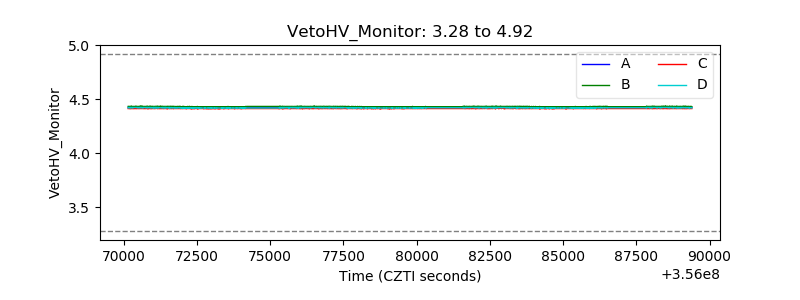 |
| Veto LLD | 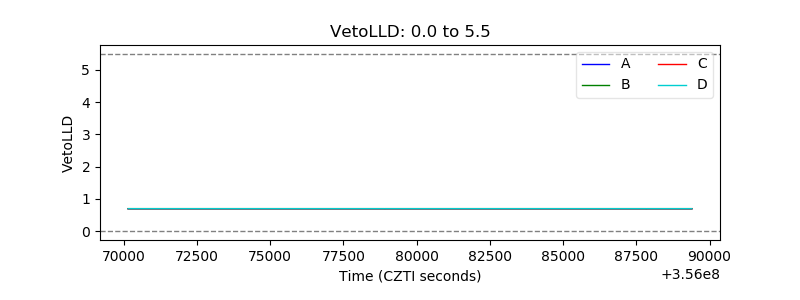 |
| Alpha Counter | 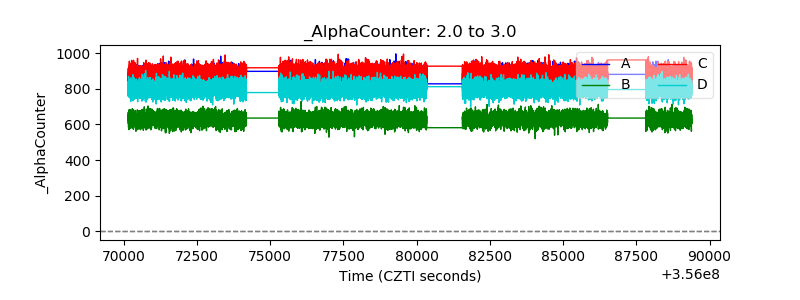 |
| _CPM_Rate | 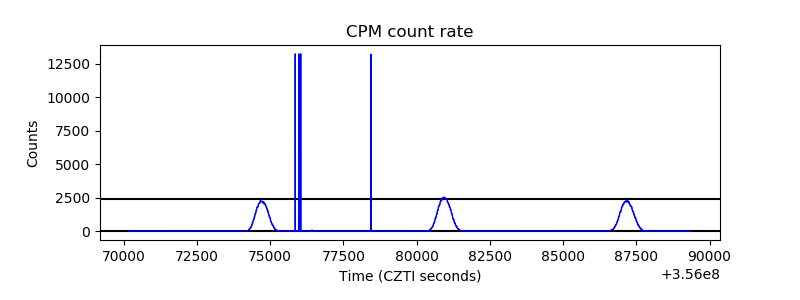 |
| CZT Counter | 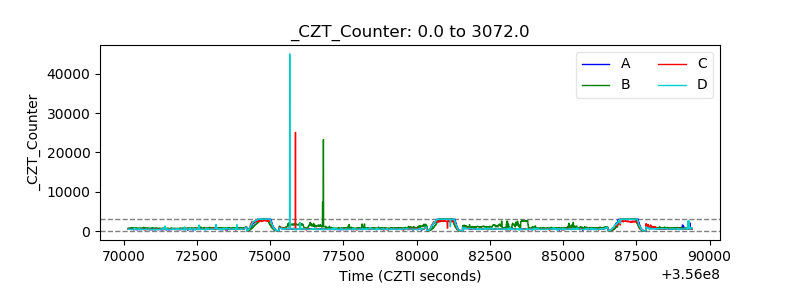 |
| +2.5 Volts monitor |  |
| +5 Volts monitor |  |
| _ROLL_ROT |  |
| _Roll_DEC |  |
| _Roll_RA | 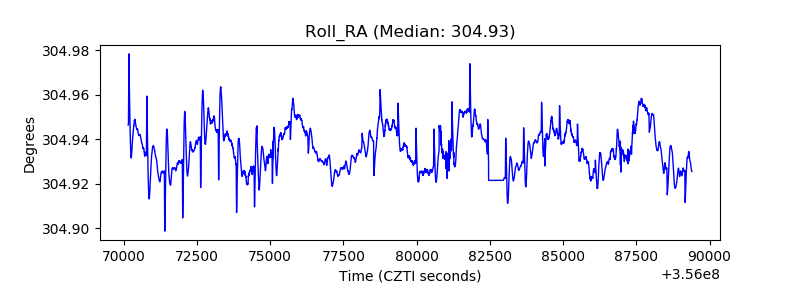 |
| Veto Counter | 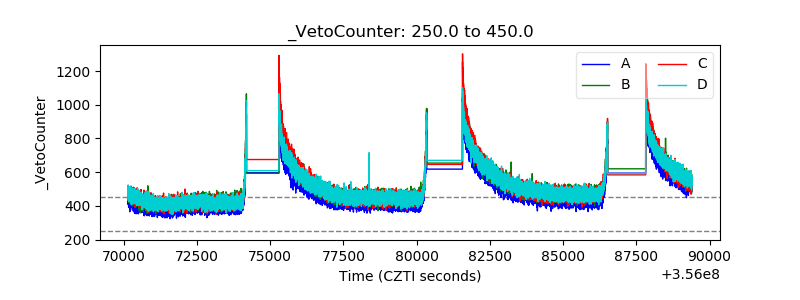 |