| Param | Original file | Final file |
|---|---|---|
| Filename | modeM0/AS1A10_053T11_9000004302_29978cztM0_level2.evt | modeM0/AS1A10_053T11_9000004302_29978cztM0_level2_quad_clean.evt |
| Size (bytes) | 494,144,640 | 77,008,320 |
| Size | 471.3 MB | 73.4 MB |
| Events in quadrant A | 3,220,907 | 498,942 |
| Events in quadrant B | 4,753,247 | 494,802 |
| Events in quadrant C | 3,082,529 | 469,363 |
| Events in quadrant D | 3,523,397 | 471,270 |
| Mode M9 | |||
|---|---|---|---|
| Quadrant | BADHDUFLAG | Total packets | Discarded packets |
| A | 0 | 13 | 0 |
| B | 0 | 13 | 0 |
| C | 0 | 13 | 0 |
| D | 0 | 13 | 0 |
| Mode SS | |||
|---|---|---|---|
| Quadrant | BADHDUFLAG | Total packets | Discarded packets |
| A | 0 | 116 | 0 |
| B | 0 | 116 | 0 |
| C | 0 | 116 | 0 |
| D | 0 | 116 | 0 |
| Mode M0 | |||
|---|---|---|---|
| Quadrant | BADHDUFLAG | Total packets | Discarded packets |
| A | 0 | 12852 | 1 |
| B | 0 | 17546 | 1 |
| C | 0 | 12380 | 1 |
| D | 0 | 13806 | 1 |
| Quadrant | Total seconds | Saturated seconds | Saturation percentage |
|---|---|---|---|
| A | 5682 | 86 | 1.513552% |
| B | 5683 | 130 | 2.287524% |
| C | 5683 | 115 | 2.023579% |
| D | 5683 | 121 | 2.129157% |
Noise dominated data is calculated using 1-second bins in cleaned event files. If a bin has >2000 counts, and if more than 50% of those come from <1% of pixels, then it is considered to be noise-dominated and hence unusable.
| Quadrant | # 1 sec bins | Bins with >0 counts | Bins with >2000 counts | High rate bins dominated by noise | Noise dominated (total time) | Noise dominated (detector-on time) | Marked lightcurve |
|---|---|---|---|---|---|---|---|
| A | 6982 | 5683 | 9 | 9 | 0.13% | 0.16% | 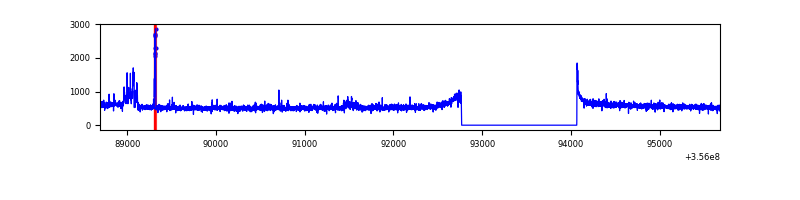 |
| B | 6983 | 5684 | 2 | 2 | 0.03% | 0.04% | 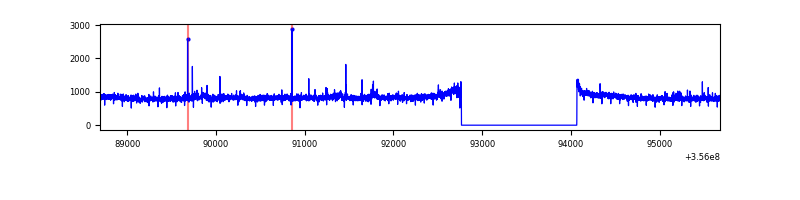 |
| C | 6983 | 5684 | 0 | 0 | 0.00% | 0.00% | 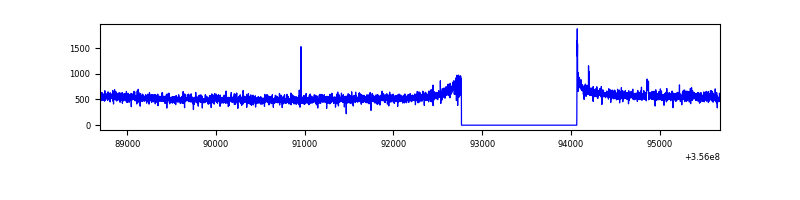 |
| D | 6983 | 5684 | 57 | 57 | 0.82% | 1.00% | 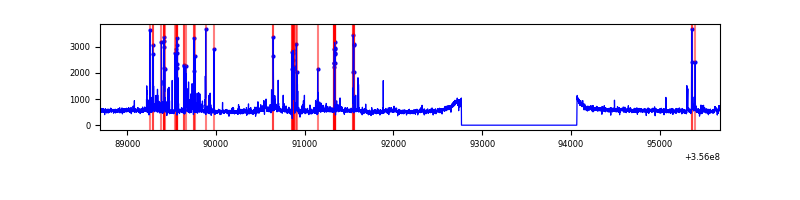 |
Top three noisy pixels from each quadrant. If the there are fewer than three noisy pixels in the level2.evt file, extra rows are filled as -1
| Pixel properties | Quadrant properties | ||||||
|---|---|---|---|---|---|---|---|
| Quadrant | DetID | PixID | Counts | Sigma | Mean | Median | Sigma |
| A | 15 | 174 | 101291 | 640.91 | 797 | 783 | 156.8 |
| A | 3 | 1 | 35954 | 224.28 | 797 | 783 | 156.8 |
| A | 8 | 192 | 11868 | 70.69 | 797 | 783 | 156.8 |
| B | 6 | 159 | 1622491 | 11245.82 | 770 | 755 | 144.2 |
| B | 6 | 36 | 72801 | 499.6 | 770 | 755 | 144.2 |
| B | 12 | 111 | 16768 | 111.04 | 770 | 755 | 144.2 |
| C | 14 | 238 | 121644 | 701.79 | 744 | 752 | 172.3 |
| C | 3 | 233 | 46393 | 264.95 | 744 | 752 | 172.3 |
| C | 2 | 114 | 13709 | 75.22 | 744 | 752 | 172.3 |
| D | 8 | 195 | 245776 | 1351.07 | 770 | 752 | 181.4 |
| D | 12 | 233 | 242839 | 1334.87 | 770 | 752 | 181.4 |
| D | 2 | 250 | 68765 | 375.02 | 770 | 752 | 181.4 |
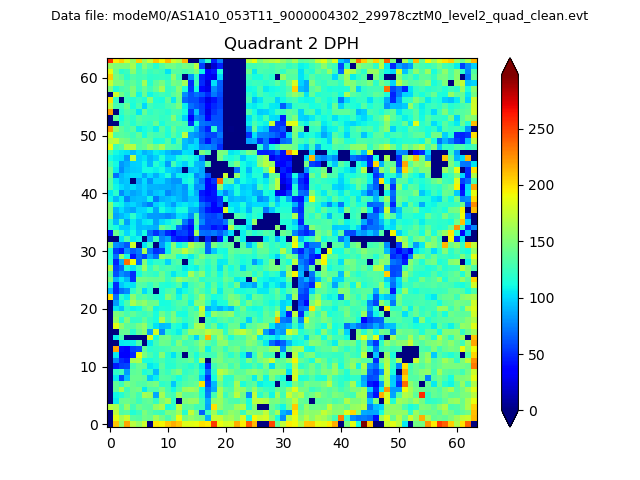
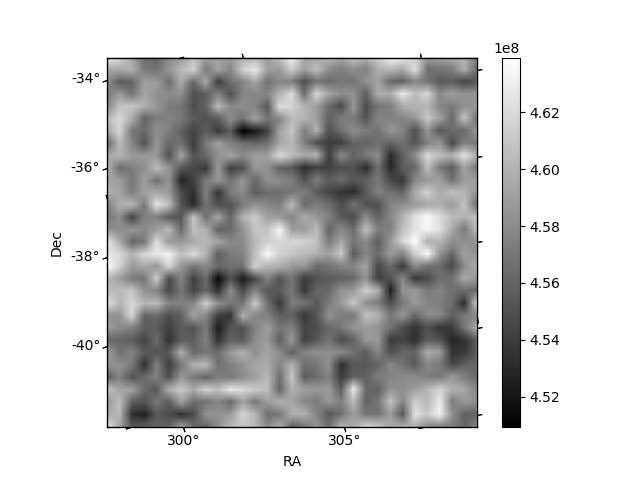
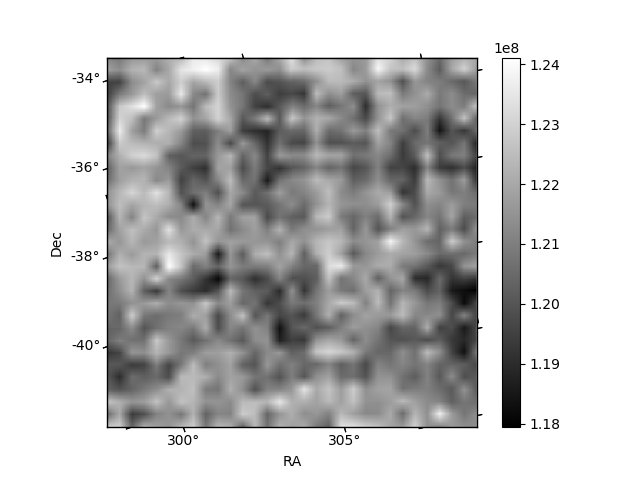
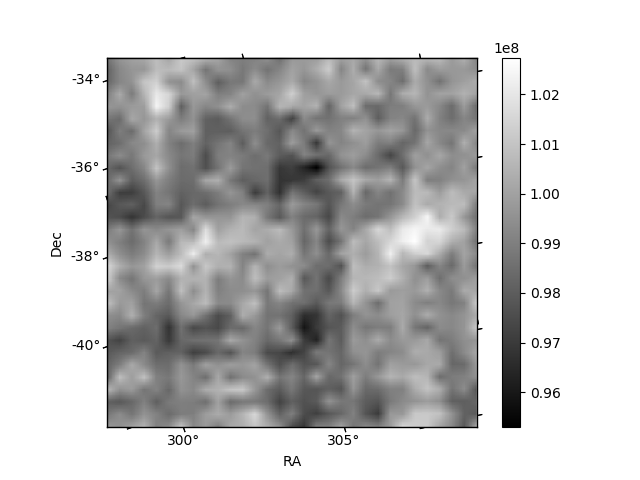
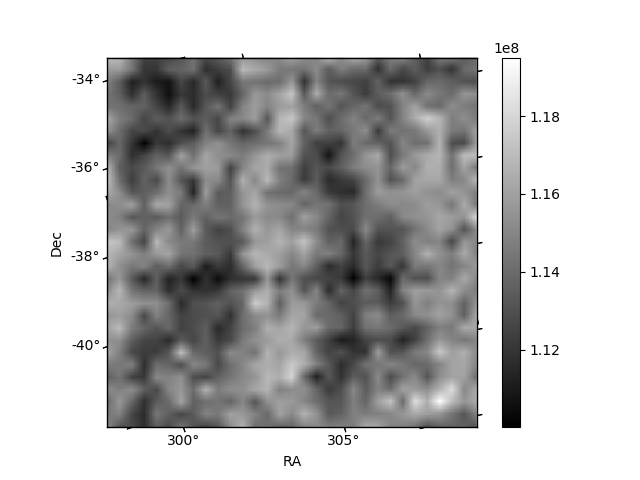
Histogram calculated using DETX and DETY for each event in the final _common_clean file
| Quadrant A | 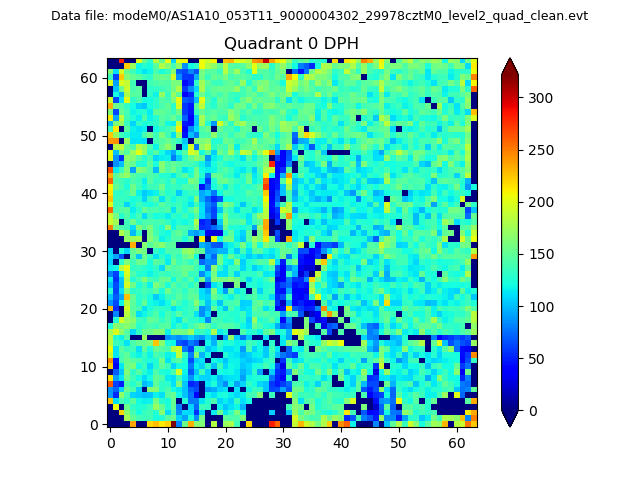 |
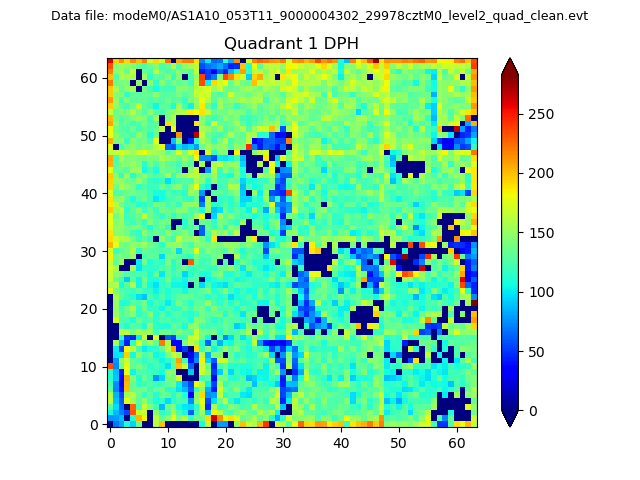 |
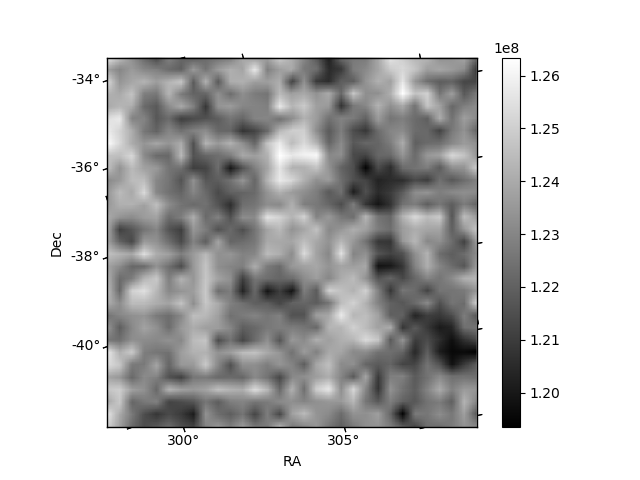
Quadrant B |
|---|---|---|---|
| Quadrant D | 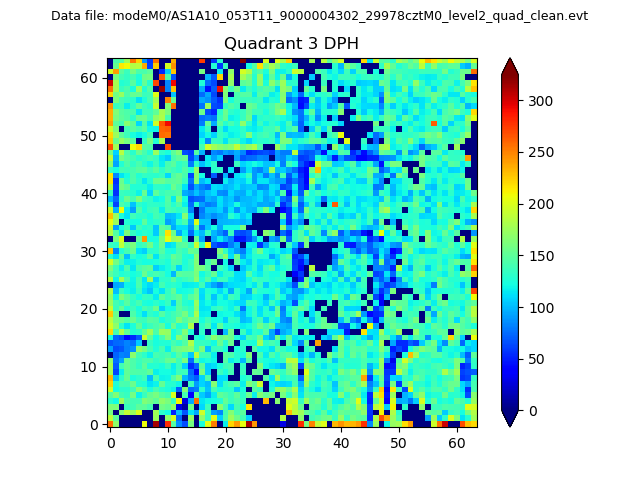 |
 |
Quadrant C |
| Plot type | Count rate plots | Images |
|---|---|---|
| Comparison with Poisson distribution Blue bars denote a histogram of data divided into 1 sec bins. Red curve is a Poisson curve with rate = median count rate of data. |
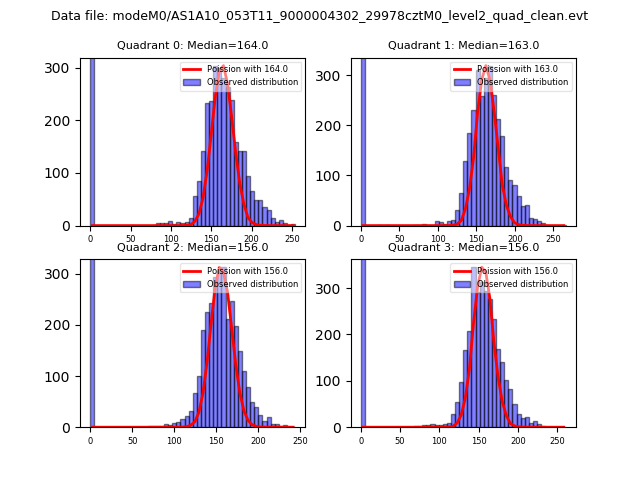 |
 |
| Quadrant-wise count rates Data is divided into 100 sec bins |
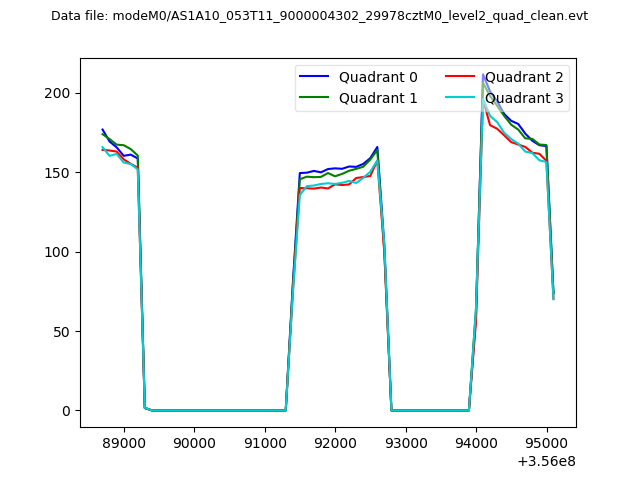 |
|
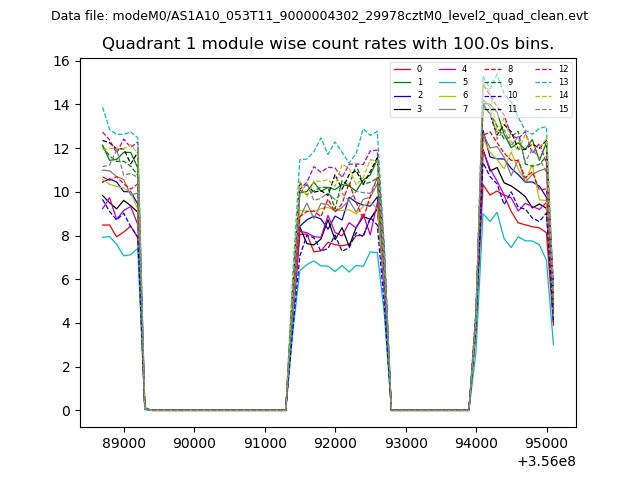
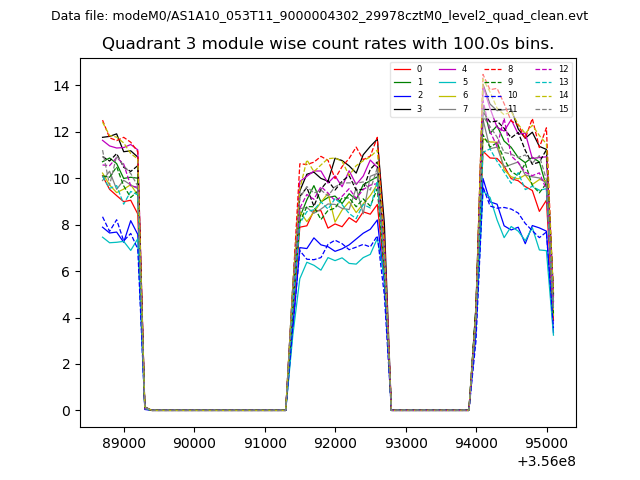
| Module-wise count rates for Quadrant A Data is divided into 100 sec bins |
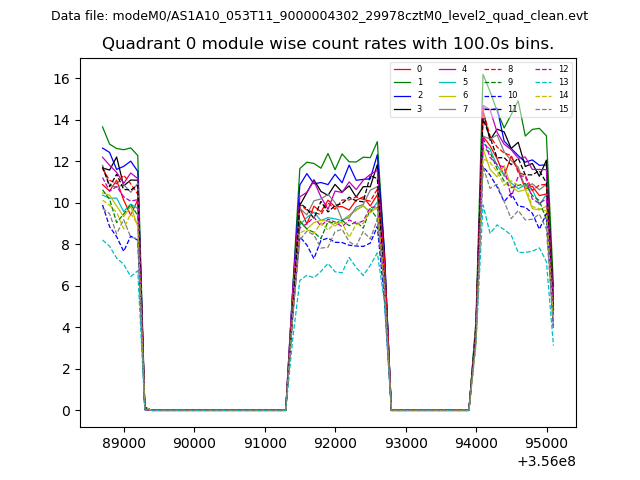 |
 |
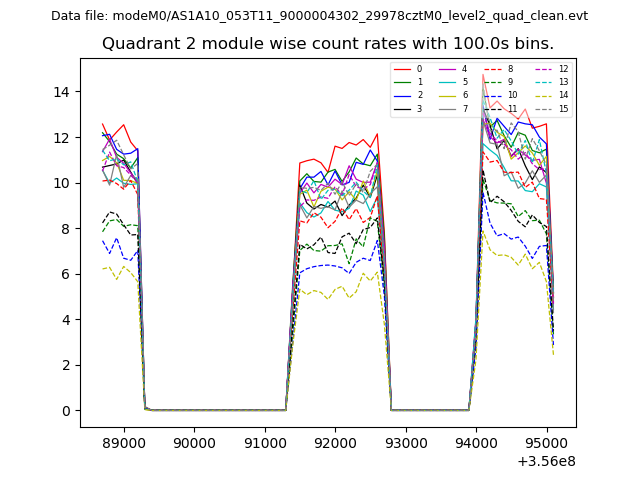
| Module-wise count rates for Quadrant B Data is divided into 100 sec bins |
 |
 |
| Module-wise count rates for Quadrant C Data is divided into 100 sec bins |
 |
 |
| Module-wise count rates for Quadrant D Data is divided into 100 sec bins |
 |
 |
| Parameter | Plot |
|---|---|
| CZT HV Monitor | 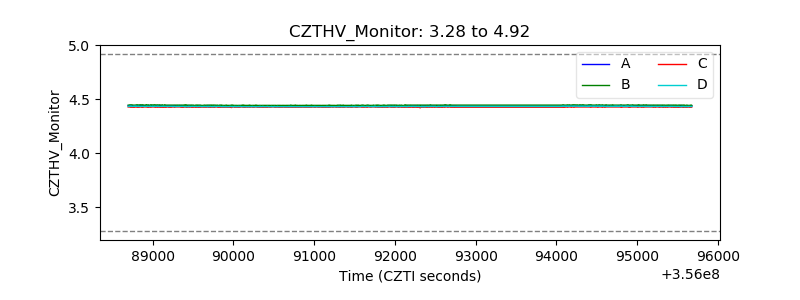 |
| D_VDD | 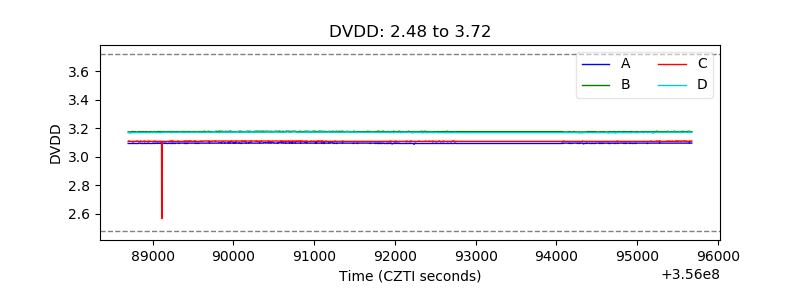 |
| Temperature 1 | 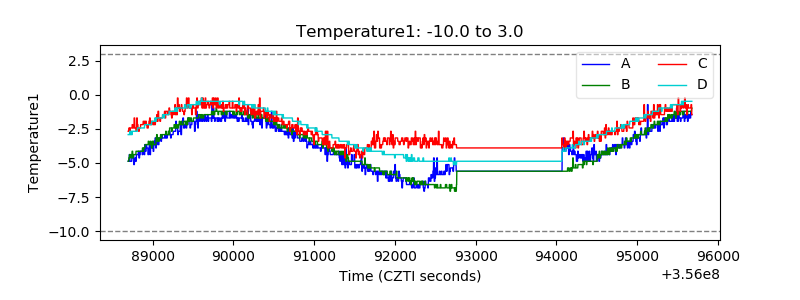 |
| Veto HV Monitor | 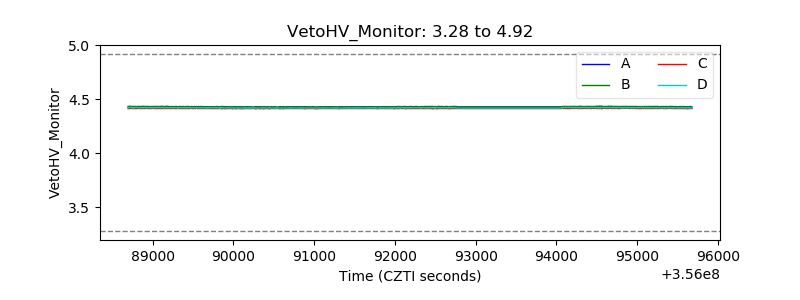 |
| Veto LLD | 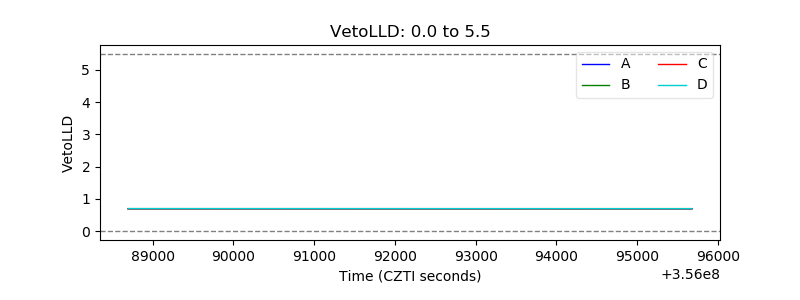 |
| Alpha Counter | 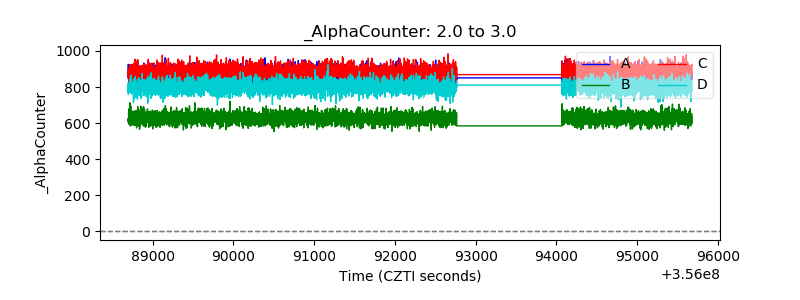 |
| _CPM_Rate | 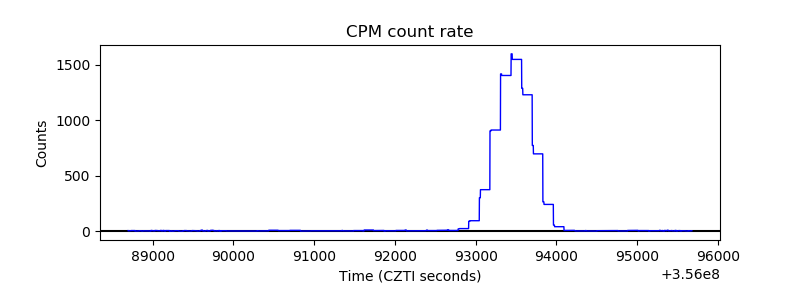 |
| CZT Counter | 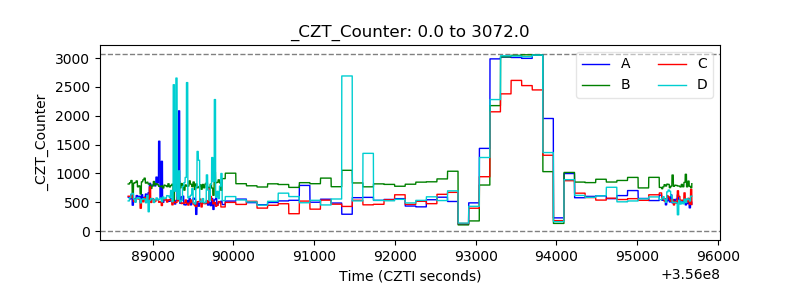 |
| +2.5 Volts monitor | 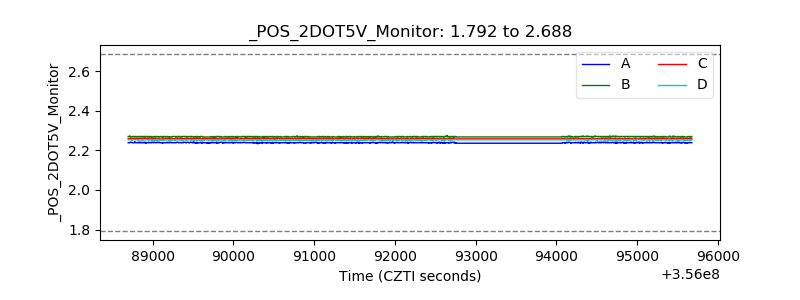 |
| +5 Volts monitor |  |
| _ROLL_ROT | 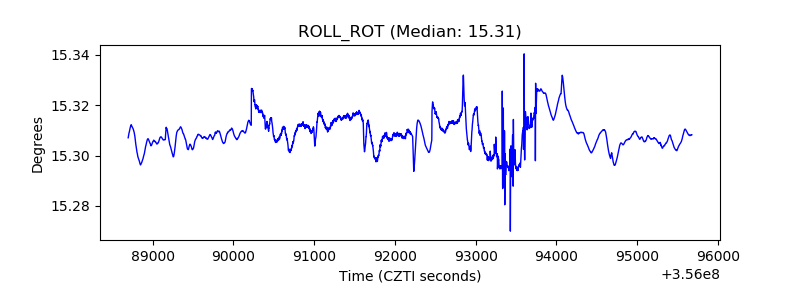 |
| _Roll_DEC |  |
| _Roll_RA | 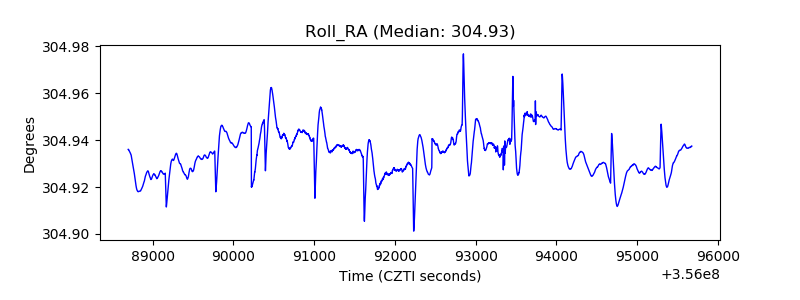 |
| Veto Counter | 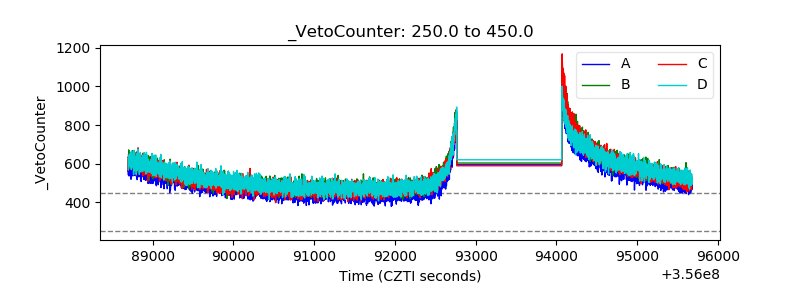 |