| Param | Original file | Final file |
|---|---|---|
| Filename | modeM0/AS1A10_053T11_9000004302_29979cztM0_level2.evt | modeM0/AS1A10_053T11_9000004302_29979cztM0_level2_quad_clean.evt |
| Size (bytes) | 550,630,080 | 86,751,360 |
| Size | 525.1 MB | 82.7 MB |
| Events in quadrant A | 3,522,952 | 561,176 |
| Events in quadrant B | 5,450,638 | 554,245 |
| Events in quadrant C | 3,501,088 | 527,445 |
| Events in quadrant D | 3,756,430 | 526,201 |
| Mode M9 | |||
|---|---|---|---|
| Quadrant | BADHDUFLAG | Total packets | Discarded packets |
| A | 0 | 12 | 0 |
| B | 0 | 12 | 0 |
| C | 0 | 12 | 0 |
| D | 0 | 12 | 0 |
| Mode SS | |||
|---|---|---|---|
| Quadrant | BADHDUFLAG | Total packets | Discarded packets |
| A | 0 | 134 | 0 |
| B | 0 | 134 | 0 |
| C | 0 | 134 | 0 |
| D | 0 | 134 | 0 |
| Mode M0 | |||
|---|---|---|---|
| Quadrant | BADHDUFLAG | Total packets | Discarded packets |
| A | 0 | 14230 | 1 |
| B | 0 | 20263 | 4 |
| C | 0 | 14215 | 1 |
| D | 0 | 15030 | 1 |
| Quadrant | Total seconds | Saturated seconds | Saturation percentage |
|---|---|---|---|
| A | 6565 | 103 | 1.568926% |
| B | 6565 | 156 | 2.376238% |
| C | 6565 | 125 | 1.904037% |
| D | 6565 | 93 | 1.416603% |
Noise dominated data is calculated using 1-second bins in cleaned event files. If a bin has >2000 counts, and if more than 50% of those come from <1% of pixels, then it is considered to be noise-dominated and hence unusable.
| Quadrant | # 1 sec bins | Bins with >0 counts | Bins with >2000 counts | High rate bins dominated by noise | Noise dominated (total time) | Noise dominated (detector-on time) | Marked lightcurve |
|---|---|---|---|---|---|---|---|
| A | 7785 | 6566 | 1 | 1 | 0.01% | 0.02% | 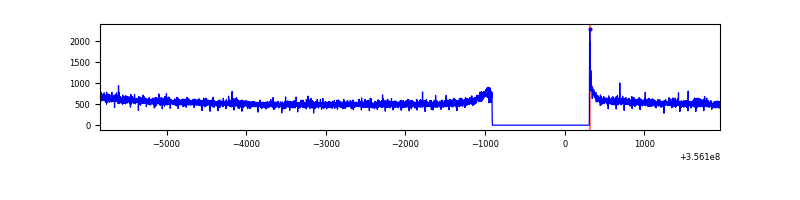 |
| B | 7785 | 6566 | 2 | 2 | 0.03% | 0.03% | 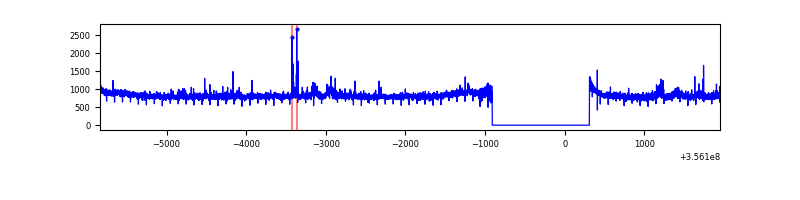 |
| C | 7785 | 6566 | 0 | 0 | 0.00% | 0.00% | 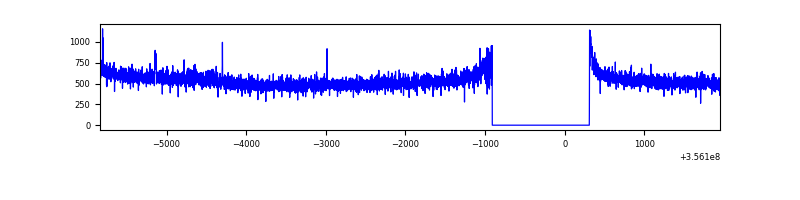 |
| D | 7785 | 6566 | 9 | 9 | 0.12% | 0.14% | 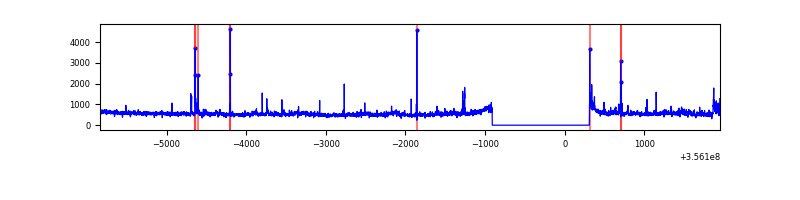 |
Top three noisy pixels from each quadrant. If the there are fewer than three noisy pixels in the level2.evt file, extra rows are filled as -1
| Pixel properties | Quadrant properties | ||||||
|---|---|---|---|---|---|---|---|
| Quadrant | DetID | PixID | Counts | Sigma | Mean | Median | Sigma |
| A | 8 | 192 | 13093 | 68.29 | 907 | 890 | 178.7 |
| A | 13 | 254 | 12931 | 67.38 | 907 | 890 | 178.7 |
| A | 3 | 137 | 8211 | 40.97 | 907 | 890 | 178.7 |
| B | 6 | 159 | 1864974 | 11372.17 | 880 | 862 | 163.9 |
| B | 6 | 36 | 51128 | 306.65 | 880 | 862 | 163.9 |
| B | 0 | 190 | 37784 | 225.25 | 880 | 862 | 163.9 |
| C | 14 | 238 | 140093 | 711.13 | 849 | 856 | 195.8 |
| C | 3 | 233 | 37484 | 187.07 | 849 | 856 | 195.8 |
| C | 2 | 114 | 15182 | 73.17 | 849 | 856 | 195.8 |
| D | 8 | 195 | 226636 | 1100.24 | 876 | 856 | 205.2 |
| D | 1 | 52 | 100401 | 485.09 | 876 | 856 | 205.2 |
| D | 2 | 250 | 54370 | 260.78 | 876 | 856 | 205.2 |
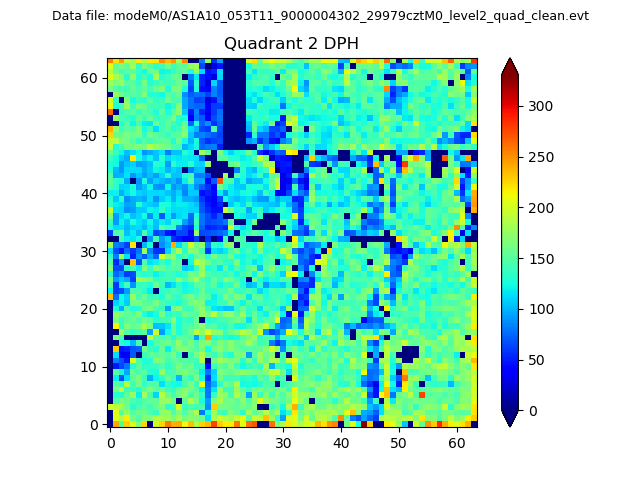
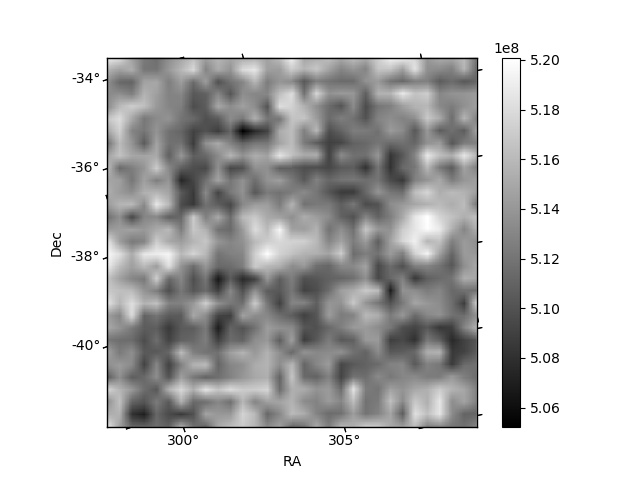
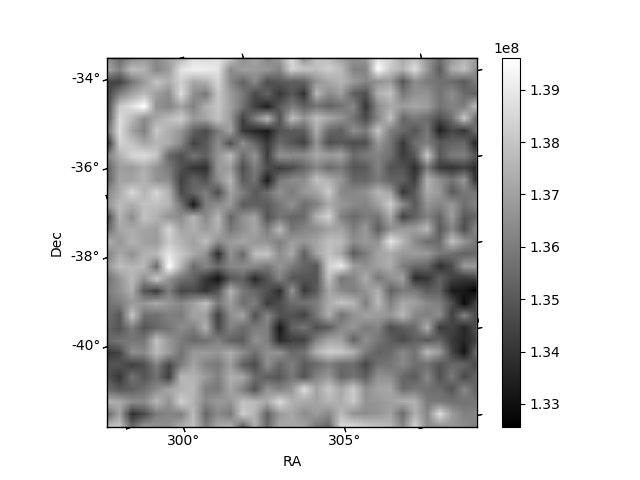
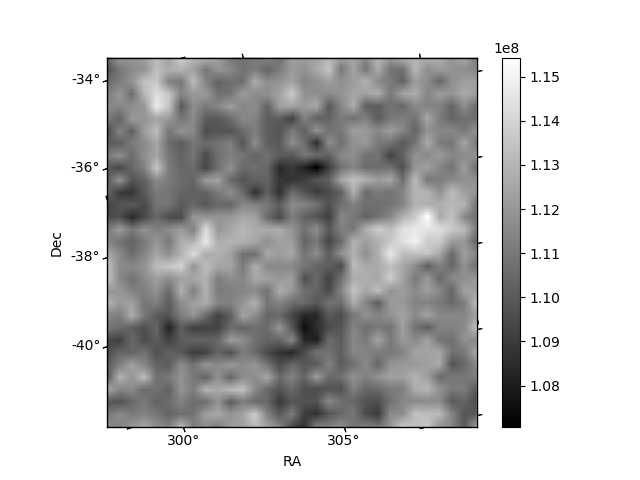
Histogram calculated using DETX and DETY for each event in the final _common_clean file
| Quadrant A | 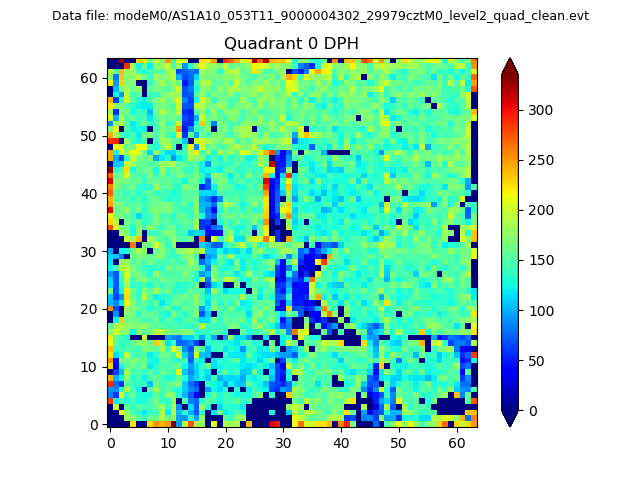 |
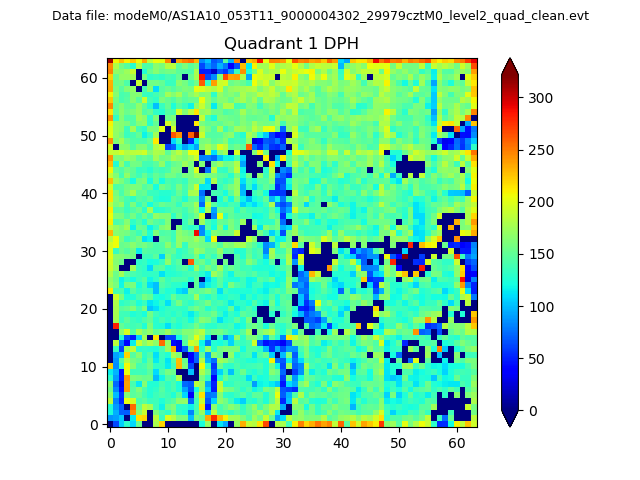 |
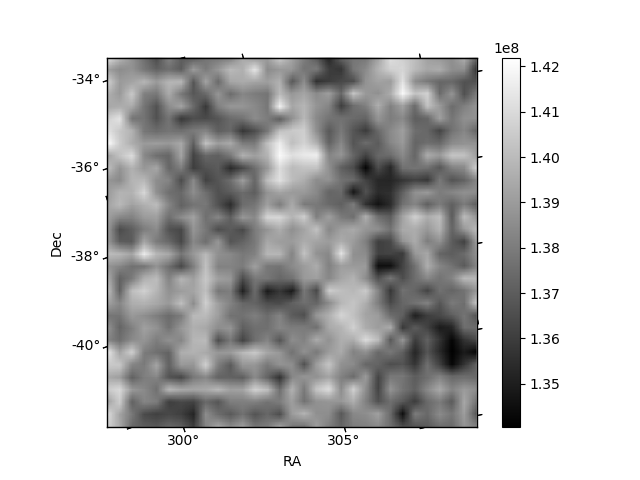
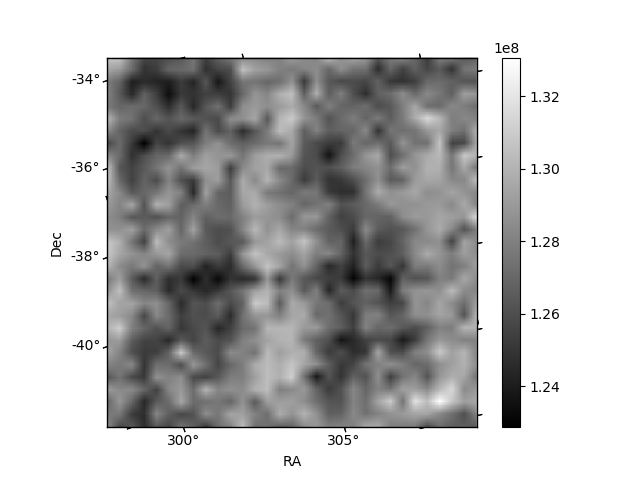
Quadrant B |
|---|---|---|---|
| Quadrant D | 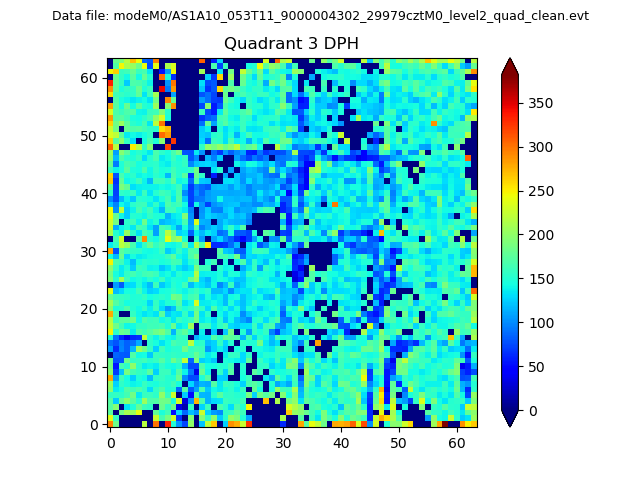 |
 |
Quadrant C |
| Plot type | Count rate plots | Images |
|---|---|---|
| Comparison with Poisson distribution Blue bars denote a histogram of data divided into 1 sec bins. Red curve is a Poisson curve with rate = median count rate of data. |
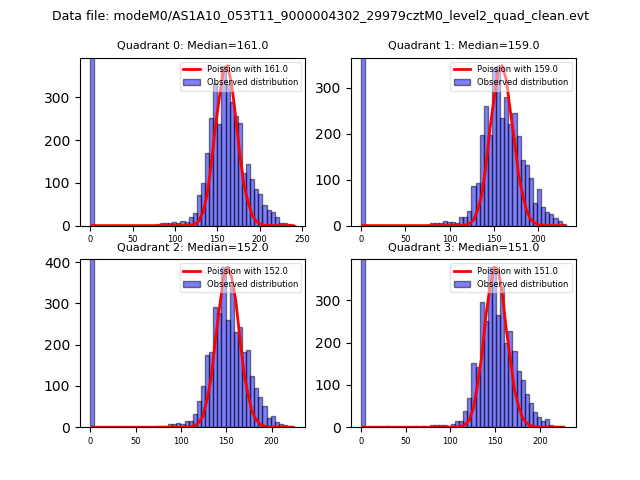 |
 |
| Quadrant-wise count rates Data is divided into 100 sec bins |
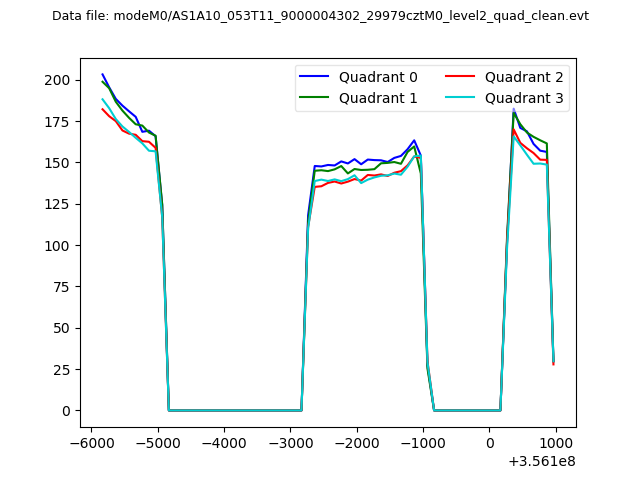 |
|
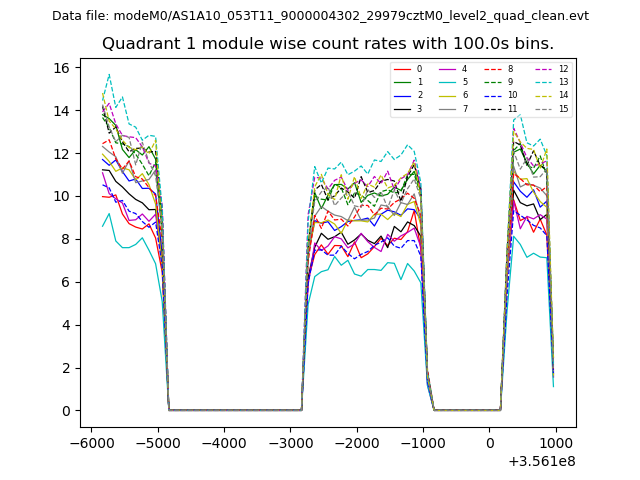
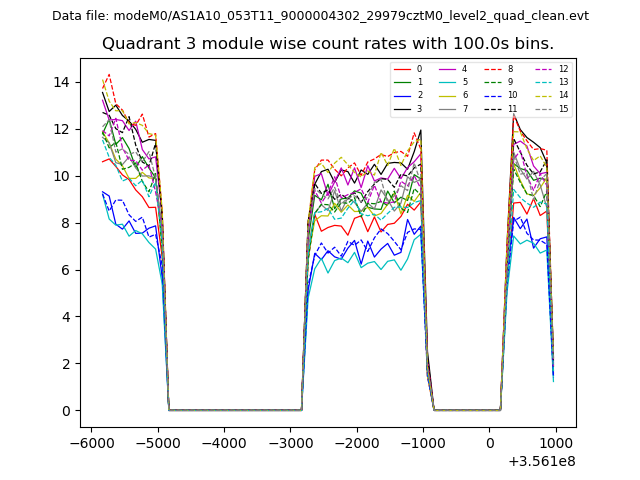
| Module-wise count rates for Quadrant A Data is divided into 100 sec bins |
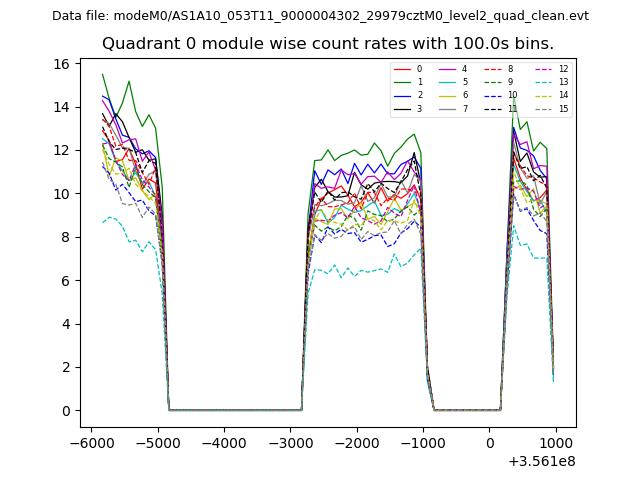 |
 |
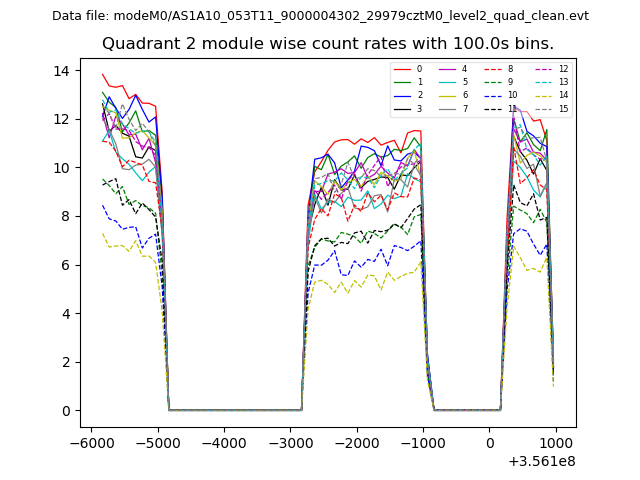
| Module-wise count rates for Quadrant B Data is divided into 100 sec bins |
 |
 |
| Module-wise count rates for Quadrant C Data is divided into 100 sec bins |
 |
 |
| Module-wise count rates for Quadrant D Data is divided into 100 sec bins |
 |
 |
| Parameter | Plot |
|---|---|
| CZT HV Monitor | 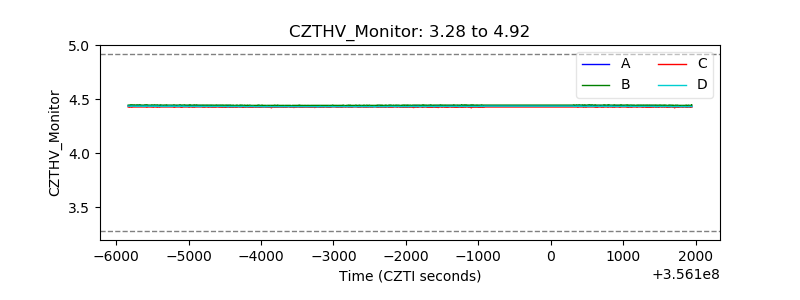 |
| D_VDD | 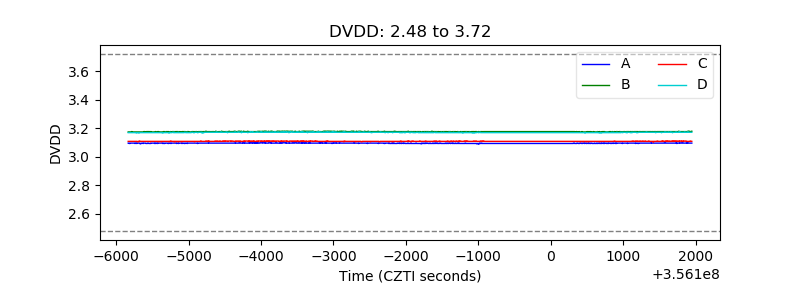 |
| Temperature 1 | 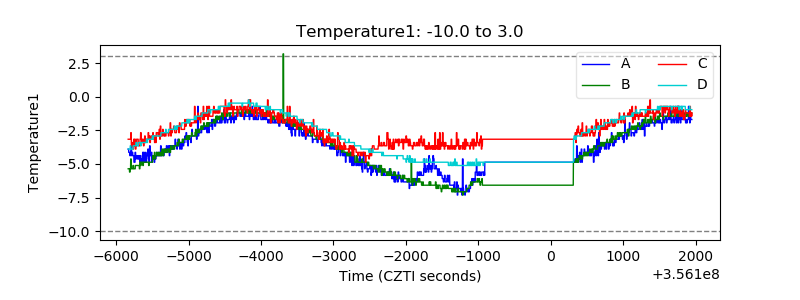 |
| Veto HV Monitor | 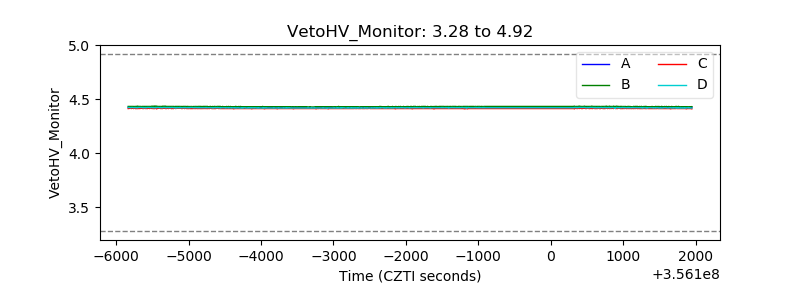 |
| Veto LLD | 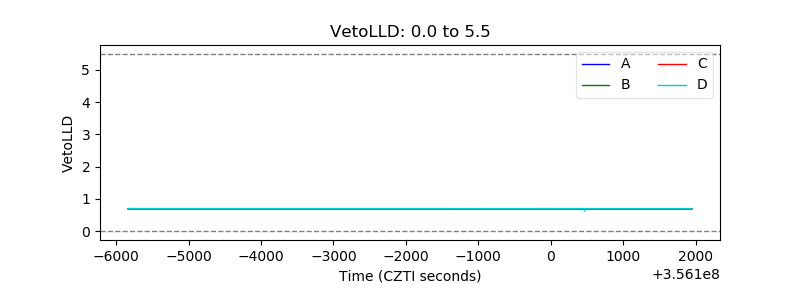 |
| Alpha Counter | 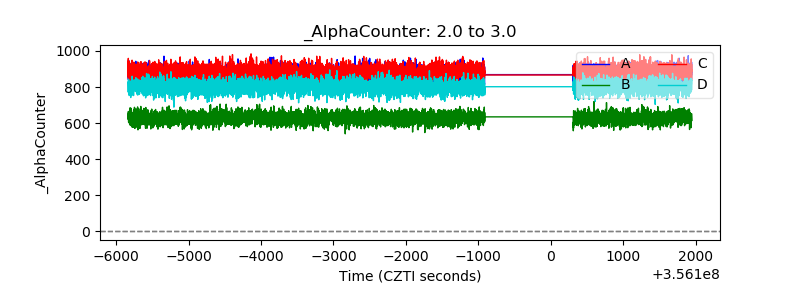 |
| _CPM_Rate | 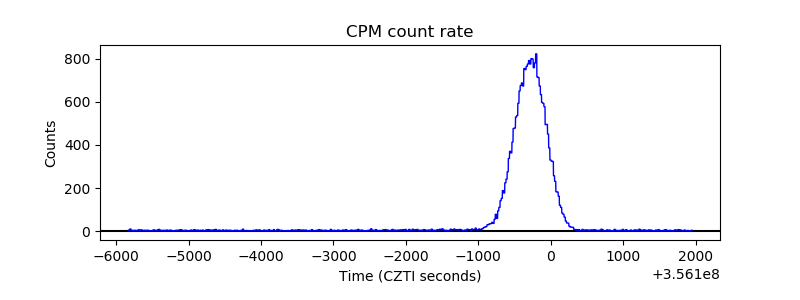 |
| CZT Counter | 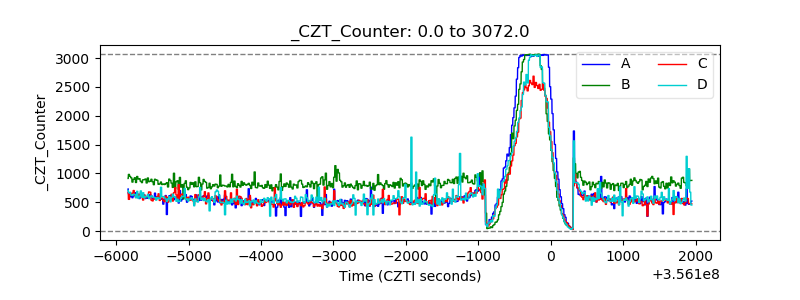 |
| +2.5 Volts monitor |  |
| +5 Volts monitor |  |
| _ROLL_ROT | 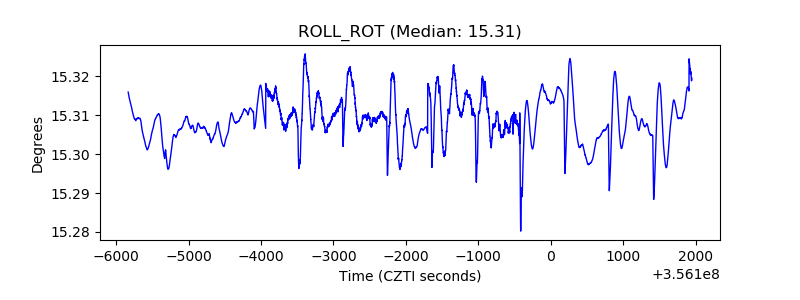 |
| _Roll_DEC | 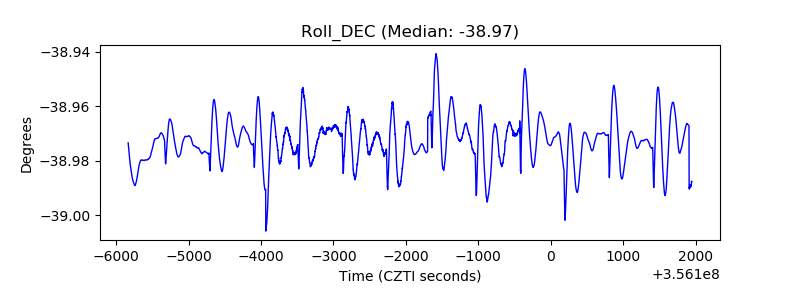 |
| _Roll_RA | 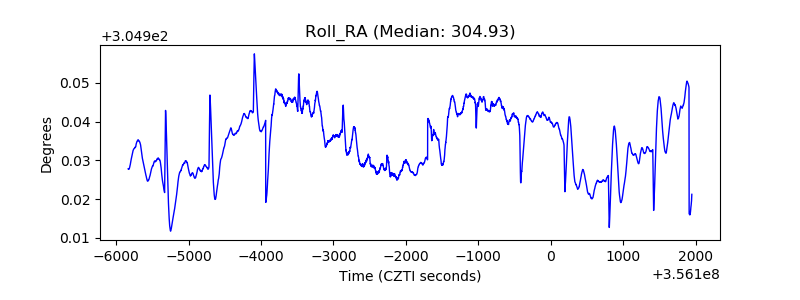 |
| Veto Counter | 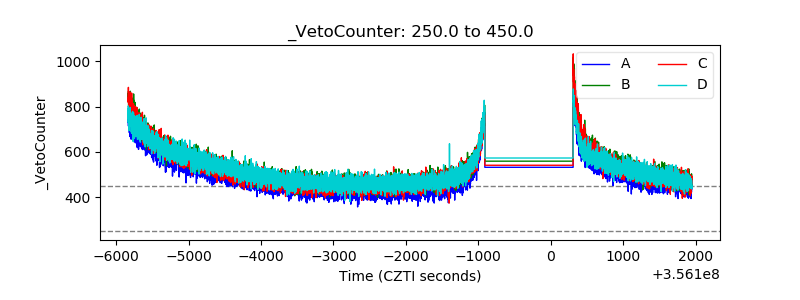 |