| Param | Original file | Final file |
|---|---|---|
| Filename | modeM0/AS1A10_053T11_9000004302_29980cztM0_level2.evt | modeM0/AS1A10_053T11_9000004302_29980cztM0_level2_quad_clean.evt |
| Size (bytes) | 288,959,040 | 34,001,280 |
| Size | 275.6 MB | 32.4 MB |
| Events in quadrant A | 1,738,190 | 203,043 |
| Events in quadrant B | 2,902,379 | 201,148 |
| Events in quadrant C | 1,889,447 | 189,629 |
| Events in quadrant D | 1,983,710 | 188,574 |
| Mode SS | |||
|---|---|---|---|
| Quadrant | BADHDUFLAG | Total packets | Discarded packets |
| A | 0 | 70 | 0 |
| B | 0 | 70 | 0 |
| C | 0 | 70 | 0 |
| D | 0 | 70 | 0 |
| Mode M0 | |||
|---|---|---|---|
| Quadrant | BADHDUFLAG | Total packets | Discarded packets |
| A | 0 | 7180 | 0 |
| B | 0 | 10834 | 0 |
| C | 0 | 7624 | 0 |
| D | 0 | 8074 | 0 |
| Quadrant | Total seconds | Saturated seconds | Saturation percentage |
|---|---|---|---|
| A | 3479 | 4 | 0.114976% |
| B | 3479 | 23 | 0.661110% |
| C | 3479 | 58 | 1.667146% |
| D | 3480 | 7 | 0.201149% |
Noise dominated data is calculated using 1-second bins in cleaned event files. If a bin has >2000 counts, and if more than 50% of those come from <1% of pixels, then it is considered to be noise-dominated and hence unusable.
| Quadrant | # 1 sec bins | Bins with >0 counts | Bins with >2000 counts | High rate bins dominated by noise | Noise dominated (total time) | Noise dominated (detector-on time) | Marked lightcurve |
|---|---|---|---|---|---|---|---|
| A | 3479 | 3479 | 0 | 0 | 0.00% | 0.00% |  |
| B | 3479 | 3479 | 2 | 2 | 0.06% | 0.06% |  |
| C | 3479 | 3479 | 31 | 31 | 0.89% | 0.89% |  |
| D | 3480 | 3480 | 4 | 4 | 0.11% | 0.11% |  |
Top three noisy pixels from each quadrant. If the there are fewer than three noisy pixels in the level2.evt file, extra rows are filled as -1
| Pixel properties | Quadrant properties | ||||||
|---|---|---|---|---|---|---|---|
| Quadrant | DetID | PixID | Counts | Sigma | Mean | Median | Sigma |
| A | 13 | 254 | 6717 | 69.51 | 449 | 440 | 90.3 |
| A | 3 | 137 | 4062 | 40.1 | 449 | 440 | 90.3 |
| A | 0 | 226 | 3858 | 37.85 | 449 | 440 | 90.3 |
| B | 6 | 159 | 995914 | 11927.32 | 438 | 429 | 83.5 |
| B | 6 | 36 | 150819 | 1801.88 | 438 | 429 | 83.5 |
| B | 0 | 190 | 16244 | 189.49 | 438 | 429 | 83.5 |
| C | 3 | 233 | 187992 | 1927.58 | 417 | 420 | 97.3 |
| C | 14 | 238 | 70741 | 722.65 | 417 | 420 | 97.3 |
| C | 2 | 114 | 8101 | 78.93 | 417 | 420 | 97.3 |
| D | 1 | 52 | 206131 | 2002.33 | 430 | 419 | 102.7 |
| D | 8 | 195 | 77501 | 750.29 | 430 | 419 | 102.7 |
| D | 7 | 69 | 21463 | 204.84 | 430 | 419 | 102.7 |
Histogram calculated using DETX and DETY for each event in the final _common_clean file
| Quadrant A |  |
 |
Quadrant B |
|---|---|---|---|
| Quadrant D |  |
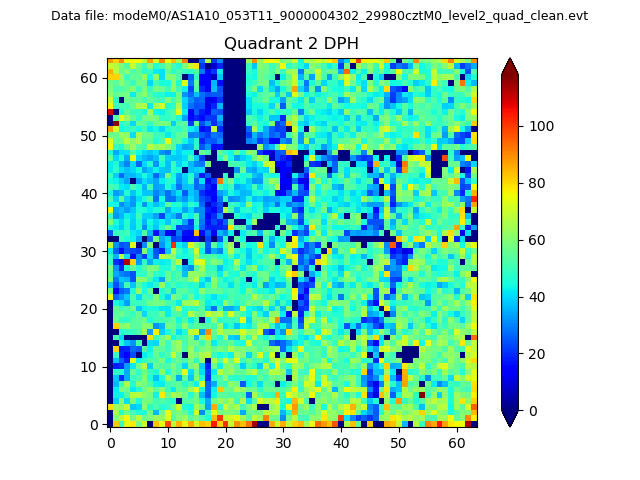 |
Quadrant C |
| Plot type | Count rate plots | Images |
|---|---|---|
| Comparison with Poisson distribution Blue bars denote a histogram of data divided into 1 sec bins. Red curve is a Poisson curve with rate = median count rate of data. |
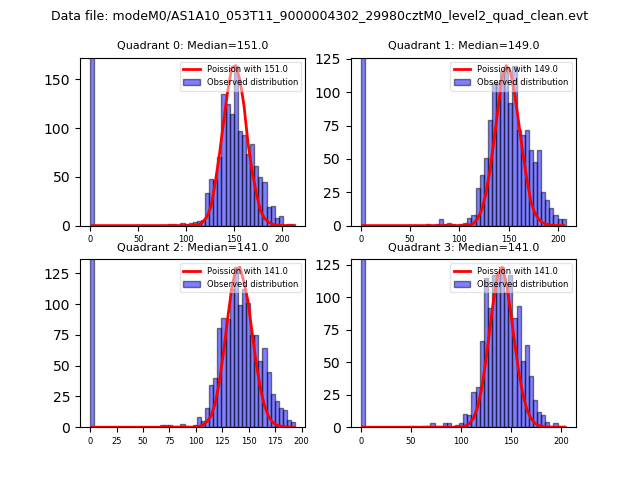 |
 |
| Quadrant-wise count rates Data is divided into 100 sec bins |
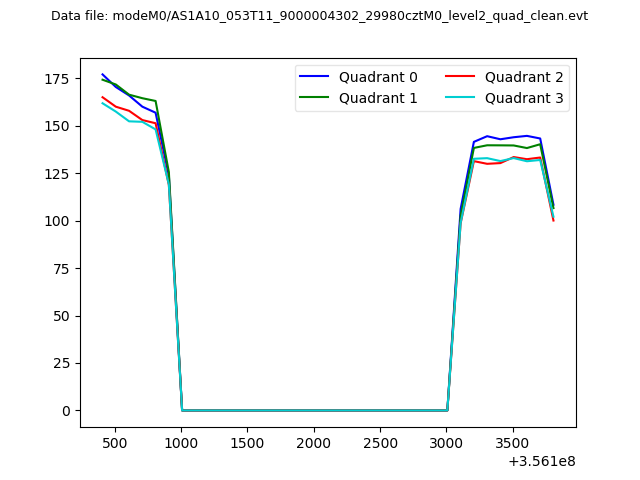 |
|
| Module-wise count rates for Quadrant A Data is divided into 100 sec bins |
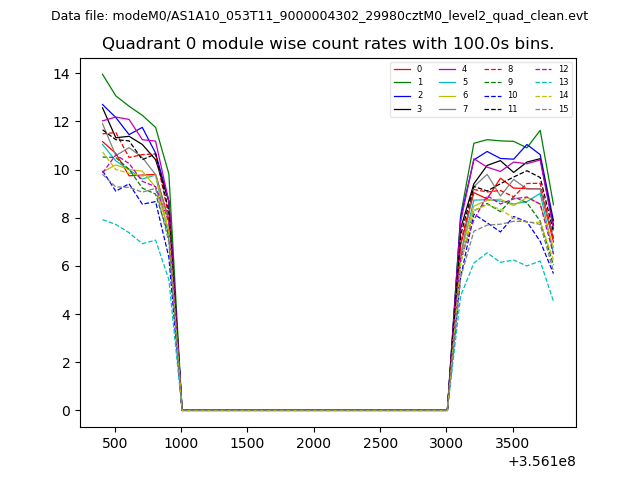 |
 |
| Module-wise count rates for Quadrant B Data is divided into 100 sec bins |
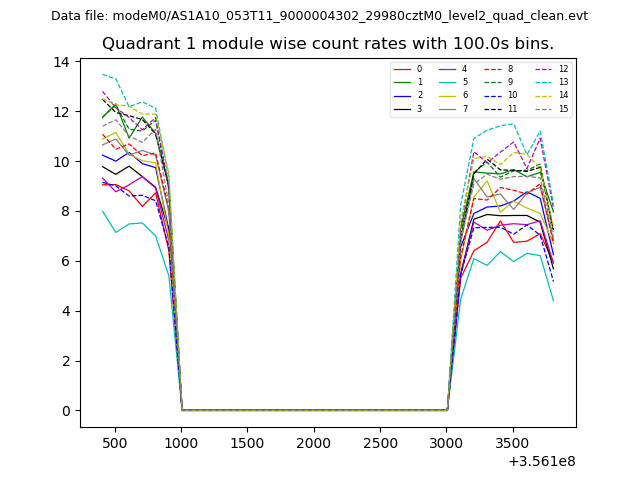 |
 |
| Module-wise count rates for Quadrant C Data is divided into 100 sec bins |
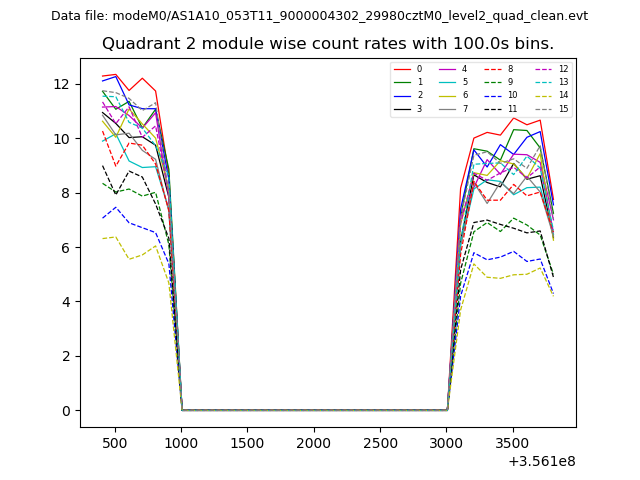 |
 |
| Module-wise count rates for Quadrant D Data is divided into 100 sec bins |
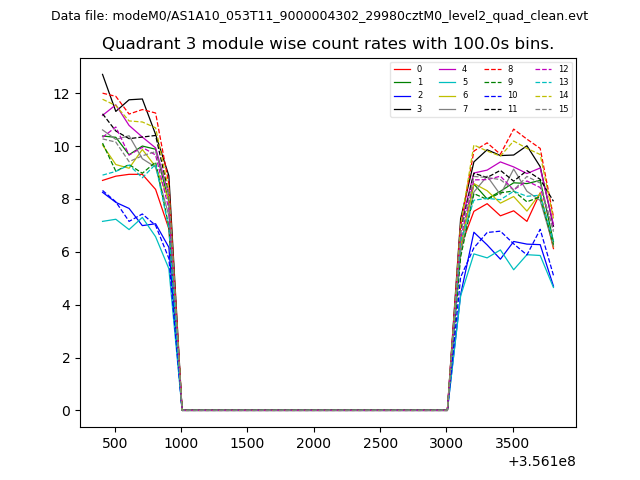 |
 |
| Parameter | Plot |
|---|---|
| CZT HV Monitor | 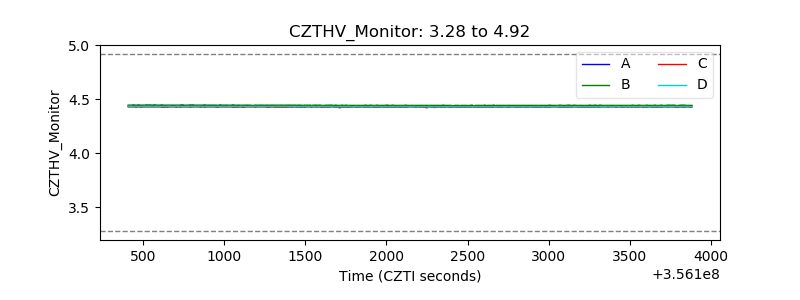 |
| D_VDD |  |
| Temperature 1 |  |
| Veto HV Monitor | 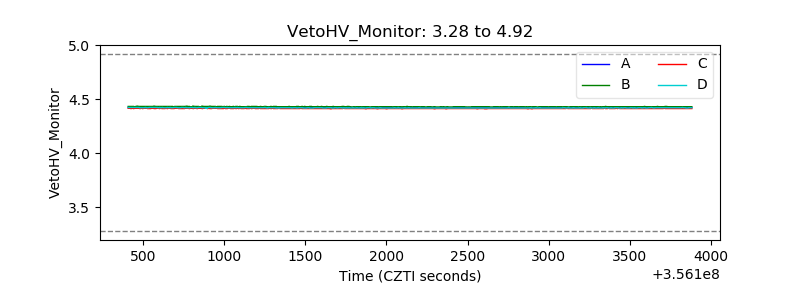 |
| Veto LLD |  |
| Alpha Counter | 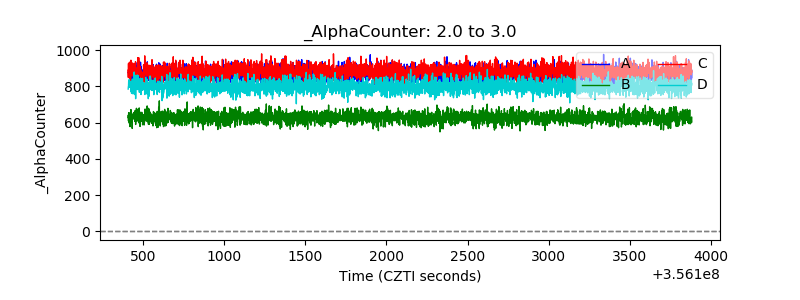 |
| _CPM_Rate | 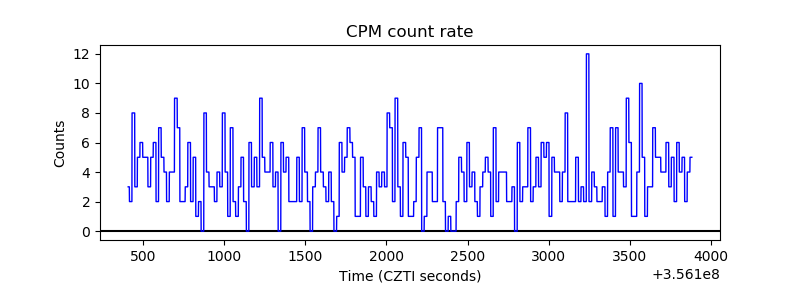 |
| CZT Counter | 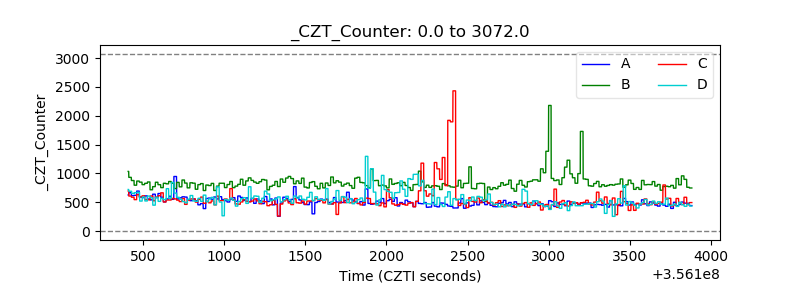 |
| +2.5 Volts monitor |  |
| +5 Volts monitor |  |
| _ROLL_ROT | 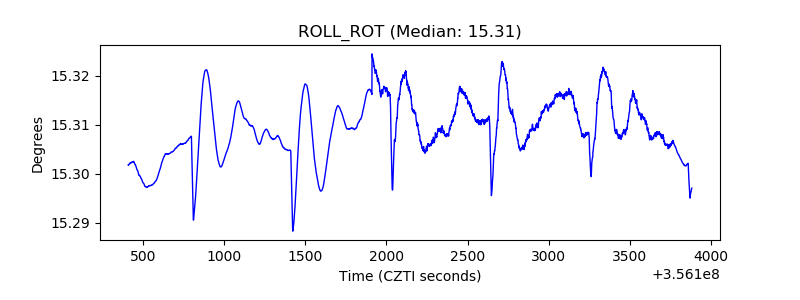 |
| _Roll_DEC | 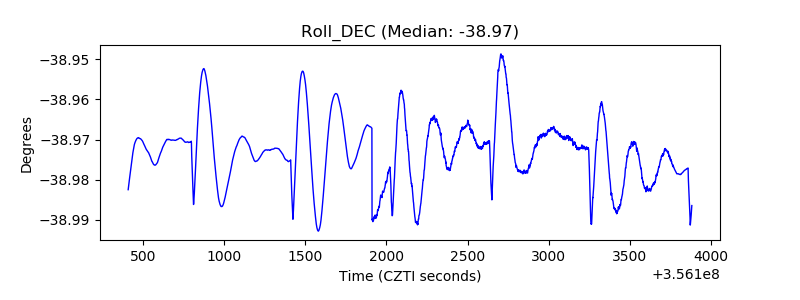 |
| _Roll_RA | 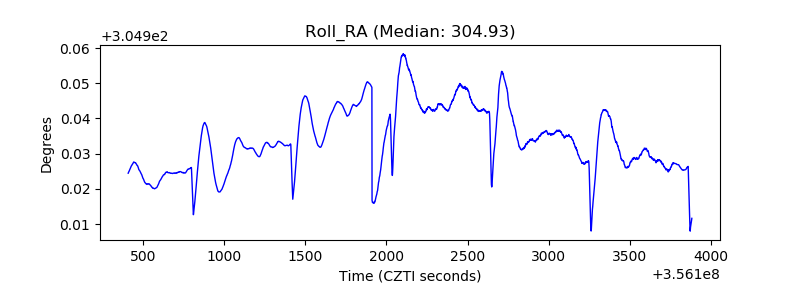 |
| Veto Counter | 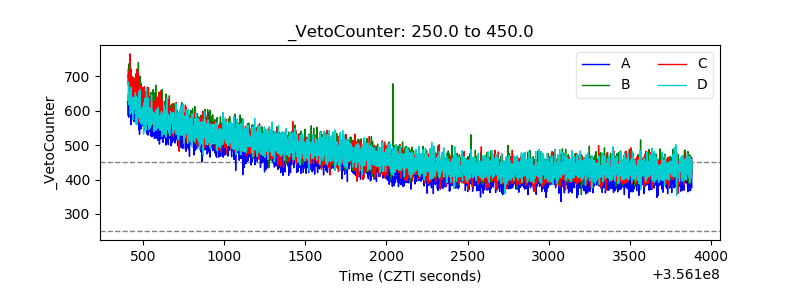 |