| Param | Original file | Final file |
|---|---|---|
| Filename | modeM0/AS1A10_071T05_9000004308cztM0_level2.fits | modeM0/AS1A10_071T05_9000004308cztM0_level2_quad_clean.evt |
| Size (bytes) | 544,746,240 | 366,874,560 |
| Size | 519.5 MB | 349.9 MB |
| Events in quadrant A | 3,495,336 | 2,028,601 |
| Events in quadrant B | 3,248,840 | 1,998,012 |
| Events in quadrant C | 3,327,332 | 1,897,531 |
| Events in quadrant D | 2,839,346 | 1,597,929 |
| Mode M0 | |||
|---|---|---|---|
| Quadrant | BADHDUFLAG | Total packets | Discarded packets |
| A | 0 | 111304 | 0 |
| B | 0 | 159207 | 0 |
| C | 0 | 111336 | 0 |
| D | 0 | 154102 | 0 |
| Mode SS | |||
|---|---|---|---|
| Quadrant | BADHDUFLAG | Total packets | Discarded packets |
| A | 0 | 1082 | 0 |
| B | 0 | 1078 | 0 |
| C | 0 | 1074 | 0 |
| D | 0 | 1076 | 0 |
| Mode M9 | |||
|---|---|---|---|
| Quadrant | BADHDUFLAG | Total packets | Discarded packets |
| A | 0 | 102 | 0 |
| B | 0 | 102 | 0 |
| C | 0 | 102 | 0 |
| D | 0 | 102 | 0 |
| Quadrant | Total seconds | Saturated seconds | Saturation percentage |
|---|---|---|---|
| A | 52226 | 621 | 1.189063% |
| B | 52265 | 1059 | 2.026213% |
| C | 52248 | 933 | 1.785714% |
| D | 52076 | 4262 | 8.184192% |
Noise dominated data is calculated using 1-second bins in cleaned event files. If a bin has >2000 counts, and if more than 50% of those come from <1% of pixels, then it is considered to be noise-dominated and hence unusable.
| Quadrant | # 1 sec bins | Bins with >0 counts | Bins with >2000 counts | High rate bins dominated by noise | Noise dominated (total time) | Noise dominated (detector-on time) | Marked lightcurve |
|---|---|---|---|---|---|---|---|
| A | 63730 | 52631 | 0 | 0 | 0.00% | 0.00% |  |
| B | 63730 | 52672 | 0 | 0 | 0.00% | 0.00% | 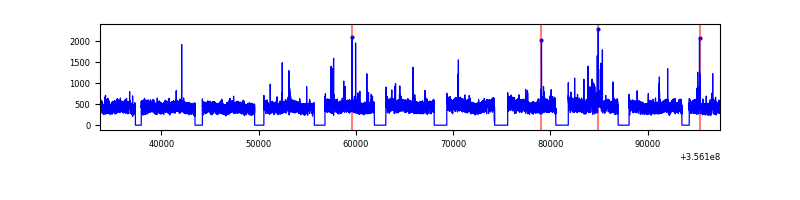 |
| C | 63730 | 52633 | 0 | 0 | 0.00% | 0.00% |  |
| D | 63730 | 52455 | 0 | 0 | 0.00% | 0.00% | 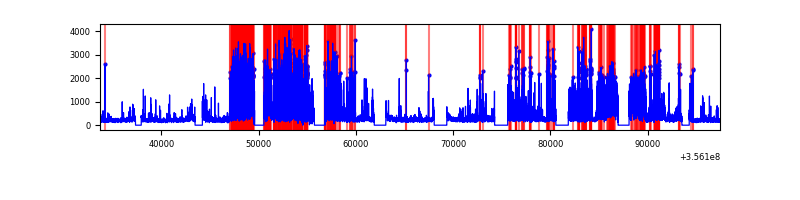 |
Top three noisy pixels from each quadrant. If the there are fewer than three noisy pixels in the level2.evt file, extra rows are filled as -1
| Pixel properties | Quadrant properties | ||||||
|---|---|---|---|---|---|---|---|
| Quadrant | DetID | PixID | Counts | Sigma | Mean | Median | Sigma |
| A | 0 | 29 | 3321 | 11.1 | 911 | 857 | 222.1 |
| A | 7 | 110 | 2659 | 8.11 | 911 | 857 | 222.1 |
| A | 0 | 30 | 2633 | 8.0 | 911 | 857 | 222.1 |
| B | 2 | 9 | 2619 | 10.4 | 860 | 822 | 172.8 |
| B | 2 | 8 | 2186 | 7.89 | 860 | 822 | 172.8 |
| B | 3 | 17 | 2127 | 7.55 | 860 | 822 | 172.8 |
| C | 1 | 81 | 2530 | 7.7 | 877 | 826 | 221.2 |
| C | 1 | 80 | 2502 | 7.58 | 877 | 826 | 221.2 |
| C | 12 | 241 | 2283 | 6.59 | 877 | 826 | 221.2 |
| D | 15 | 46 | 2096 | 6.35 | 811 | 742 | 213.3 |
| D | 10 | 189 | 2081 | 6.28 | 811 | 742 | 213.3 |
| D | 7 | 3 | 2052 | 6.14 | 811 | 742 | 213.3 |
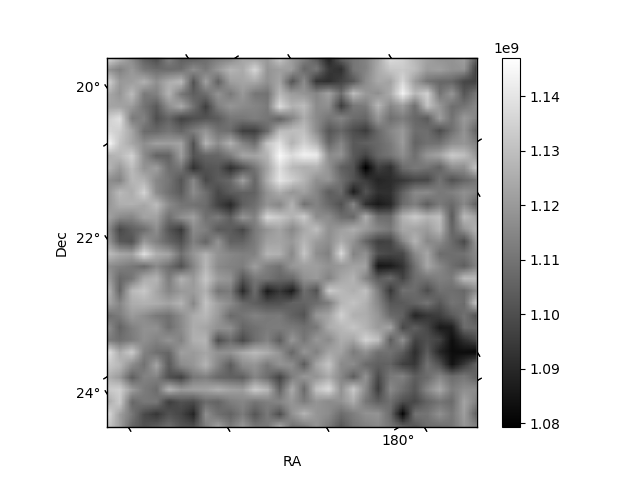
Histogram calculated using DETX and DETY for each event in the final _common_clean file
| Quadrant A |  |
 |
Quadrant B |
|---|---|---|---|
| Quadrant D |  |
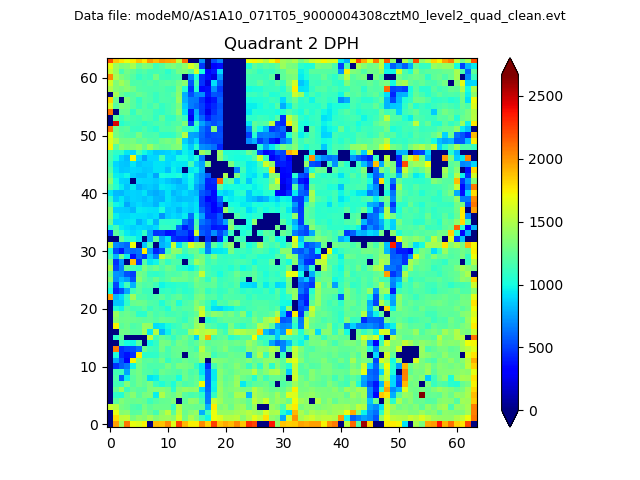 |
Quadrant C |
| Plot type | Count rate plots | Images |
|---|---|---|
| Comparison with Poisson distribution Blue bars denote a histogram of data divided into 1 sec bins. Red curve is a Poisson curve with rate = median count rate of data. |
 |
 |
| Quadrant-wise count rates Data is divided into 100 sec bins |
 |
|
| Module-wise count rates for Quadrant A Data is divided into 100 sec bins |
 |
 |
| Module-wise count rates for Quadrant B Data is divided into 100 sec bins |
 |
 |
| Module-wise count rates for Quadrant C Data is divided into 100 sec bins |
 |
 |
| Module-wise count rates for Quadrant D Data is divided into 100 sec bins |
 |
 |
| Parameter | Plot |
|---|---|
| CZT HV Monitor |  |
| D_VDD |  |
| Temperature 1 |  |
| Veto HV Monitor | 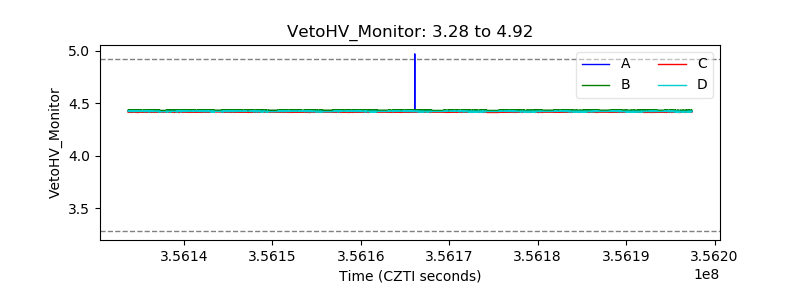 |
| Veto LLD |  |
| Alpha Counter |  |
| _CPM_Rate | 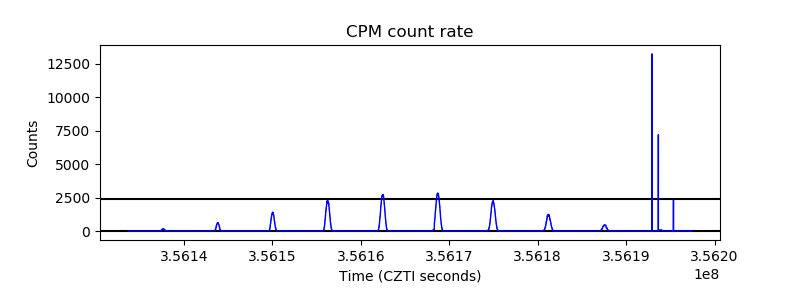 |
| CZT Counter |  |
| +2.5 Volts monitor | 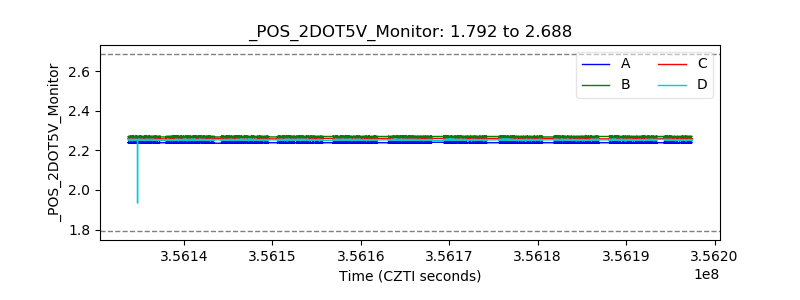 |
| +5 Volts monitor |  |
| _ROLL_ROT |  |
| _Roll_DEC |  |
| _Roll_RA | 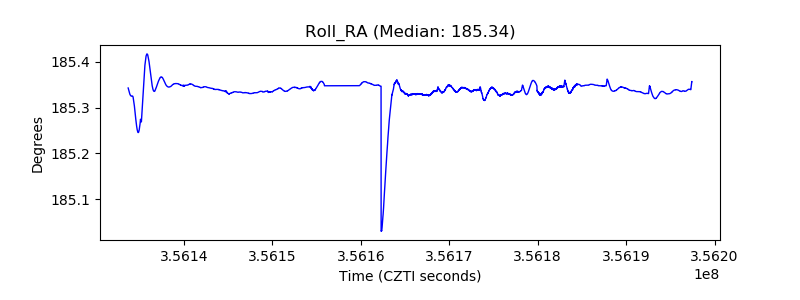 |
| Veto Counter |  |