| Param | Original file | Final file |
|---|---|---|
| Filename | modeM0/AS1A10_071T05_9000004308_29989cztM0_level2.evt | modeM0/AS1A10_071T05_9000004308_29989cztM0_level2_quad_clean.evt |
| Size (bytes) | 685,103,040 | 79,790,400 |
| Size | 653.4 MB | 76.1 MB |
| Events in quadrant A | 3,266,791 | 515,361 |
| Events in quadrant B | 5,067,429 | 521,483 |
| Events in quadrant C | 3,416,359 | 492,791 |
| Events in quadrant D | 8,553,709 | 427,547 |
| Mode M0 | |||
|---|---|---|---|
| Quadrant | BADHDUFLAG | Total packets | Discarded packets |
| A | 0 | 13692 | 2 |
| B | 0 | 19823 | 2 |
| C | 0 | 14099 | 2 |
| D | 0 | 30040 | 2 |
| Mode SS | |||
|---|---|---|---|
| Quadrant | BADHDUFLAG | Total packets | Discarded packets |
| A | 0 | 134 | 0 |
| B | 0 | 134 | 0 |
| C | 0 | 134 | 0 |
| D | 0 | 134 | 0 |
| Mode M9 | |||
|---|---|---|---|
| Quadrant | BADHDUFLAG | Total packets | Discarded packets |
| A | 0 | 14 | 0 |
| B | 0 | 15 | 0 |
| C | 0 | 15 | 0 |
| D | 0 | 15 | 0 |
| Quadrant | Total seconds | Saturated seconds | Saturation percentage |
|---|---|---|---|
| A | 6575 | 44 | 0.669202% |
| B | 6575 | 56 | 0.851711% |
| C | 6575 | 102 | 1.551331% |
| D | 6575 | 1552 | 23.604563% |
Noise dominated data is calculated using 1-second bins in cleaned event files. If a bin has >2000 counts, and if more than 50% of those come from <1% of pixels, then it is considered to be noise-dominated and hence unusable.
| Quadrant | # 1 sec bins | Bins with >0 counts | Bins with >2000 counts | High rate bins dominated by noise | Noise dominated (total time) | Noise dominated (detector-on time) | Marked lightcurve |
|---|---|---|---|---|---|---|---|
| A | 7666 | 6576 | 4 | 4 | 0.05% | 0.06% | 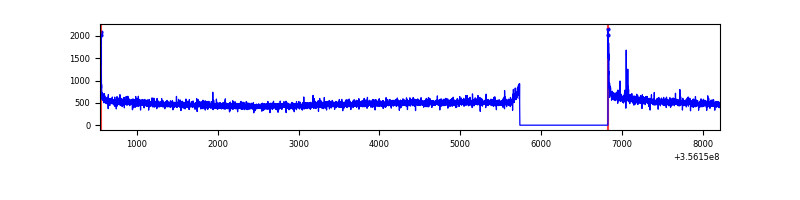 |
| B | 7666 | 6576 | 1 | 1 | 0.01% | 0.02% | 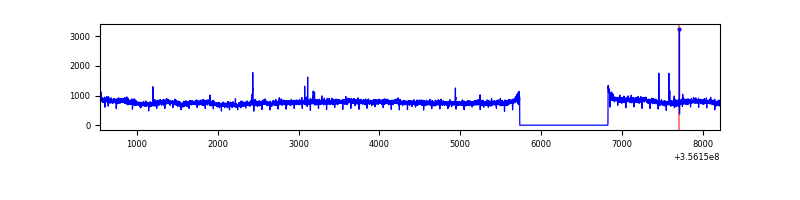 |
| C | 7666 | 6576 | 23 | 23 | 0.30% | 0.35% | 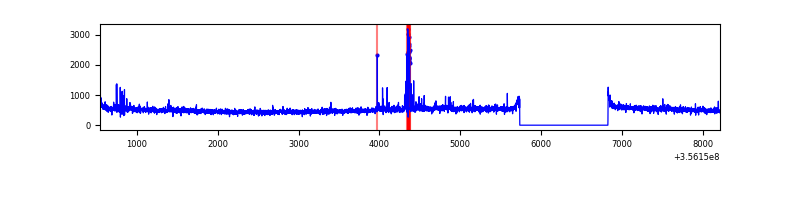 |
| D | 7666 | 6576 | 1243 | 1243 | 16.21% | 18.90% | 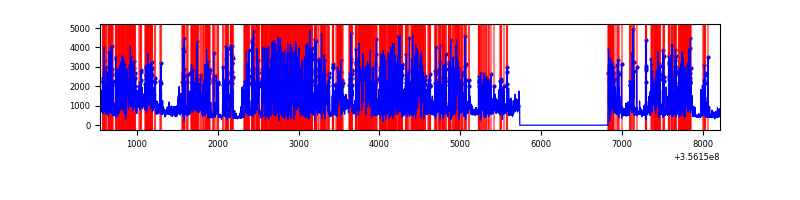 |
Top three noisy pixels from each quadrant. If the there are fewer than three noisy pixels in the level2.evt file, extra rows are filled as -1
| Pixel properties | Quadrant properties | ||||||
|---|---|---|---|---|---|---|---|
| Quadrant | DetID | PixID | Counts | Sigma | Mean | Median | Sigma |
| A | 8 | 192 | 32016 | 189.1 | 834 | 820 | 165.0 |
| A | 12 | 96 | 14754 | 84.46 | 834 | 820 | 165.0 |
| A | 13 | 254 | 11615 | 65.43 | 834 | 820 | 165.0 |
| B | 6 | 159 | 1797225 | 11374.76 | 826 | 805 | 157.9 |
| B | 12 | 111 | 19915 | 121.0 | 826 | 805 | 157.9 |
| B | 11 | 111 | 18082 | 109.4 | 826 | 805 | 157.9 |
| C | 3 | 233 | 164827 | 877.59 | 793 | 801 | 186.9 |
| C | 14 | 238 | 136447 | 725.74 | 793 | 801 | 186.9 |
| C | 2 | 114 | 15244 | 77.27 | 793 | 801 | 186.9 |
| D | 7 | 80 | 5627968 | 32910.43 | 720 | 702 | 171.0 |
| D | 8 | 195 | 125792 | 731.57 | 720 | 702 | 171.0 |
| D | 2 | 250 | 58484 | 337.93 | 720 | 702 | 171.0 |
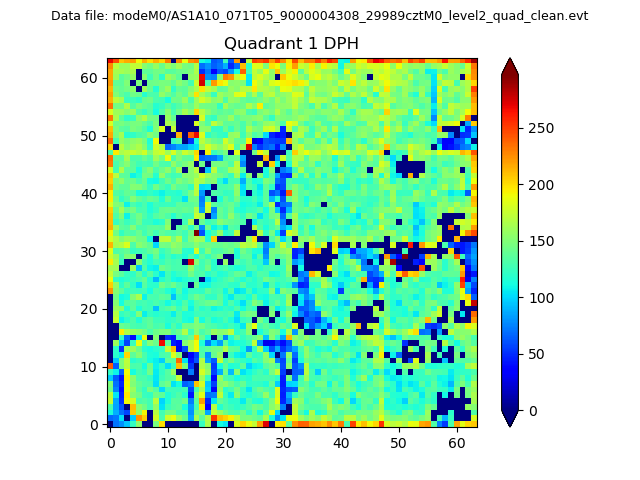
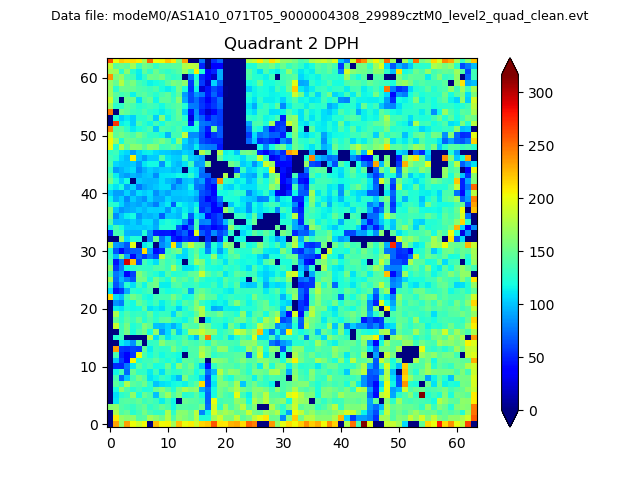
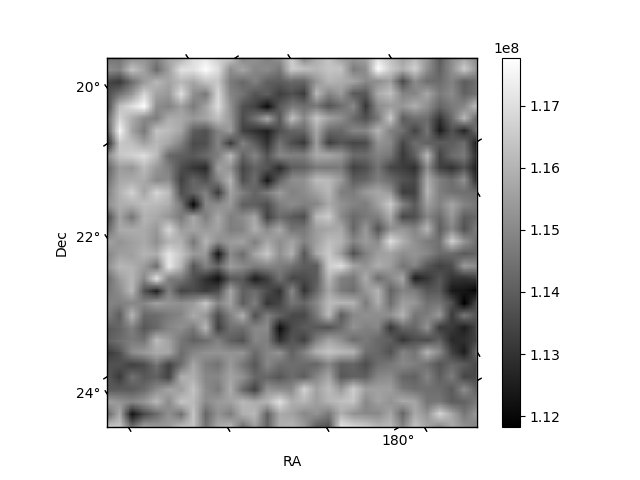
Histogram calculated using DETX and DETY for each event in the final _common_clean file
| Quadrant A |  |
 |
Quadrant B |
|---|---|---|---|
| Quadrant D | 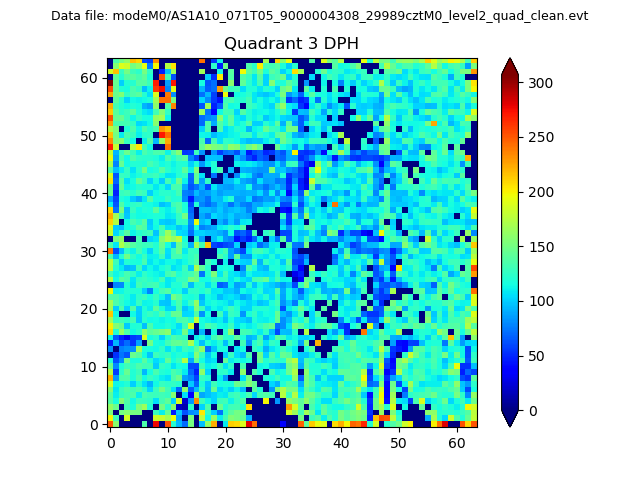 |
 |
Quadrant C |
| Plot type | Count rate plots | Images |
|---|---|---|
| Comparison with Poisson distribution Blue bars denote a histogram of data divided into 1 sec bins. Red curve is a Poisson curve with rate = median count rate of data. |
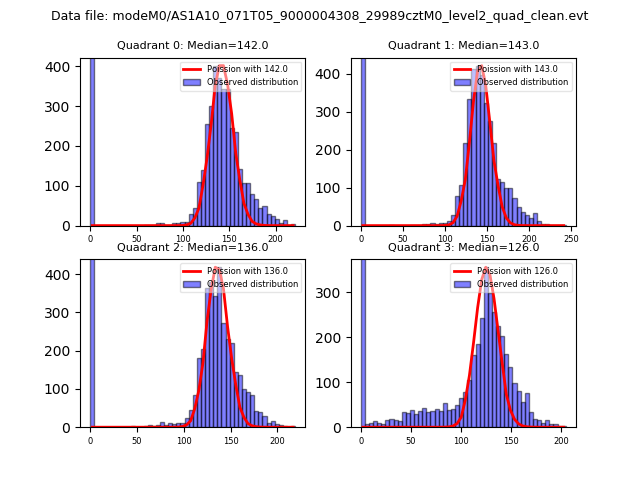 |
 |
| Quadrant-wise count rates Data is divided into 100 sec bins |
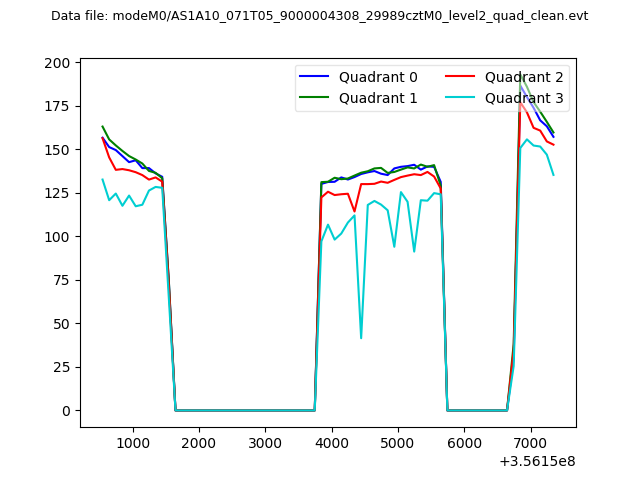 |
|
| Module-wise count rates for Quadrant A Data is divided into 100 sec bins |
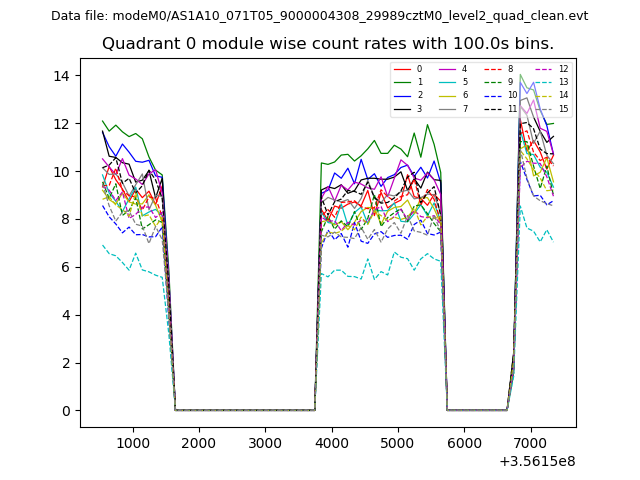 |
 |
| Module-wise count rates for Quadrant B Data is divided into 100 sec bins |
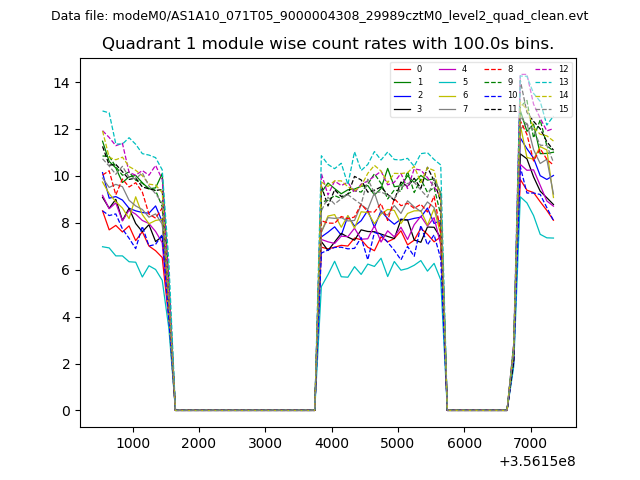 |
 |
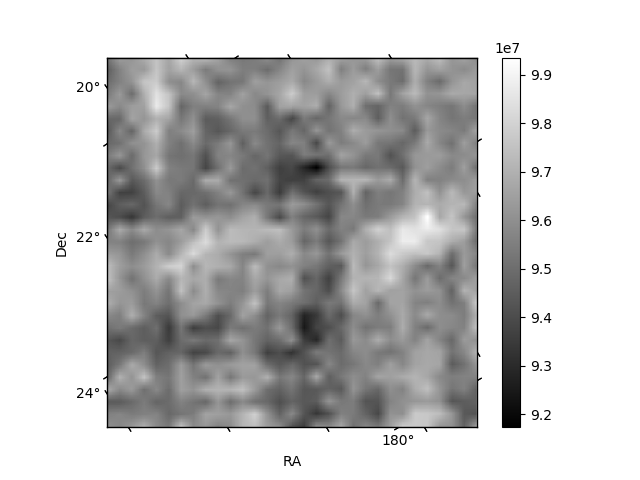
| Module-wise count rates for Quadrant C Data is divided into 100 sec bins |
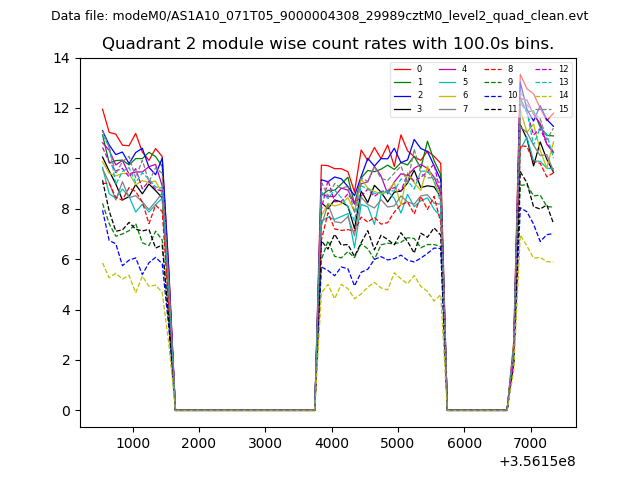 |
 |
| Module-wise count rates for Quadrant D Data is divided into 100 sec bins |
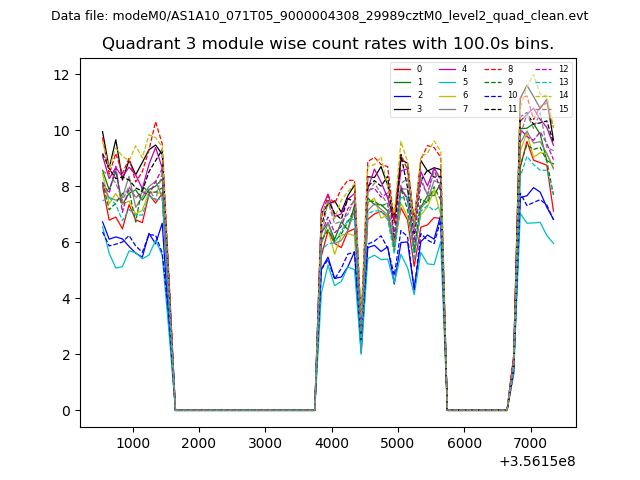 |
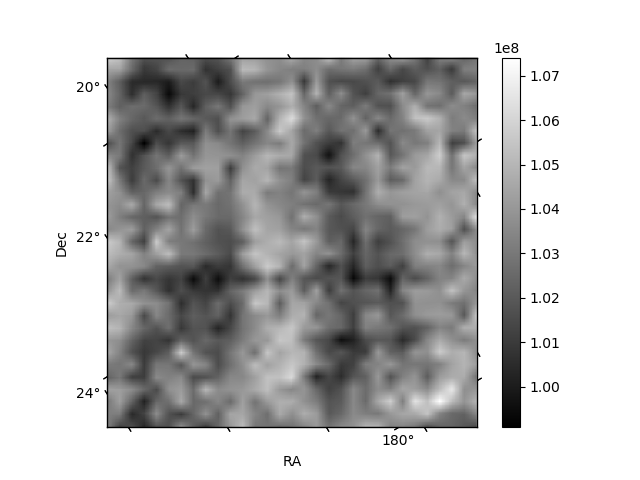 |
| Parameter | Plot |
|---|---|
| CZT HV Monitor | 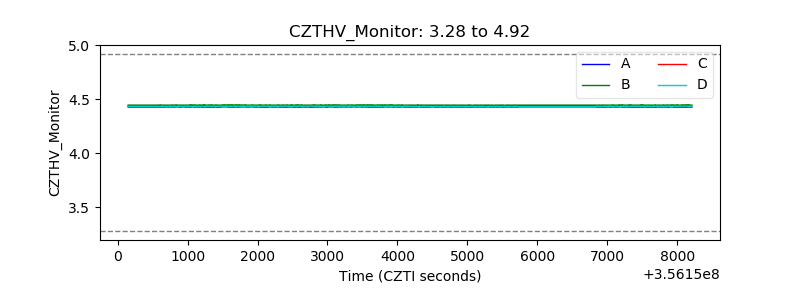 |
| D_VDD | 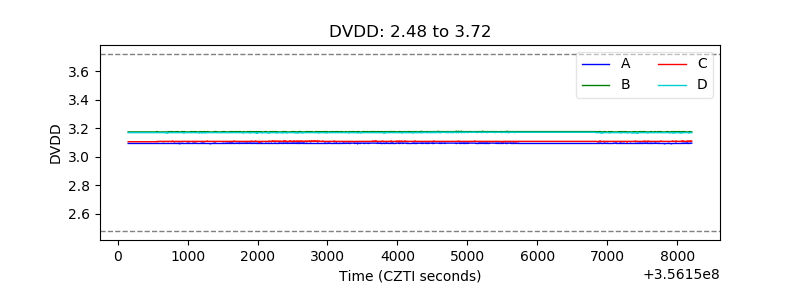 |
| Temperature 1 | 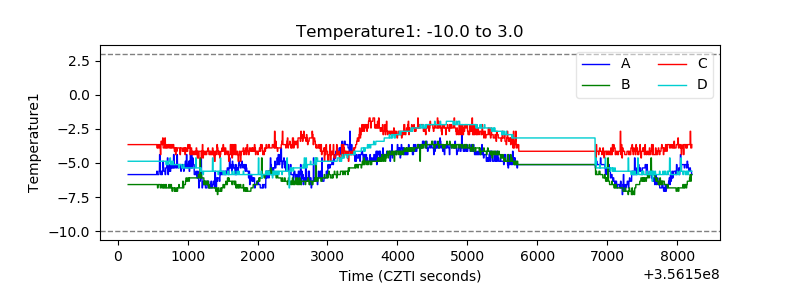 |
| Veto HV Monitor | 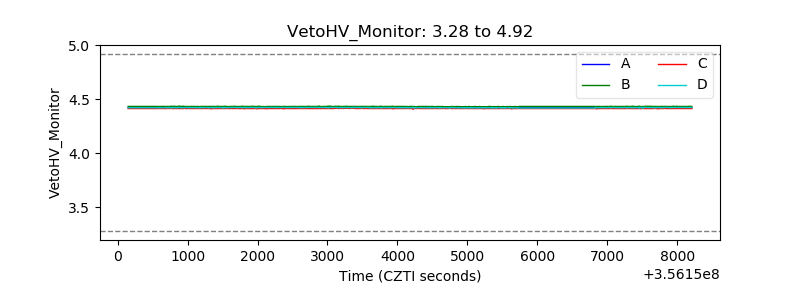 |
| Veto LLD | 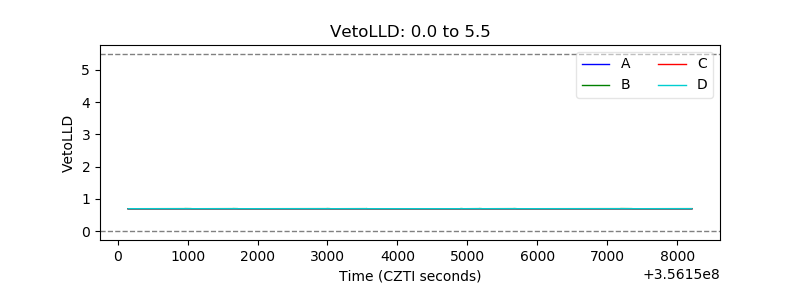 |
| Alpha Counter | 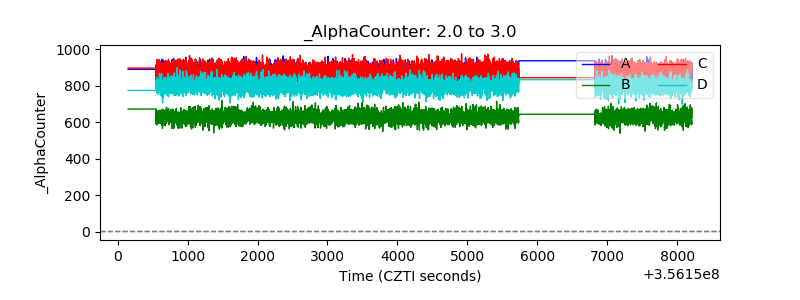 |
| _CPM_Rate | 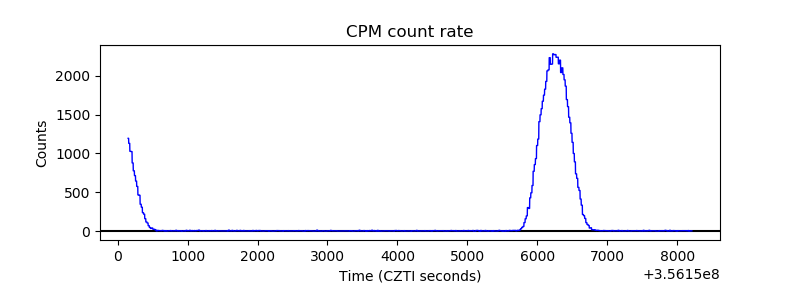 |
| CZT Counter | 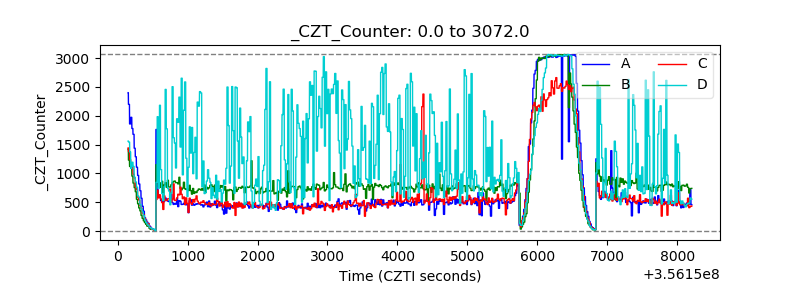 |
| +2.5 Volts monitor |  |
| +5 Volts monitor |  |
| _ROLL_ROT | 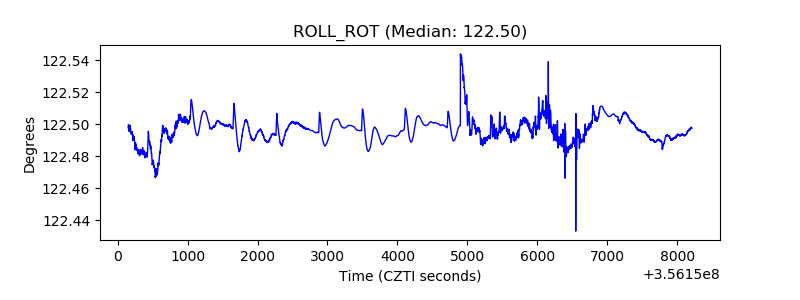 |
| _Roll_DEC | 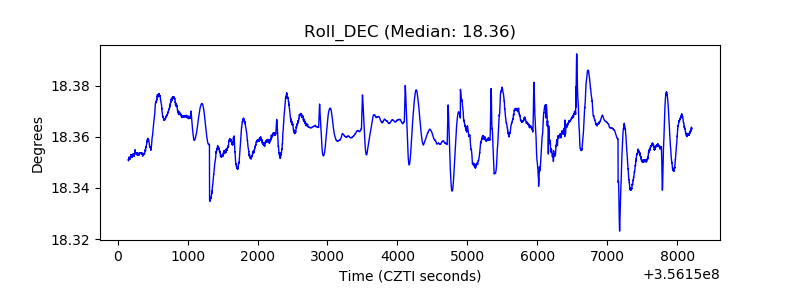 |
| _Roll_RA |  |
| Veto Counter | 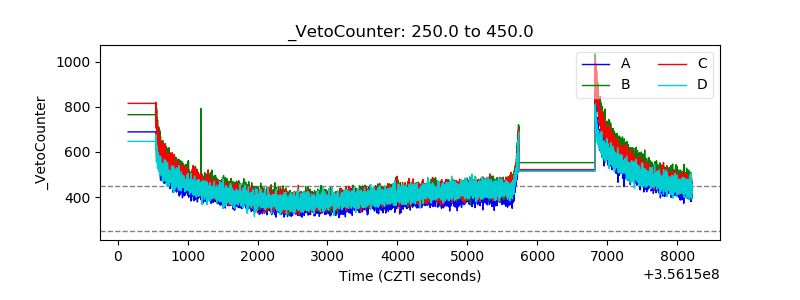 |