| Param | Original file | Final file |
|---|---|---|
| Filename | modeM0/AS1A10_071T05_9000004308_29990cztM0_level2.evt | modeM0/AS1A10_071T05_9000004308_29990cztM0_level2_quad_clean.evt |
| Size (bytes) | 556,223,040 | 73,477,440 |
| Size | 530.5 MB | 70.1 MB |
| Events in quadrant A | 3,302,156 | 461,274 |
| Events in quadrant B | 5,026,999 | 463,677 |
| Events in quadrant C | 3,324,512 | 438,856 |
| Events in quadrant D | 4,767,137 | 423,390 |
| Mode M0 | |||
|---|---|---|---|
| Quadrant | BADHDUFLAG | Total packets | Discarded packets |
| A | 0 | 13518 | 2 |
| B | 0 | 19099 | 3 |
| C | 0 | 13526 | 2 |
| D | 0 | 18102 | 2 |
| Mode SS | |||
|---|---|---|---|
| Quadrant | BADHDUFLAG | Total packets | Discarded packets |
| A | 0 | 128 | 0 |
| B | 0 | 128 | 0 |
| C | 0 | 128 | 0 |
| D | 0 | 128 | 0 |
| Mode M9 | |||
|---|---|---|---|
| Quadrant | BADHDUFLAG | Total packets | Discarded packets |
| A | 0 | 17 | 0 |
| B | 0 | 18 | 0 |
| C | 0 | 18 | 0 |
| D | 0 | 18 | 0 |
| Quadrant | Total seconds | Saturated seconds | Saturation percentage |
|---|---|---|---|
| A | 6269 | 58 | 0.925187% |
| B | 6268 | 98 | 1.563497% |
| C | 6268 | 85 | 1.356094% |
| D | 6268 | 330 | 5.264837% |
Noise dominated data is calculated using 1-second bins in cleaned event files. If a bin has >2000 counts, and if more than 50% of those come from <1% of pixels, then it is considered to be noise-dominated and hence unusable.
| Quadrant | # 1 sec bins | Bins with >0 counts | Bins with >2000 counts | High rate bins dominated by noise | Noise dominated (total time) | Noise dominated (detector-on time) | Marked lightcurve |
|---|---|---|---|---|---|---|---|
| A | 7454 | 6270 | 3 | 3 | 0.04% | 0.05% | 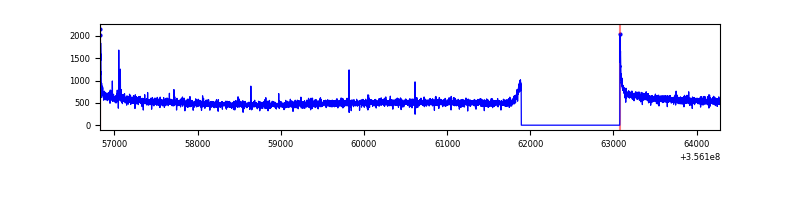 |
| B | 7453 | 6269 | 3 | 3 | 0.04% | 0.05% | 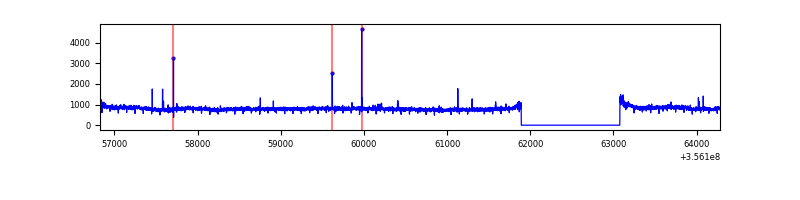 |
| C | 7453 | 6269 | 2 | 2 | 0.03% | 0.03% | 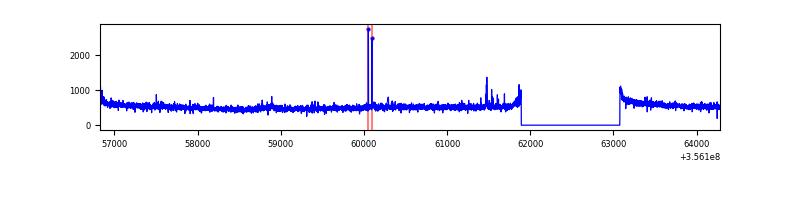 |
| D | 7453 | 6269 | 281 | 281 | 3.77% | 4.48% | 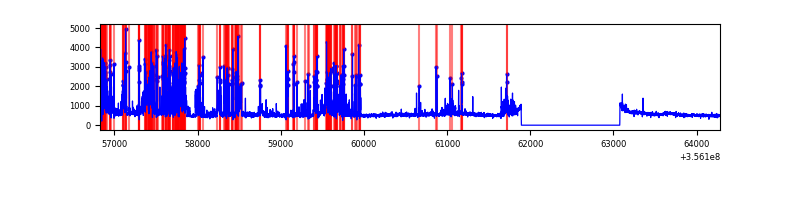 |
Top three noisy pixels from each quadrant. If the there are fewer than three noisy pixels in the level2.evt file, extra rows are filled as -1
| Pixel properties | Quadrant properties | ||||||
|---|---|---|---|---|---|---|---|
| Quadrant | DetID | PixID | Counts | Sigma | Mean | Median | Sigma |
| A | 8 | 192 | 23370 | 134.73 | 847 | 833 | 167.3 |
| A | 12 | 96 | 10612 | 58.46 | 847 | 833 | 167.3 |
| A | 13 | 254 | 10264 | 56.38 | 847 | 833 | 167.3 |
| B | 6 | 159 | 1712743 | 10870.96 | 835 | 815 | 157.5 |
| B | 10 | 247 | 29475 | 181.99 | 835 | 815 | 157.5 |
| B | 12 | 111 | 19335 | 117.6 | 835 | 815 | 157.5 |
| C | 14 | 238 | 134685 | 712.49 | 800 | 807 | 187.9 |
| C | 3 | 233 | 42199 | 220.29 | 800 | 807 | 187.9 |
| C | 2 | 114 | 14973 | 75.39 | 800 | 807 | 187.9 |
| D | 7 | 80 | 1471422 | 7811.87 | 790 | 772 | 188.3 |
| D | 8 | 195 | 153953 | 813.67 | 790 | 772 | 188.3 |
| D | 2 | 250 | 133698 | 706.08 | 790 | 772 | 188.3 |
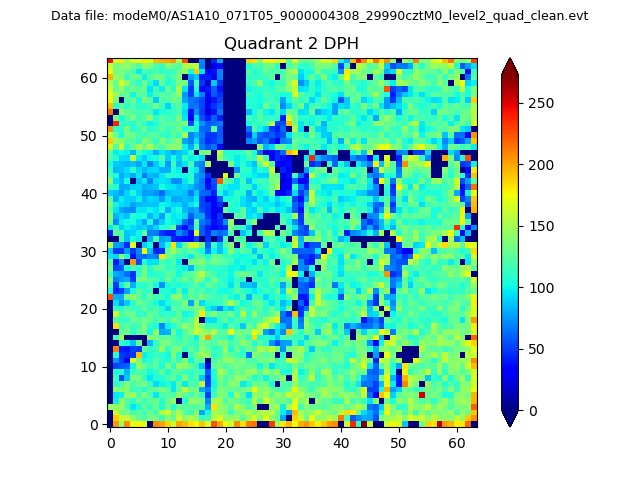
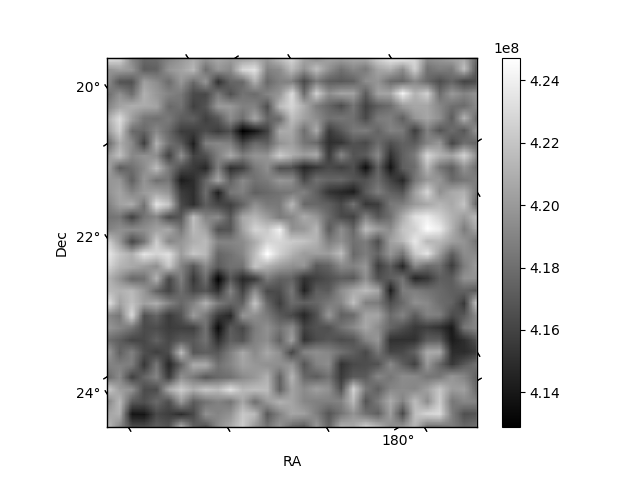
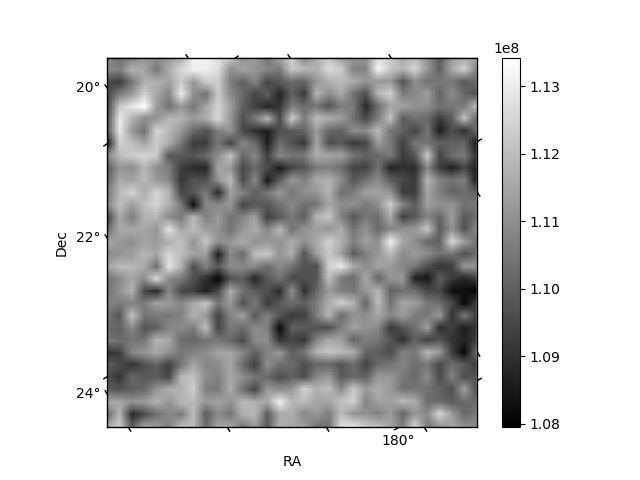
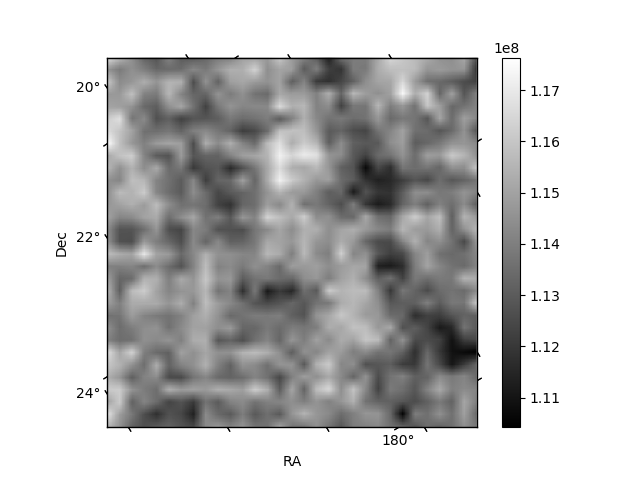
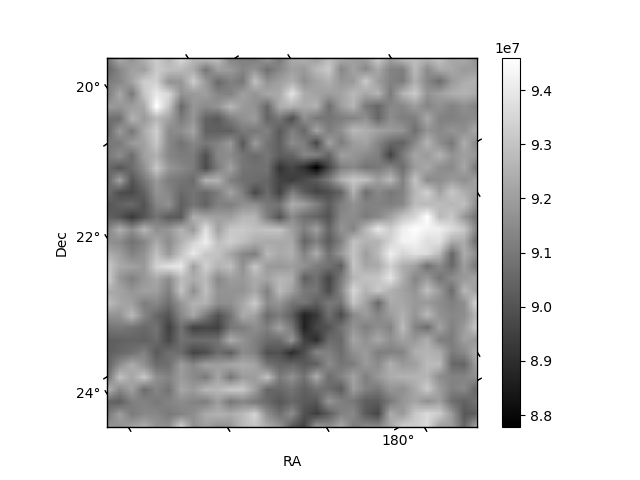
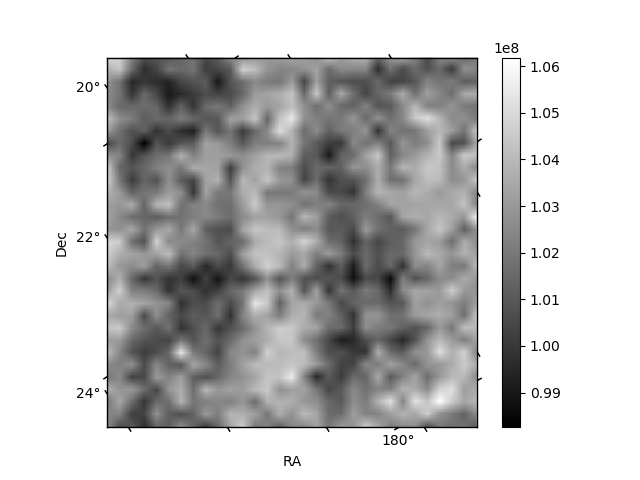
Histogram calculated using DETX and DETY for each event in the final _common_clean file
| Quadrant A | 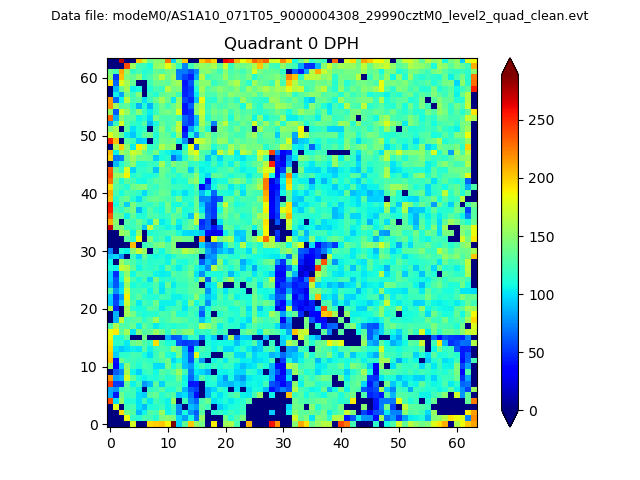 |
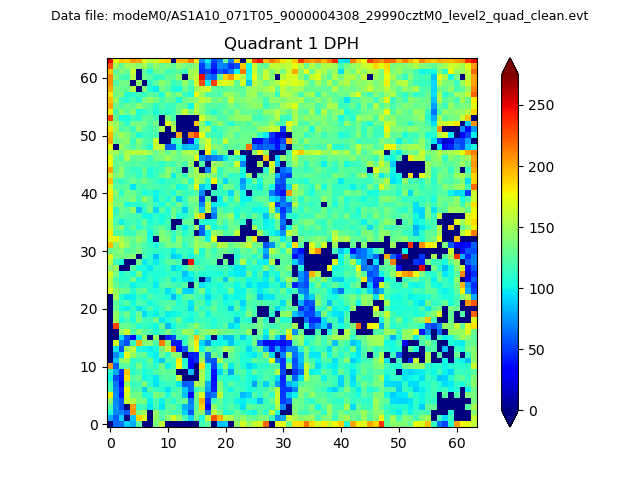 |
Quadrant B |
|---|---|---|---|
| Quadrant D | 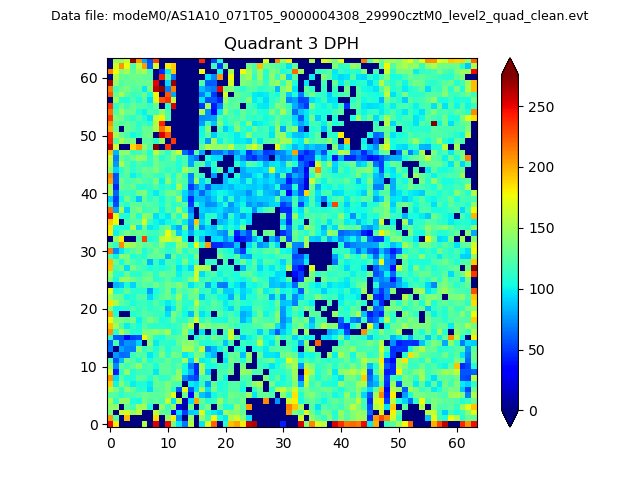 |
 |
Quadrant C |
| Plot type | Count rate plots | Images |
|---|---|---|
| Comparison with Poisson distribution Blue bars denote a histogram of data divided into 1 sec bins. Red curve is a Poisson curve with rate = median count rate of data. |
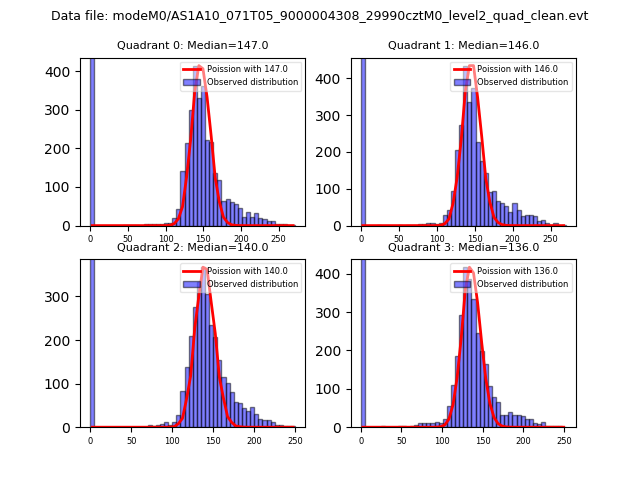 |
 |
| Quadrant-wise count rates Data is divided into 100 sec bins |
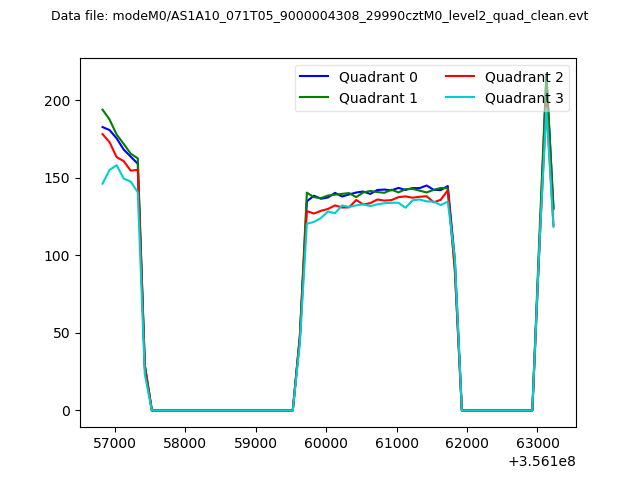 |
|
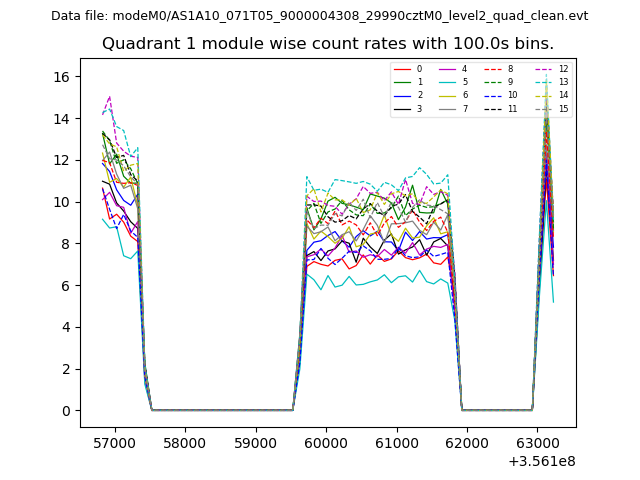
| Module-wise count rates for Quadrant A Data is divided into 100 sec bins |
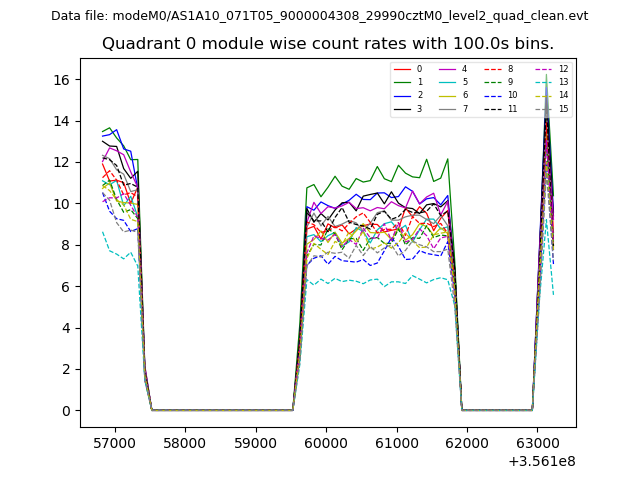 |
 |
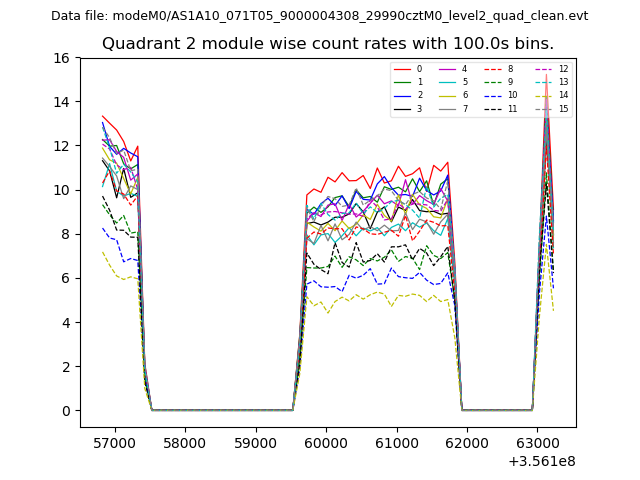
| Module-wise count rates for Quadrant B Data is divided into 100 sec bins |
 |
 |
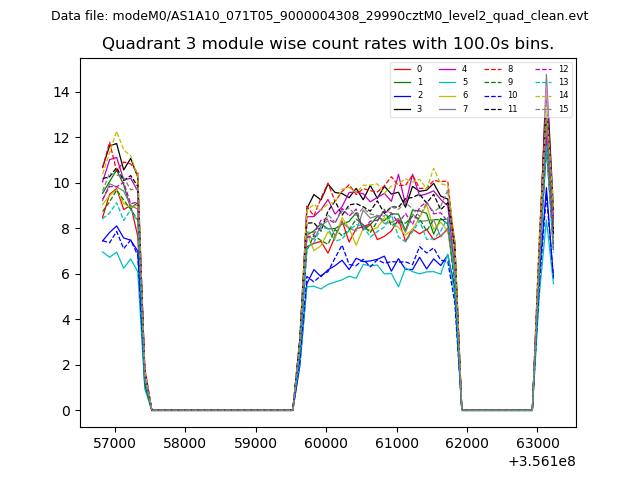
| Module-wise count rates for Quadrant C Data is divided into 100 sec bins |
 |
 |
| Module-wise count rates for Quadrant D Data is divided into 100 sec bins |
 |
 |
| Parameter | Plot |
|---|---|
| CZT HV Monitor | 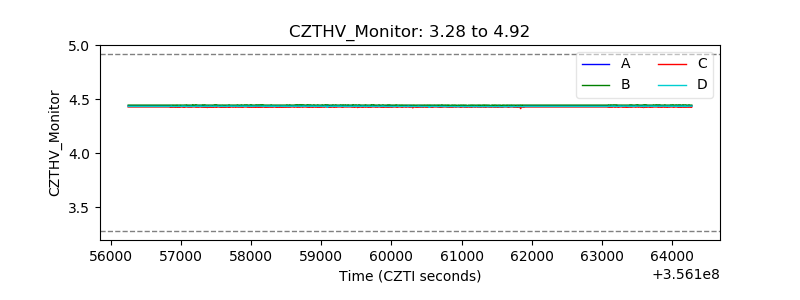 |
| D_VDD | 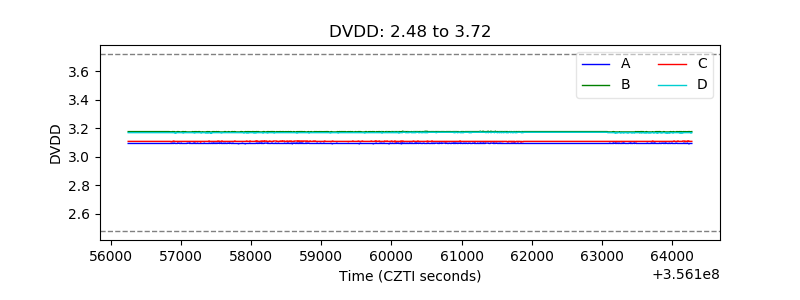 |
| Temperature 1 |  |
| Veto HV Monitor | 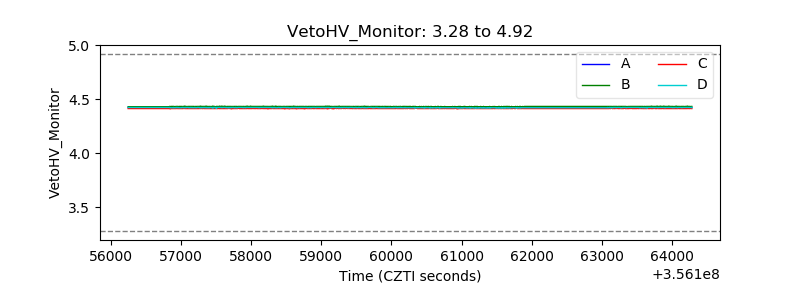 |
| Veto LLD | 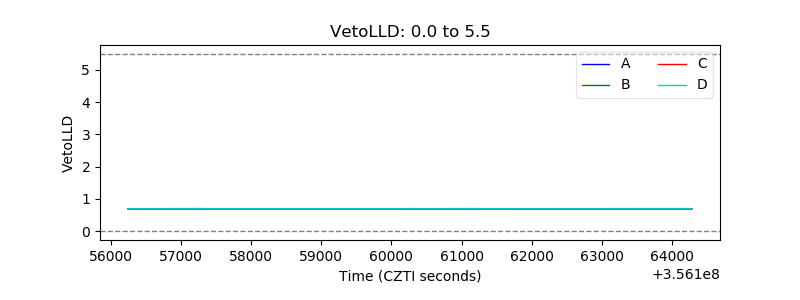 |
| Alpha Counter | 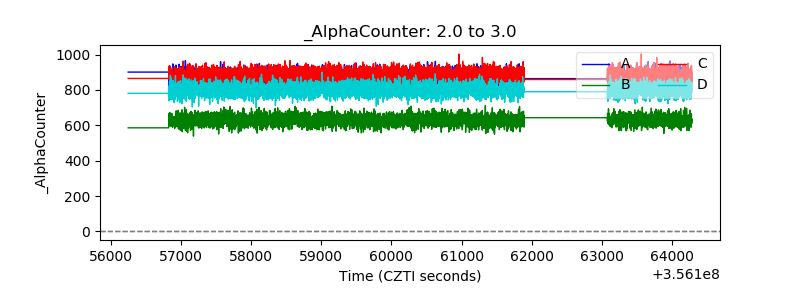 |
| _CPM_Rate | 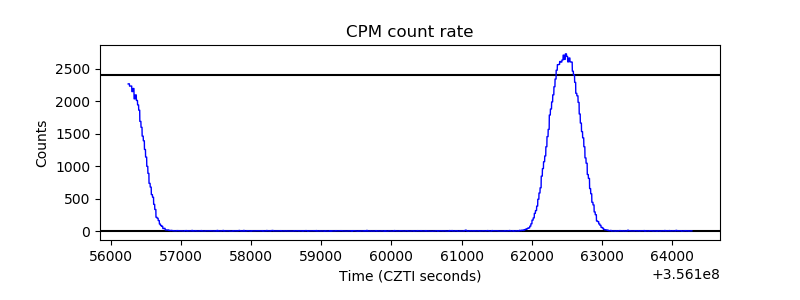 |
| CZT Counter | 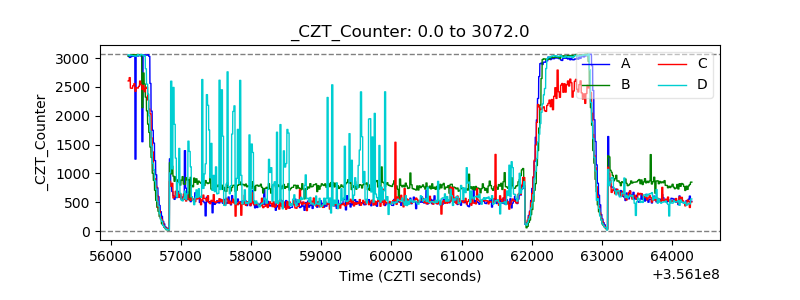 |
| +2.5 Volts monitor |  |
| +5 Volts monitor |  |
| _ROLL_ROT | 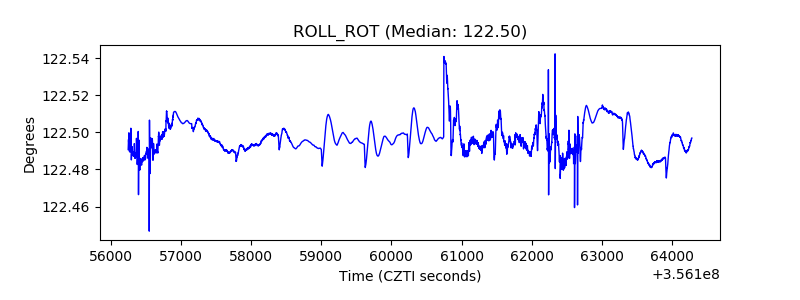 |
| _Roll_DEC | 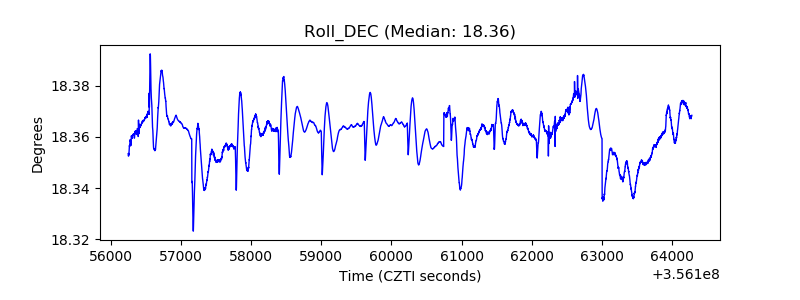 |
| _Roll_RA | 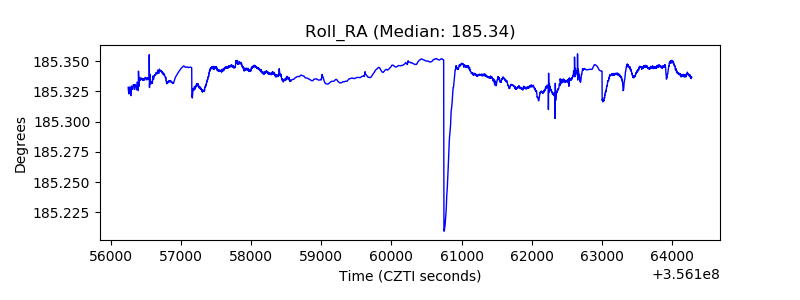 |
| Veto Counter | 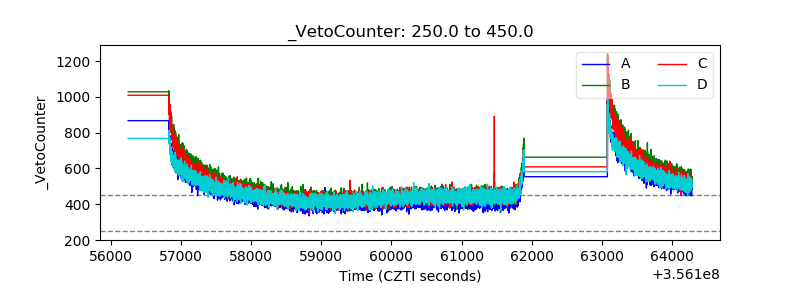 |