| Param | Original file | Final file |
|---|---|---|
| Filename | modeM0/AS1A10_071T05_9000004308_29991cztM0_level2.evt | modeM0/AS1A10_071T05_9000004308_29991cztM0_level2_quad_clean.evt |
| Size (bytes) | 524,845,440 | 67,559,040 |
| Size | 500.5 MB | 64.4 MB |
| Events in quadrant A | 3,491,448 | 415,471 |
| Events in quadrant B | 5,150,613 | 415,460 |
| Events in quadrant C | 3,447,333 | 392,117 |
| Events in quadrant D | 3,383,285 | 387,096 |
| Mode M0 | |||
|---|---|---|---|
| Quadrant | BADHDUFLAG | Total packets | Discarded packets |
| A | 0 | 14122 | 2 |
| B | 0 | 19247 | 2 |
| C | 0 | 13866 | 2 |
| D | 0 | 13703 | 2 |
| Mode SS | |||
|---|---|---|---|
| Quadrant | BADHDUFLAG | Total packets | Discarded packets |
| A | 0 | 126 | 0 |
| B | 0 | 126 | 0 |
| C | 0 | 126 | 0 |
| D | 0 | 126 | 0 |
| Mode M9 | |||
|---|---|---|---|
| Quadrant | BADHDUFLAG | Total packets | Discarded packets |
| A | 0 | 18 | 0 |
| B | 0 | 19 | 0 |
| C | 0 | 19 | 0 |
| D | 0 | 19 | 0 |
| Quadrant | Total seconds | Saturated seconds | Saturation percentage |
|---|---|---|---|
| A | 6240 | 61 | 0.977564% |
| B | 6240 | 116 | 1.858974% |
| C | 6240 | 70 | 1.121795% |
| D | 6240 | 27 | 0.432692% |
Noise dominated data is calculated using 1-second bins in cleaned event files. If a bin has >2000 counts, and if more than 50% of those come from <1% of pixels, then it is considered to be noise-dominated and hence unusable.
| Quadrant | # 1 sec bins | Bins with >0 counts | Bins with >2000 counts | High rate bins dominated by noise | Noise dominated (total time) | Noise dominated (detector-on time) | Marked lightcurve |
|---|---|---|---|---|---|---|---|
| A | 7540 | 6241 | 5 | 5 | 0.07% | 0.08% | 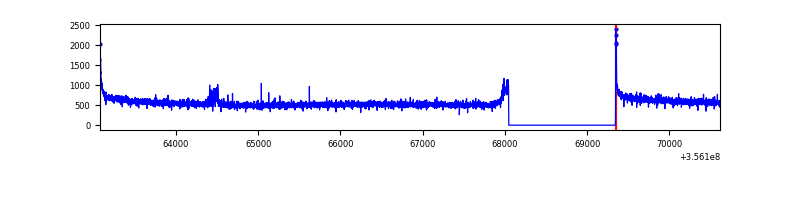 |
| B | 7540 | 6241 | 1 | 1 | 0.01% | 0.02% | 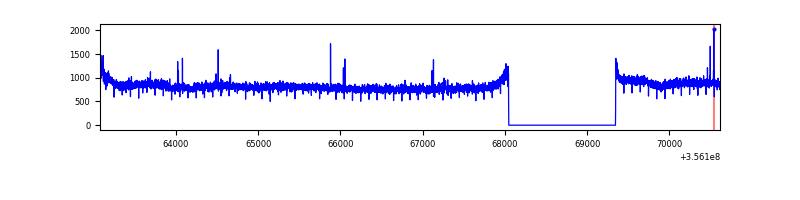 |
| C | 7540 | 6241 | 0 | 0 | 0.00% | 0.00% | 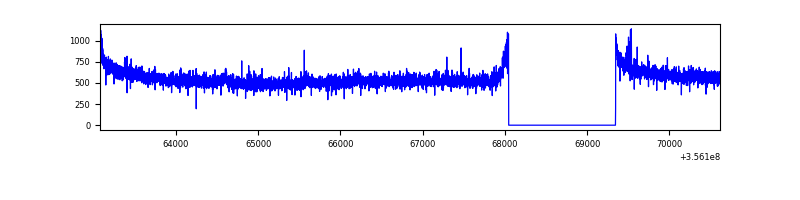 |
| D | 7540 | 6241 | 6 | 6 | 0.08% | 0.10% | 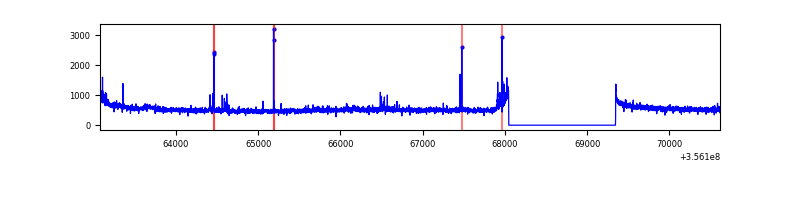 |
Top three noisy pixels from each quadrant. If the there are fewer than three noisy pixels in the level2.evt file, extra rows are filled as -1
| Pixel properties | Quadrant properties | ||||||
|---|---|---|---|---|---|---|---|
| Quadrant | DetID | PixID | Counts | Sigma | Mean | Median | Sigma |
| A | 3 | 1 | 27261 | 148.61 | 893 | 880 | 177.5 |
| A | 8 | 192 | 22918 | 124.15 | 893 | 880 | 177.5 |
| A | 13 | 254 | 10620 | 54.87 | 893 | 880 | 177.5 |
| B | 6 | 159 | 1687510 | 10287.33 | 878 | 861 | 164.0 |
| B | 12 | 111 | 19938 | 116.36 | 878 | 861 | 164.0 |
| B | 11 | 111 | 18289 | 106.3 | 878 | 861 | 164.0 |
| C | 14 | 238 | 139647 | 724.5 | 834 | 841 | 191.6 |
| C | 3 | 233 | 37207 | 189.81 | 834 | 841 | 191.6 |
| C | 2 | 114 | 14596 | 71.79 | 834 | 841 | 191.6 |
| D | 8 | 195 | 97811 | 491.51 | 843 | 825 | 197.3 |
| D | 7 | 80 | 65886 | 329.72 | 843 | 825 | 197.3 |
| D | 2 | 234 | 20756 | 101.01 | 843 | 825 | 197.3 |
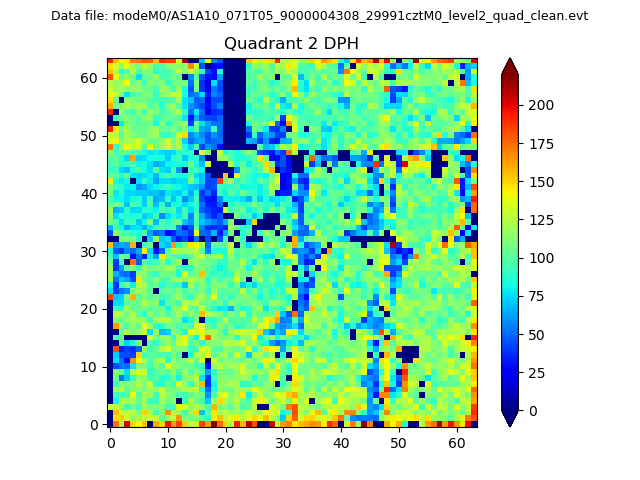
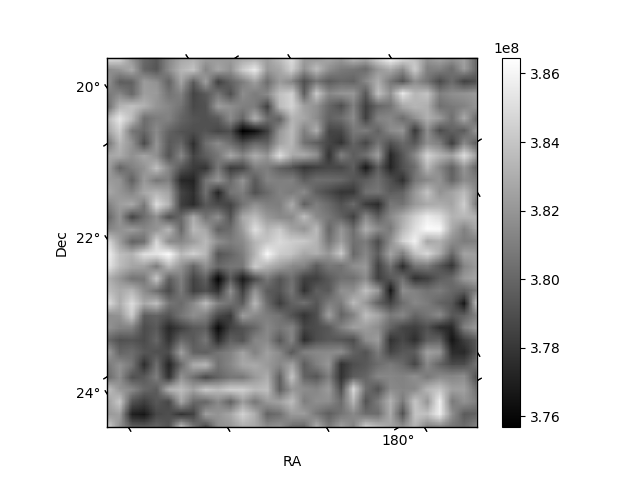
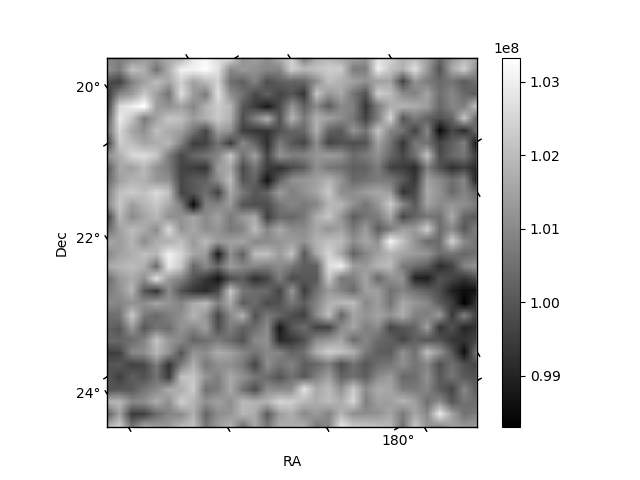
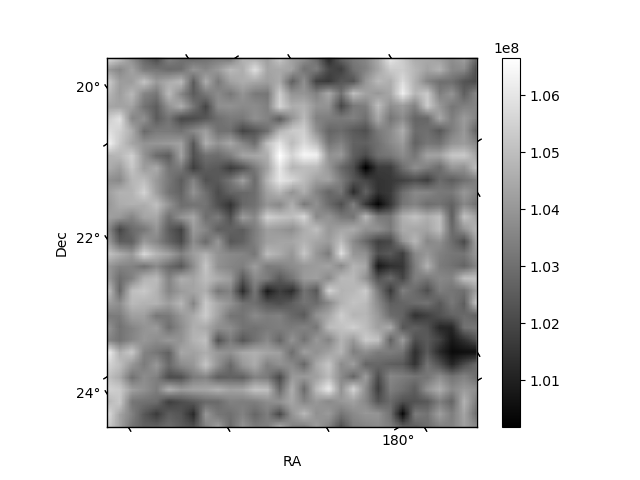
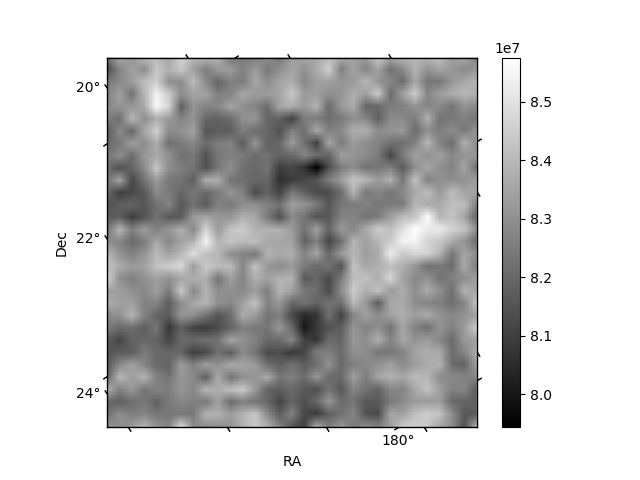
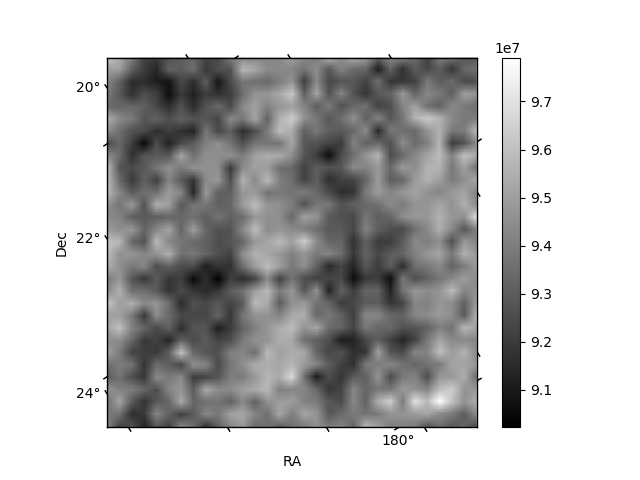
Histogram calculated using DETX and DETY for each event in the final _common_clean file
| Quadrant A | 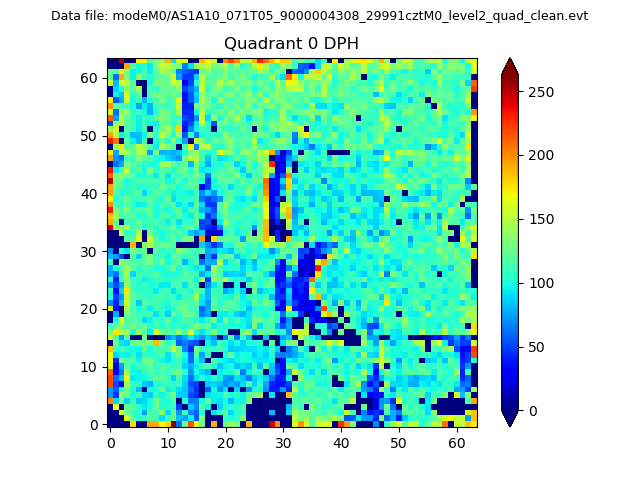 |
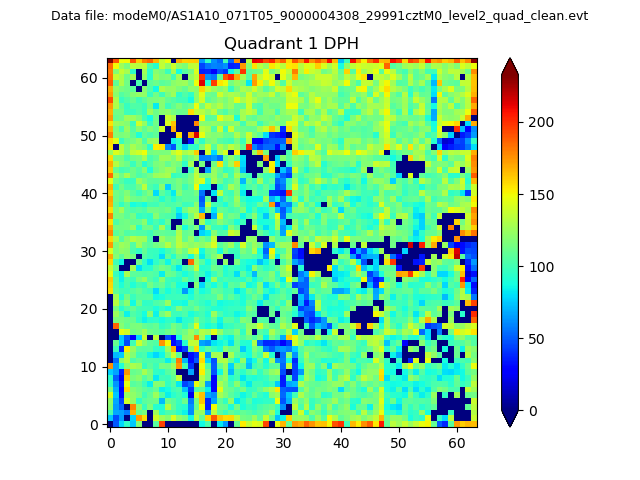 |
Quadrant B |
|---|---|---|---|
| Quadrant D | 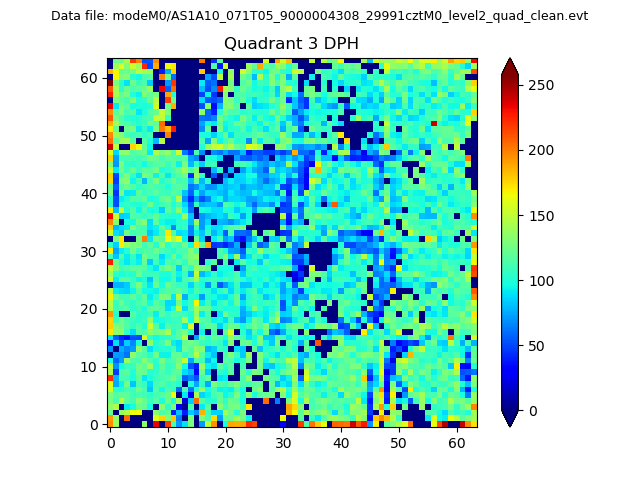 |
 |
Quadrant C |
| Plot type | Count rate plots | Images |
|---|---|---|
| Comparison with Poisson distribution Blue bars denote a histogram of data divided into 1 sec bins. Red curve is a Poisson curve with rate = median count rate of data. |
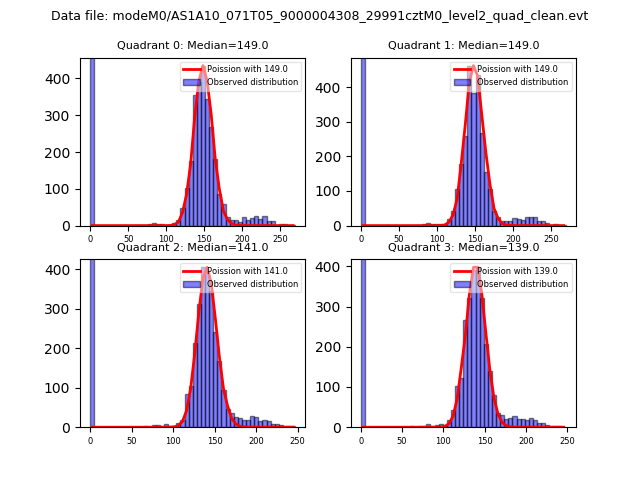 |
 |
| Quadrant-wise count rates Data is divided into 100 sec bins |
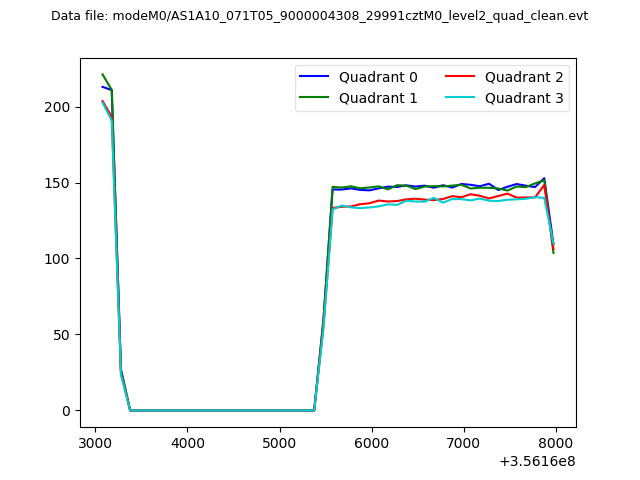 |
|
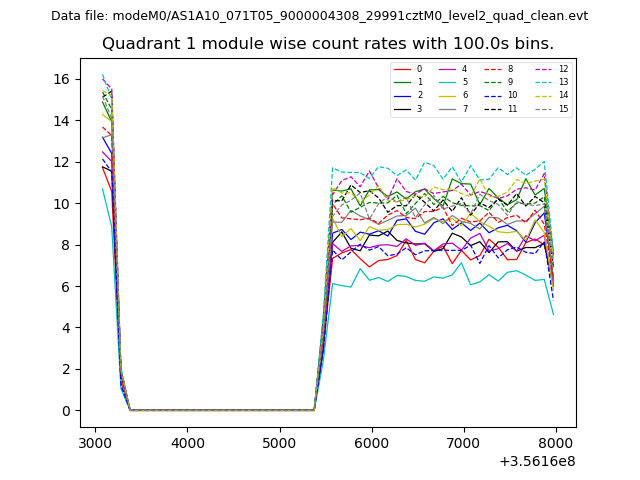
| Module-wise count rates for Quadrant A Data is divided into 100 sec bins |
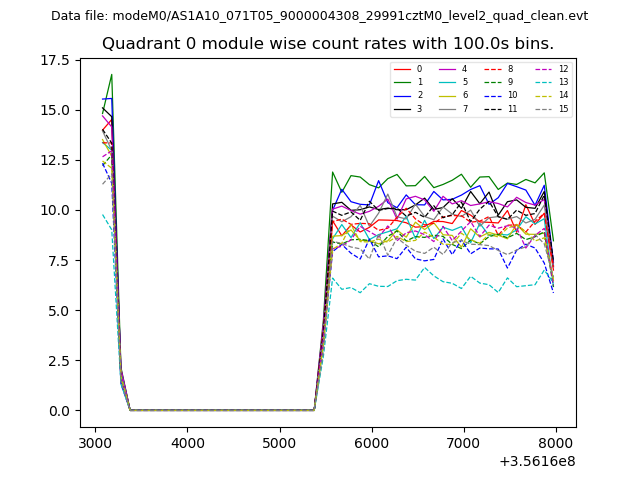 |
 |
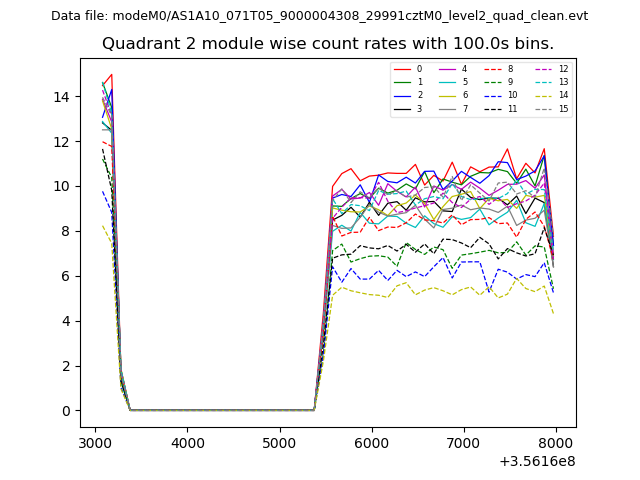
| Module-wise count rates for Quadrant B Data is divided into 100 sec bins |
 |
 |
| Module-wise count rates for Quadrant C Data is divided into 100 sec bins |
 |
 |
| Module-wise count rates for Quadrant D Data is divided into 100 sec bins |
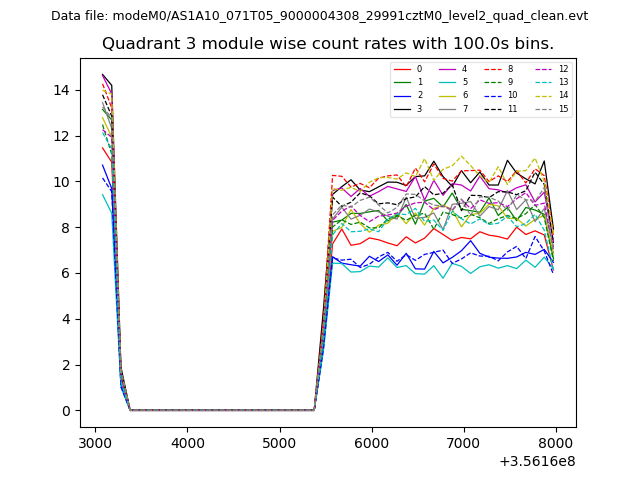 |
 |
| Parameter | Plot |
|---|---|
| CZT HV Monitor | 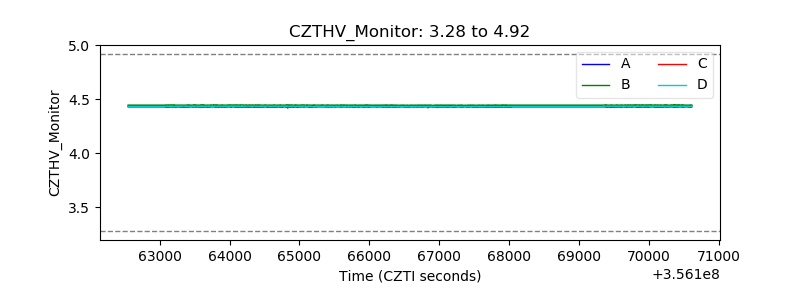 |
| D_VDD | 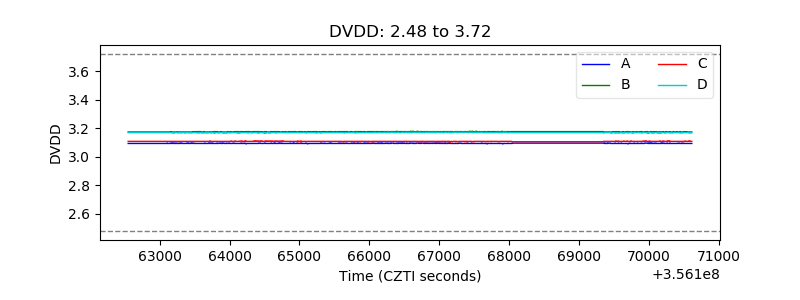 |
| Temperature 1 |  |
| Veto HV Monitor | 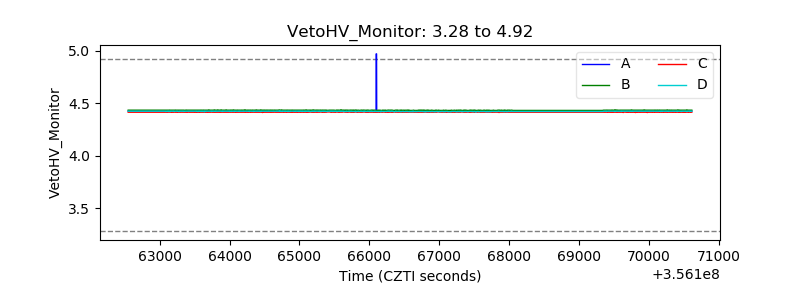 |
| Veto LLD | 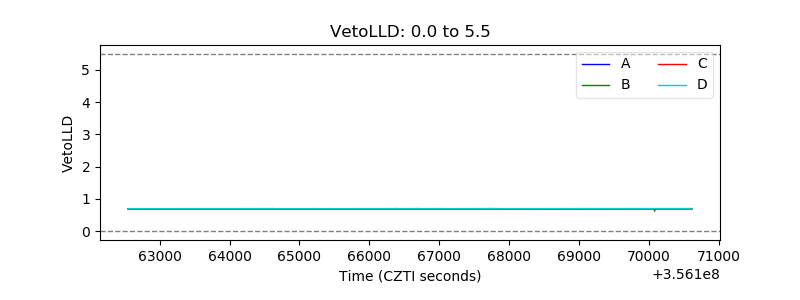 |
| Alpha Counter | 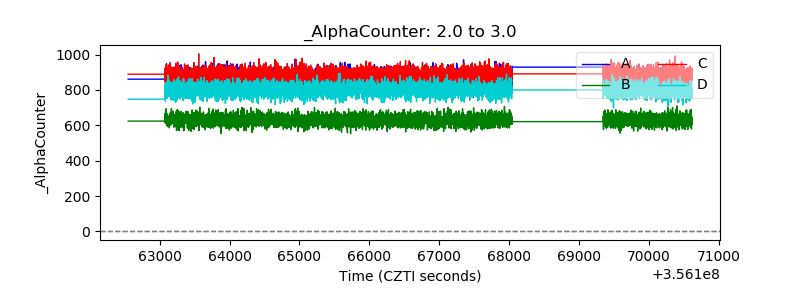 |
| _CPM_Rate | 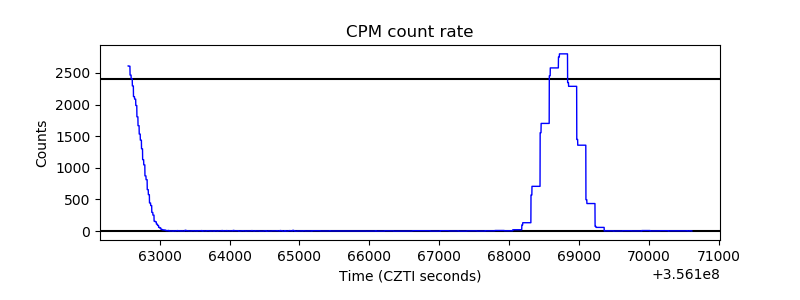 |
| CZT Counter | 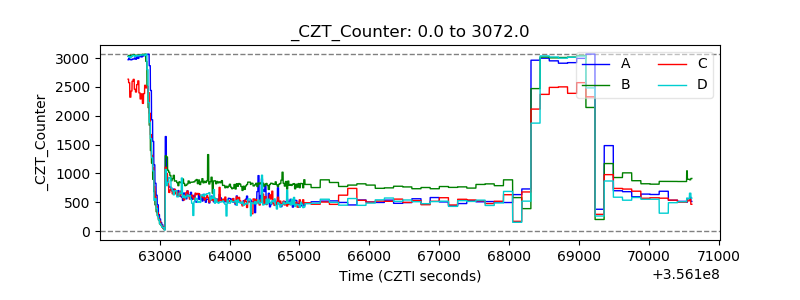 |
| +2.5 Volts monitor |  |
| +5 Volts monitor |  |
| _ROLL_ROT | 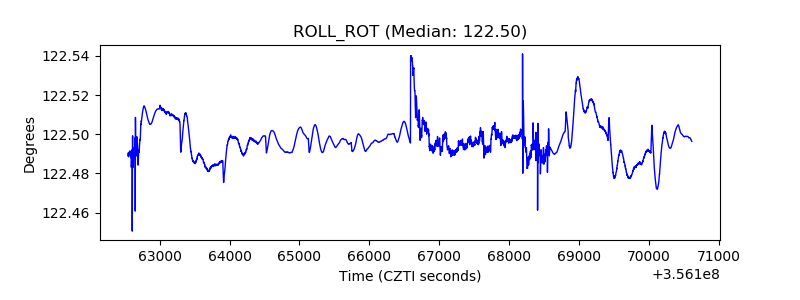 |
| _Roll_DEC | 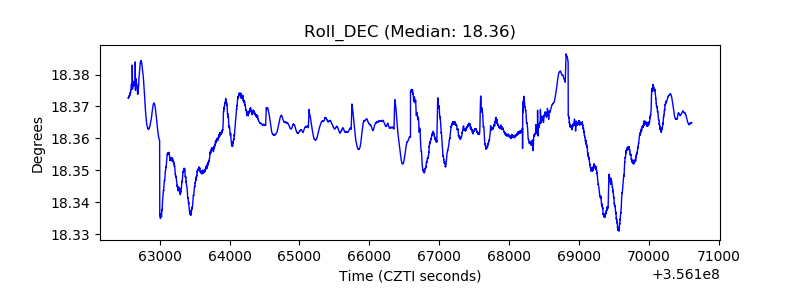 |
| _Roll_RA | 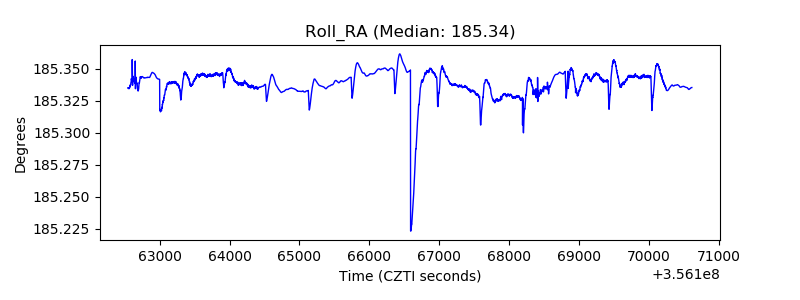 |
| Veto Counter | 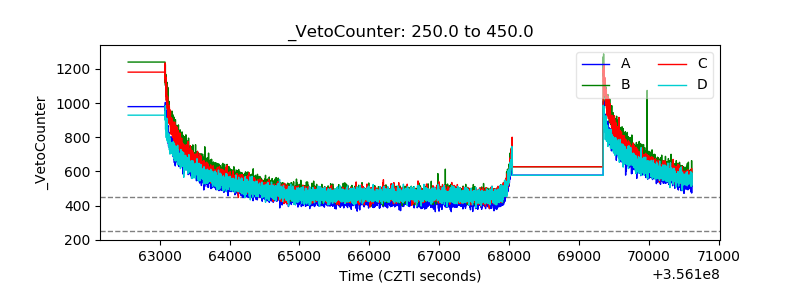 |