| Param | Original file | Final file |
|---|---|---|
| Filename | modeM0/AS1A10_071T05_9000004308_29992cztM0_level2.evt | modeM0/AS1A10_071T05_9000004308_29992cztM0_level2_quad_clean.evt |
| Size (bytes) | 540,636,480 | 70,747,200 |
| Size | 515.6 MB | 67.5 MB |
| Events in quadrant A | 3,534,930 | 442,895 |
| Events in quadrant B | 5,180,210 | 439,445 |
| Events in quadrant C | 3,496,830 | 415,322 |
| Events in quadrant D | 3,742,890 | 412,954 |
| Mode M0 | |||
|---|---|---|---|
| Quadrant | BADHDUFLAG | Total packets | Discarded packets |
| A | 0 | 14309 | 2 |
| B | 0 | 19278 | 2 |
| C | 0 | 14068 | 2 |
| D | 0 | 14813 | 2 |
| Mode SS | |||
|---|---|---|---|
| Quadrant | BADHDUFLAG | Total packets | Discarded packets |
| A | 0 | 128 | 0 |
| B | 0 | 128 | 0 |
| C | 0 | 128 | 0 |
| D | 0 | 128 | 0 |
| Mode M9 | |||
|---|---|---|---|
| Quadrant | BADHDUFLAG | Total packets | Discarded packets |
| A | 0 | 16 | 0 |
| B | 0 | 17 | 0 |
| C | 0 | 17 | 0 |
| D | 0 | 17 | 0 |
| Quadrant | Total seconds | Saturated seconds | Saturation percentage |
|---|---|---|---|
| A | 6173 | 86 | 1.393164% |
| B | 6173 | 146 | 2.365139% |
| C | 6173 | 116 | 1.879151% |
| D | 6172 | 90 | 1.458198% |
Noise dominated data is calculated using 1-second bins in cleaned event files. If a bin has >2000 counts, and if more than 50% of those come from <1% of pixels, then it is considered to be noise-dominated and hence unusable.
| Quadrant | # 1 sec bins | Bins with >0 counts | Bins with >2000 counts | High rate bins dominated by noise | Noise dominated (total time) | Noise dominated (detector-on time) | Marked lightcurve |
|---|---|---|---|---|---|---|---|
| A | 7518 | 6174 | 7 | 7 | 0.09% | 0.11% | 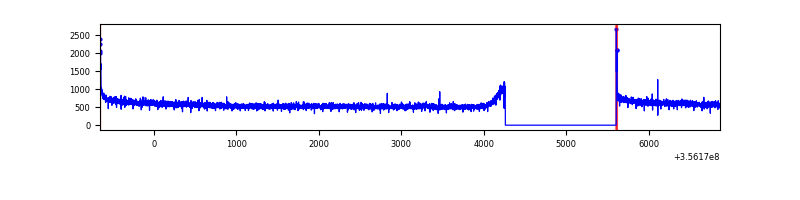 |
| B | 7518 | 6174 | 1 | 1 | 0.01% | 0.02% | 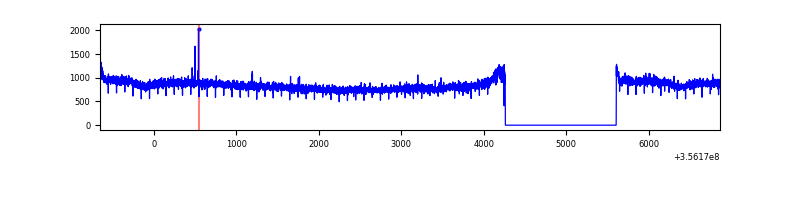 |
| C | 7518 | 6174 | 0 | 0 | 0.00% | 0.00% | 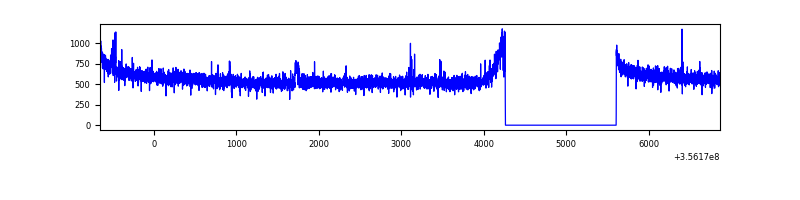 |
| D | 7517 | 6173 | 45 | 45 | 0.60% | 0.73% | 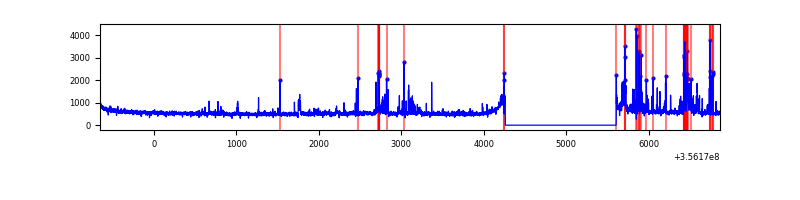 |
Top three noisy pixels from each quadrant. If the there are fewer than three noisy pixels in the level2.evt file, extra rows are filled as -1
| Pixel properties | Quadrant properties | ||||||
|---|---|---|---|---|---|---|---|
| Quadrant | DetID | PixID | Counts | Sigma | Mean | Median | Sigma |
| A | 8 | 192 | 25063 | 135.21 | 909 | 898 | 178.7 |
| A | 13 | 254 | 11523 | 59.45 | 909 | 898 | 178.7 |
| A | 3 | 137 | 8171 | 40.7 | 909 | 898 | 178.7 |
| B | 6 | 159 | 1683523 | 10226.89 | 890 | 871 | 164.5 |
| B | 12 | 111 | 20250 | 117.78 | 890 | 871 | 164.5 |
| B | 11 | 111 | 18208 | 105.37 | 890 | 871 | 164.5 |
| C | 14 | 238 | 144058 | 738.33 | 846 | 857 | 194.0 |
| C | 3 | 233 | 30473 | 152.7 | 846 | 857 | 194.0 |
| C | 2 | 114 | 14516 | 70.42 | 846 | 857 | 194.0 |
| D | 7 | 80 | 389888 | 1775.94 | 849 | 836 | 219.1 |
| D | 13 | 138 | 60228 | 271.11 | 849 | 836 | 219.1 |
| D | 8 | 195 | 39516 | 176.57 | 849 | 836 | 219.1 |
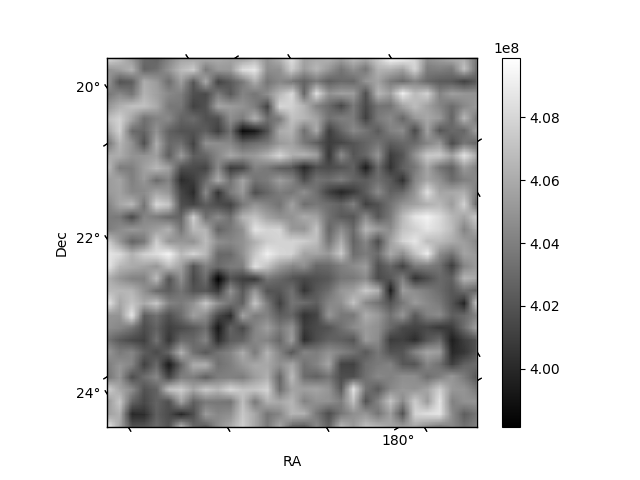
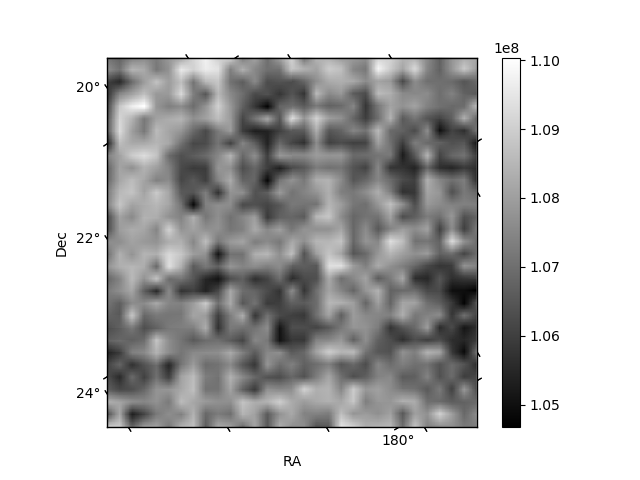
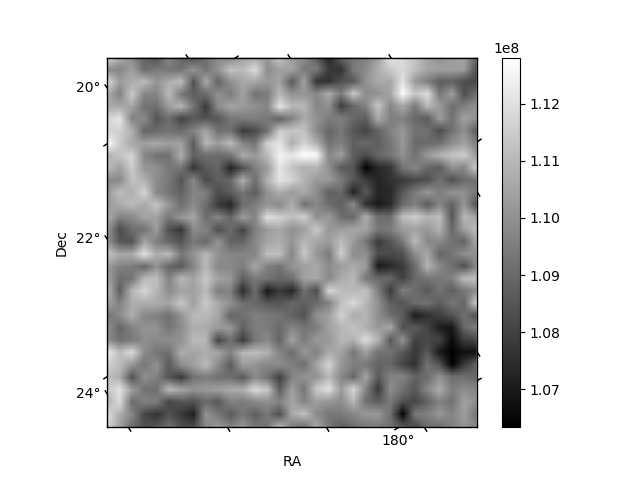
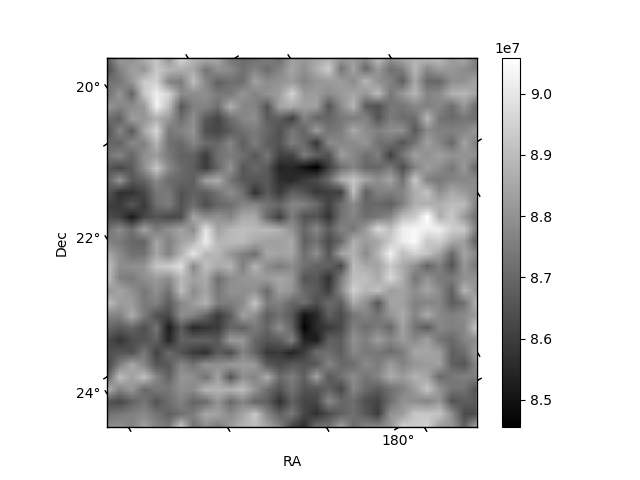
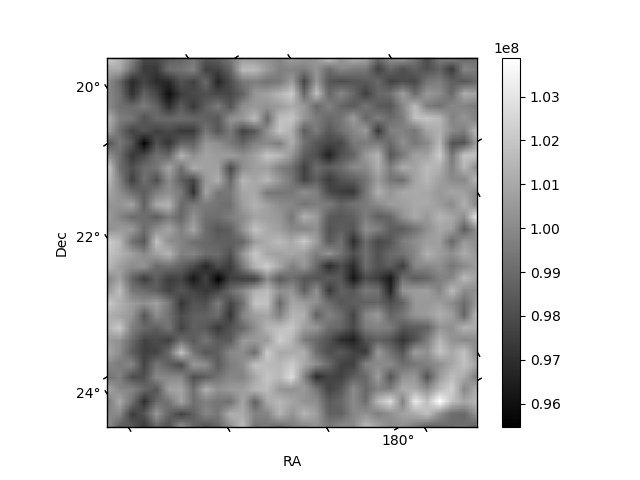
Histogram calculated using DETX and DETY for each event in the final _common_clean file
| Quadrant A | 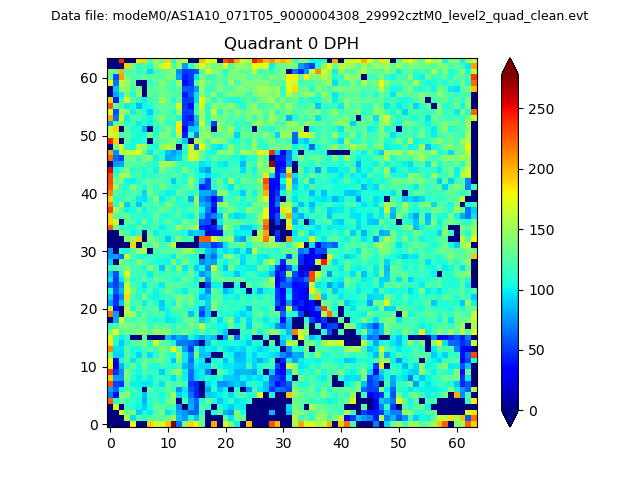 |
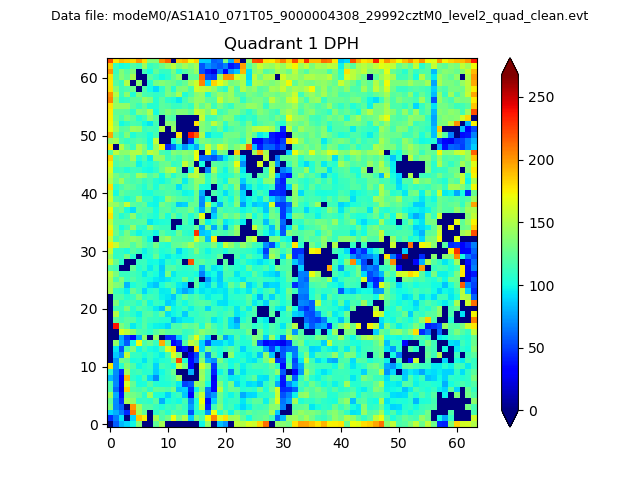 |
Quadrant B |
|---|---|---|---|
| Quadrant D |  |
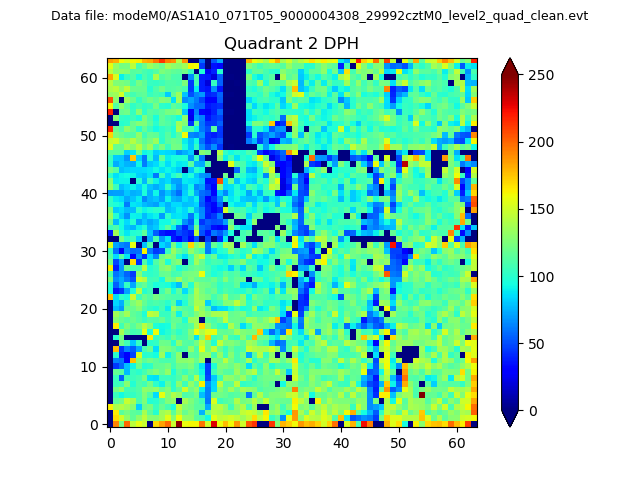 |
Quadrant C |
| Plot type | Count rate plots | Images |
|---|---|---|
| Comparison with Poisson distribution Blue bars denote a histogram of data divided into 1 sec bins. Red curve is a Poisson curve with rate = median count rate of data. |
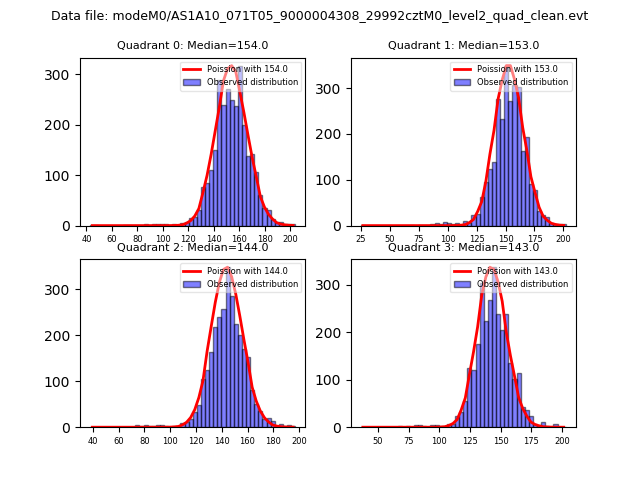 |
 |
| Quadrant-wise count rates Data is divided into 100 sec bins |
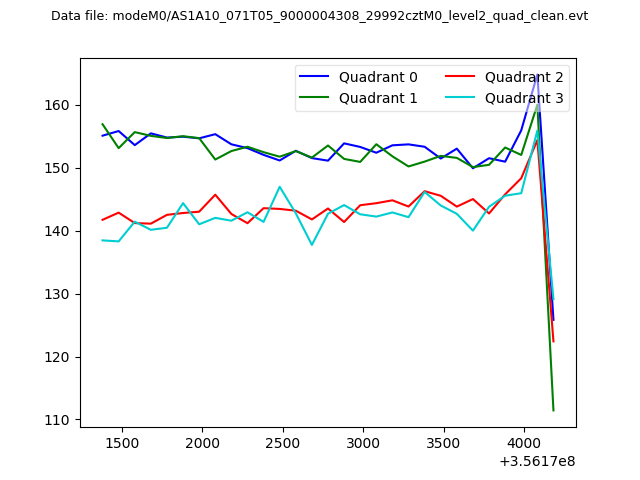 |
|
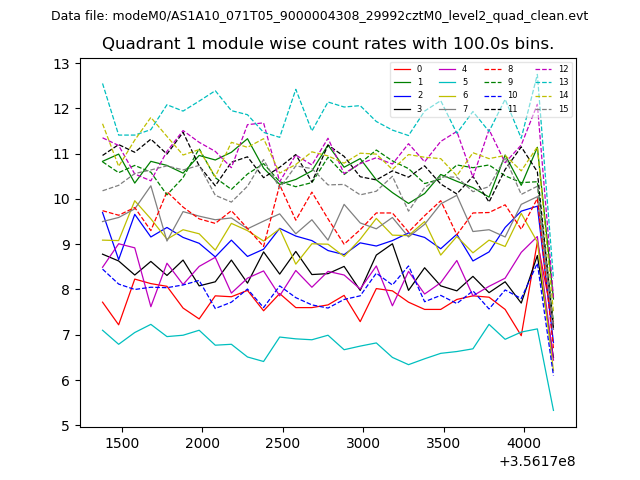
| Module-wise count rates for Quadrant A Data is divided into 100 sec bins |
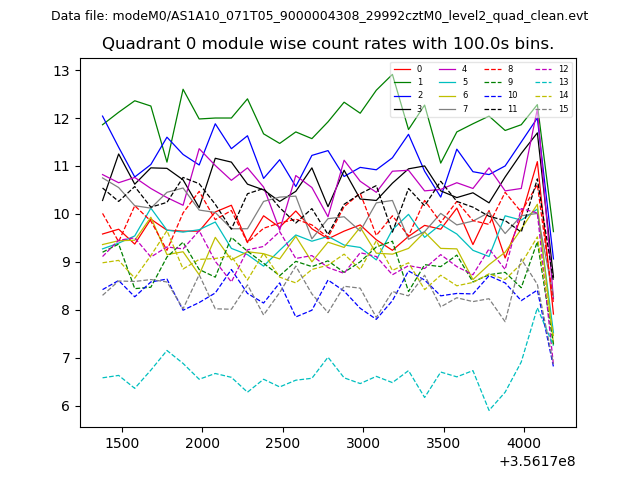 |
 |
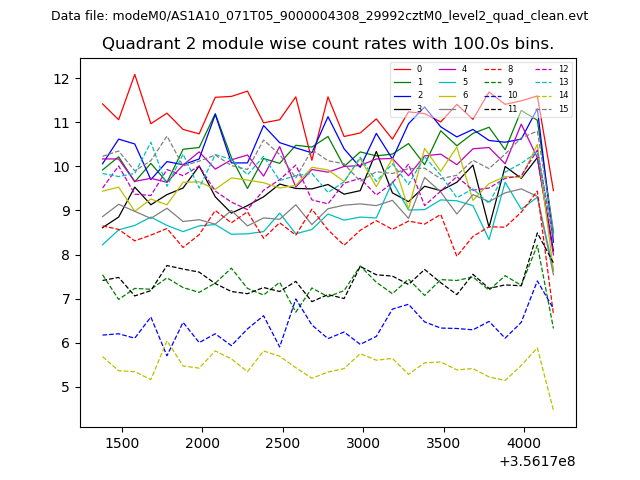
| Module-wise count rates for Quadrant B Data is divided into 100 sec bins |
 |
 |
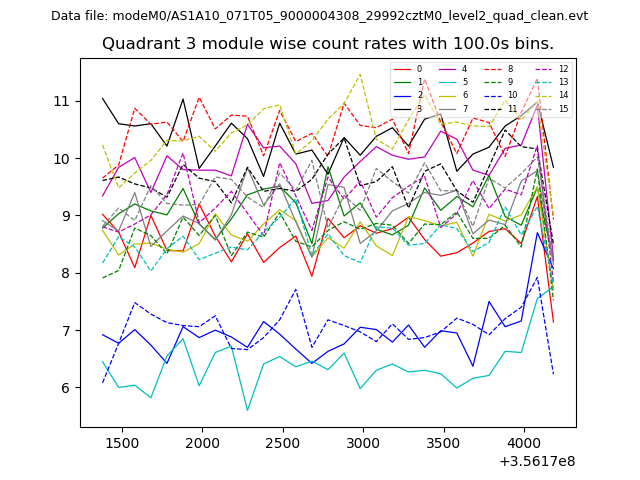
| Module-wise count rates for Quadrant C Data is divided into 100 sec bins |
 |
 |
| Module-wise count rates for Quadrant D Data is divided into 100 sec bins |
 |
 |
| Parameter | Plot |
|---|---|
| CZT HV Monitor | 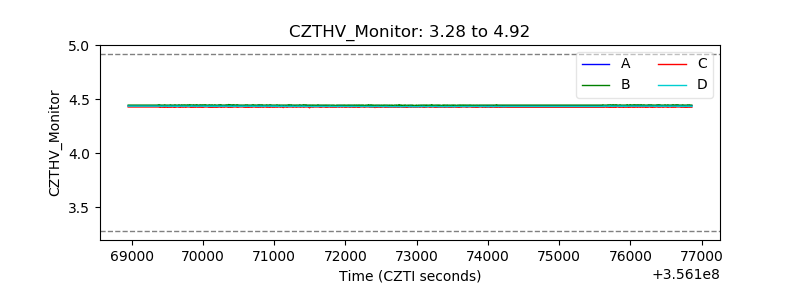 |
| D_VDD | 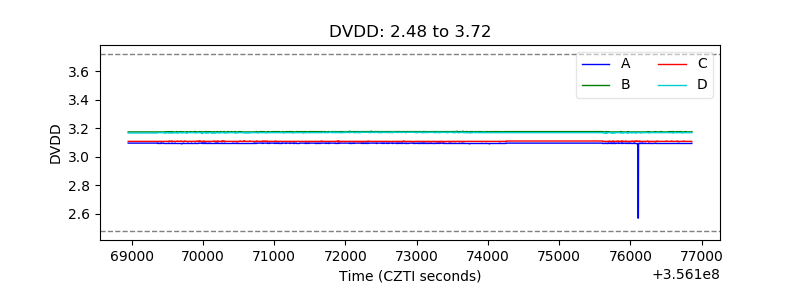 |
| Temperature 1 | 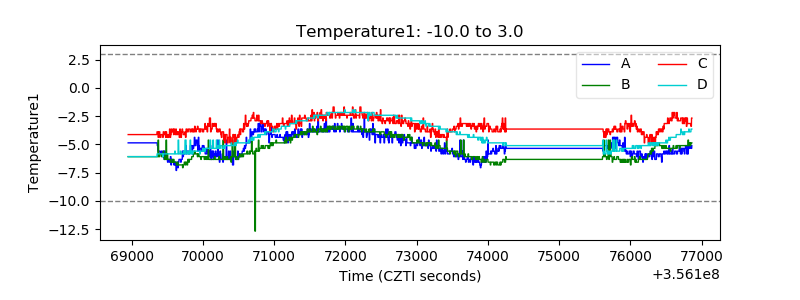 |
| Veto HV Monitor | 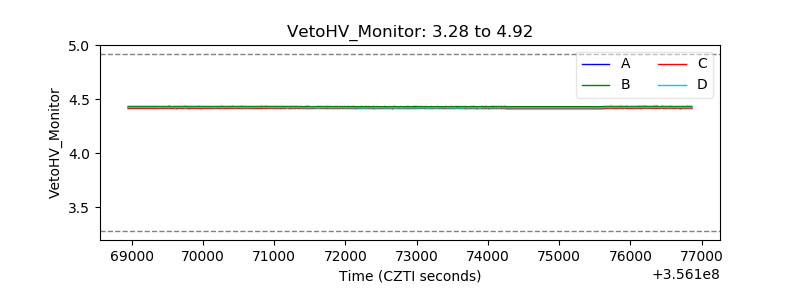 |
| Veto LLD | 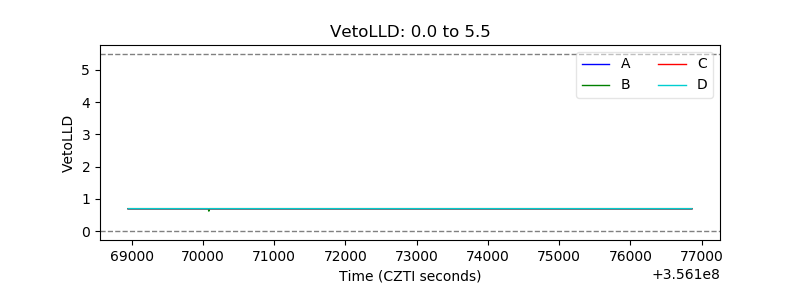 |
| Alpha Counter | 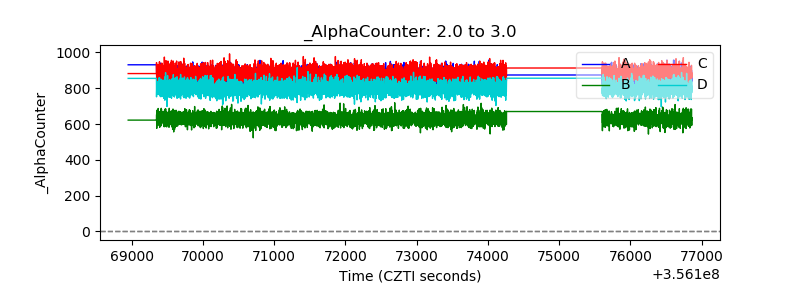 |
| _CPM_Rate | 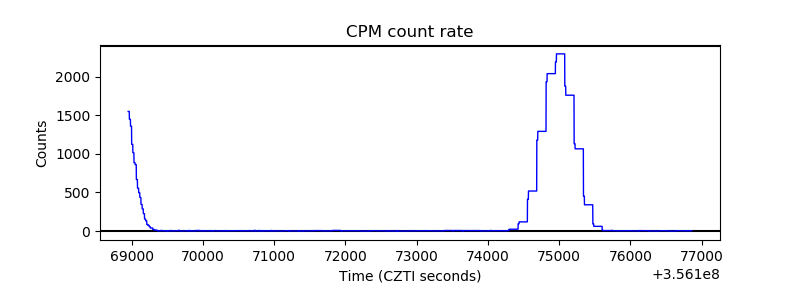 |
| CZT Counter | 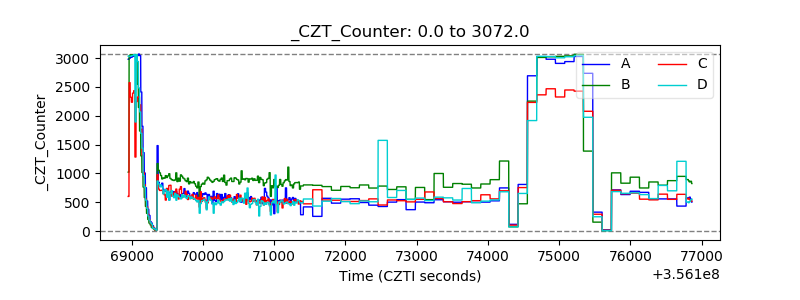 |
| +2.5 Volts monitor |  |
| +5 Volts monitor |  |
| _ROLL_ROT | 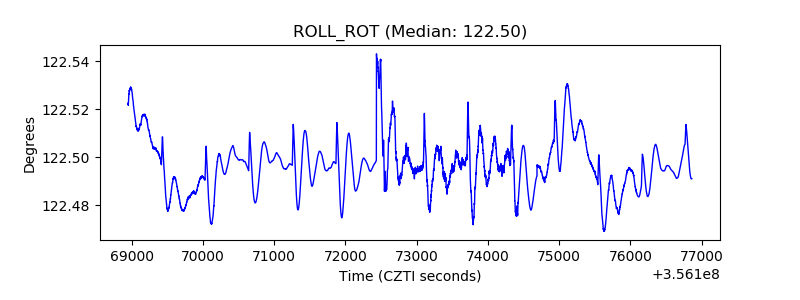 |
| _Roll_DEC | 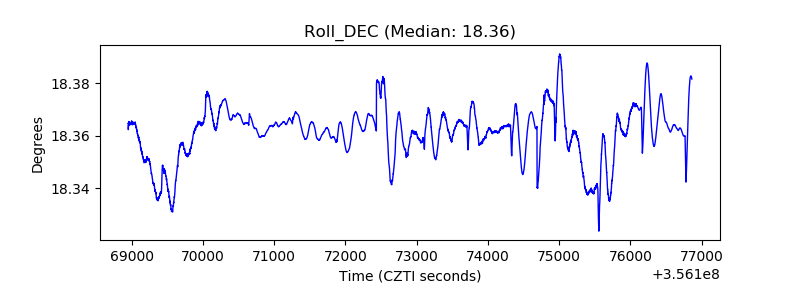 |
| _Roll_RA | 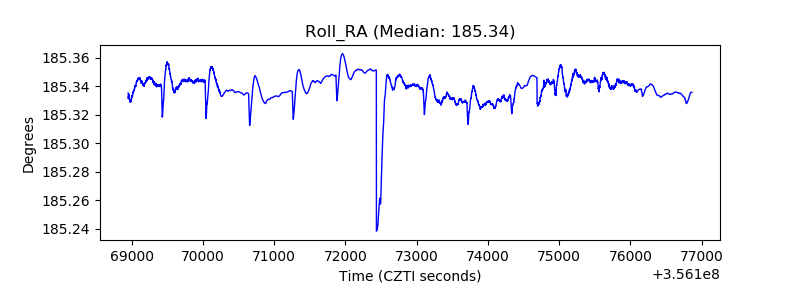 |
| Veto Counter | 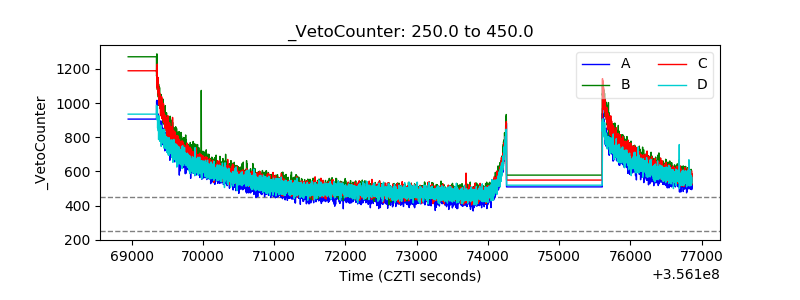 |