| Param | Original file | Final file |
|---|---|---|
| Filename | modeM0/AS1A10_071T05_9000004308_29993cztM0_level2.evt | modeM0/AS1A10_071T05_9000004308_29993cztM0_level2_quad_clean.evt |
| Size (bytes) | 610,744,320 | 92,410,560 |
| Size | 582.5 MB | 88.1 MB |
| Events in quadrant A | 3,875,961 | 603,495 |
| Events in quadrant B | 5,692,267 | 595,755 |
| Events in quadrant C | 3,815,798 | 568,977 |
| Events in quadrant D | 4,654,484 | 558,002 |
| Mode M0 | |||
|---|---|---|---|
| Quadrant | BADHDUFLAG | Total packets | Discarded packets |
| A | 0 | 15667 | 2 |
| B | 0 | 21202 | 2 |
| C | 0 | 15316 | 2 |
| D | 0 | 18023 | 2 |
| Mode SS | |||
|---|---|---|---|
| Quadrant | BADHDUFLAG | Total packets | Discarded packets |
| A | 0 | 142 | 0 |
| B | 0 | 142 | 0 |
| C | 0 | 142 | 0 |
| D | 0 | 142 | 0 |
| Mode M9 | |||
|---|---|---|---|
| Quadrant | BADHDUFLAG | Total packets | Discarded packets |
| A | 0 | 25 | 0 |
| B | 0 | 25 | 0 |
| C | 0 | 25 | 0 |
| D | 0 | 25 | 0 |
| Quadrant | Total seconds | Saturated seconds | Saturation percentage |
|---|---|---|---|
| A | 6761 | 180 | 2.662328% |
| B | 6762 | 287 | 4.244306% |
| C | 6762 | 212 | 3.135167% |
| D | 6762 | 263 | 3.889382% |
Noise dominated data is calculated using 1-second bins in cleaned event files. If a bin has >2000 counts, and if more than 50% of those come from <1% of pixels, then it is considered to be noise-dominated and hence unusable.
| Quadrant | # 1 sec bins | Bins with >0 counts | Bins with >2000 counts | High rate bins dominated by noise | Noise dominated (total time) | Noise dominated (detector-on time) | Marked lightcurve |
|---|---|---|---|---|---|---|---|
| A | 9391 | 6763 | 3 | 3 | 0.03% | 0.04% | 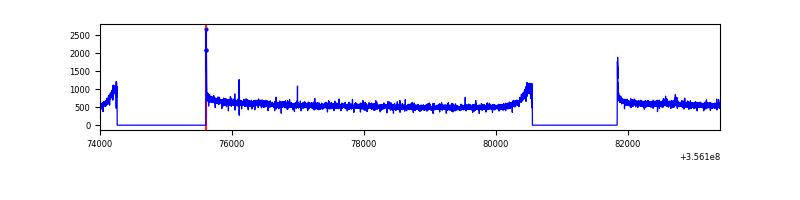 |
| B | 9392 | 6763 | 1 | 1 | 0.01% | 0.01% |  |
| C | 9392 | 6764 | 0 | 0 | 0.00% | 0.00% | 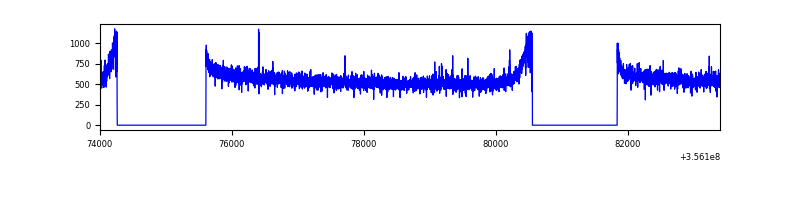 |
| D | 9392 | 6763 | 134 | 134 | 1.43% | 1.98% | 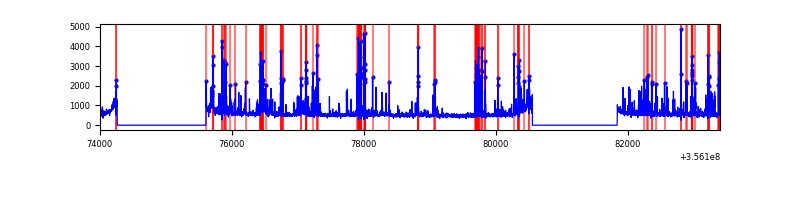 |
Top three noisy pixels from each quadrant. If the there are fewer than three noisy pixels in the level2.evt file, extra rows are filled as -1
| Pixel properties | Quadrant properties | ||||||
|---|---|---|---|---|---|---|---|
| Quadrant | DetID | PixID | Counts | Sigma | Mean | Median | Sigma |
| A | 8 | 192 | 24012 | 117.18 | 995 | 979 | 196.6 |
| A | 3 | 1 | 20599 | 99.82 | 995 | 979 | 196.6 |
| A | 13 | 254 | 11262 | 52.32 | 995 | 979 | 196.6 |
| B | 6 | 159 | 1869974 | 10238.74 | 968 | 946 | 182.5 |
| B | 12 | 111 | 22414 | 117.6 | 968 | 946 | 182.5 |
| B | 11 | 111 | 20463 | 106.92 | 968 | 946 | 182.5 |
| C | 14 | 238 | 155795 | 712.83 | 931 | 940 | 217.2 |
| C | 2 | 114 | 15836 | 68.57 | 931 | 940 | 217.2 |
| C | 3 | 233 | 9357 | 38.75 | 931 | 940 | 217.2 |
| D | 7 | 80 | 993679 | 4109.39 | 933 | 916 | 241.6 |
| D | 13 | 138 | 60515 | 246.7 | 933 | 916 | 241.6 |
| D | 8 | 195 | 44096 | 178.74 | 933 | 916 | 241.6 |
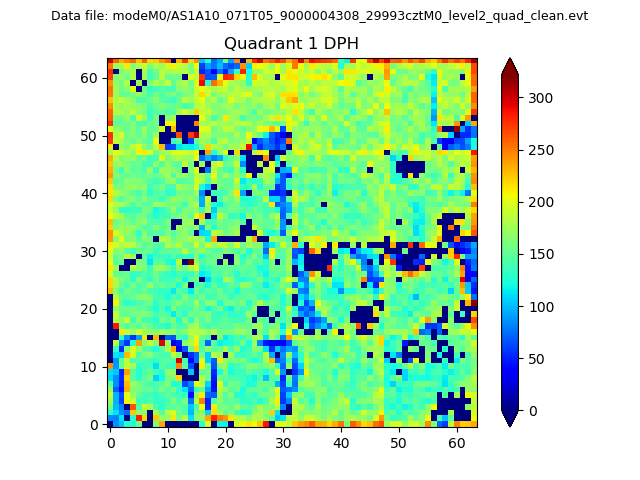
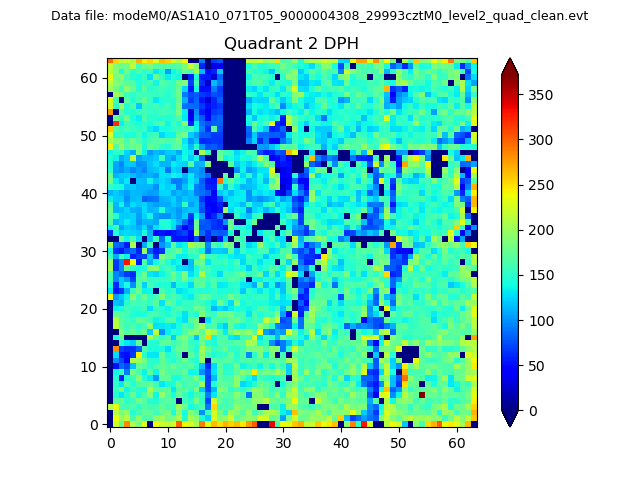
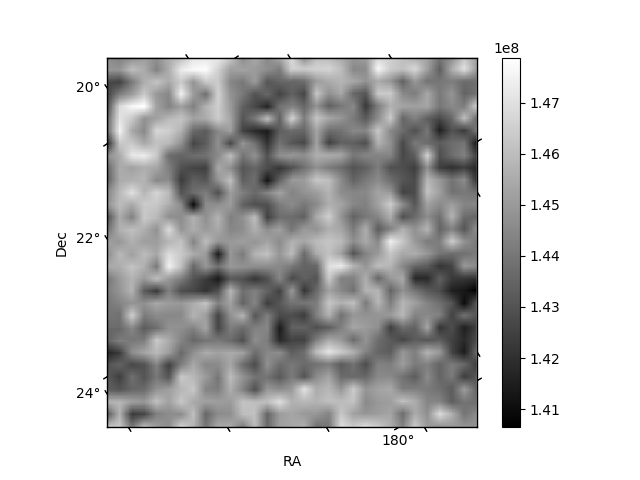
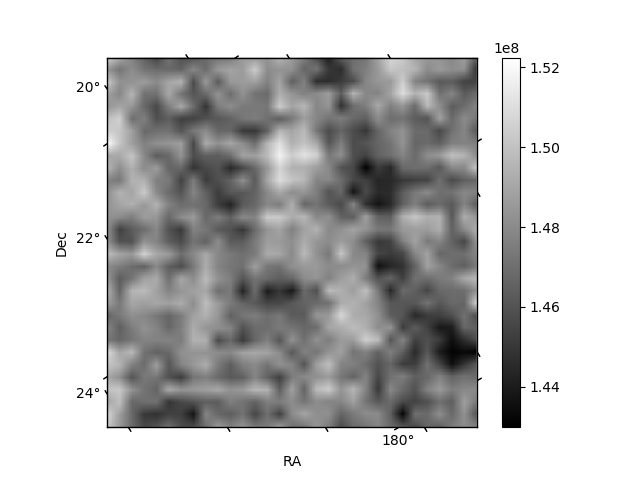
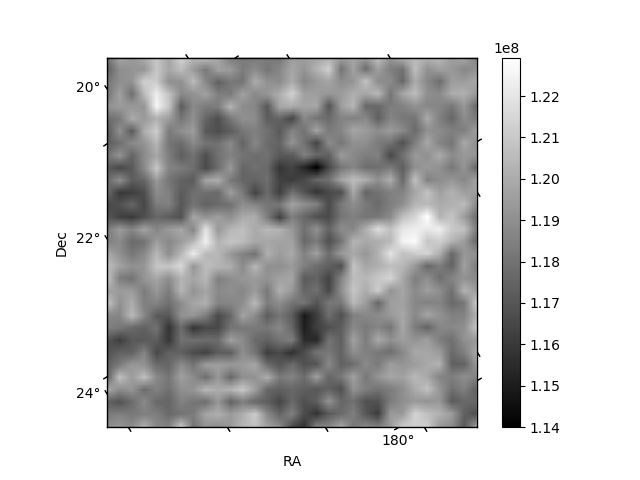
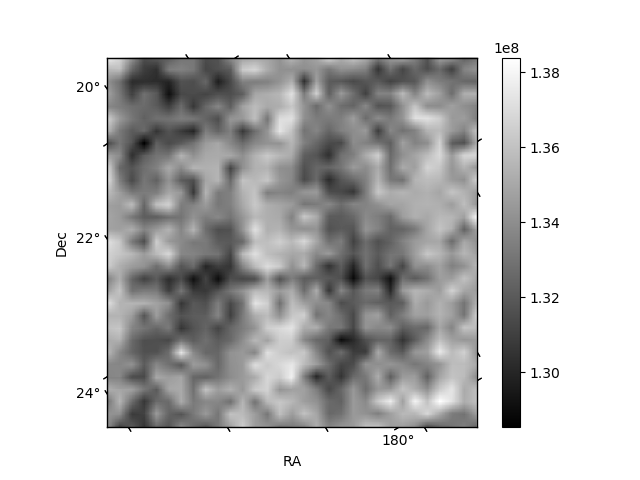
Histogram calculated using DETX and DETY for each event in the final _common_clean file
| Quadrant A | 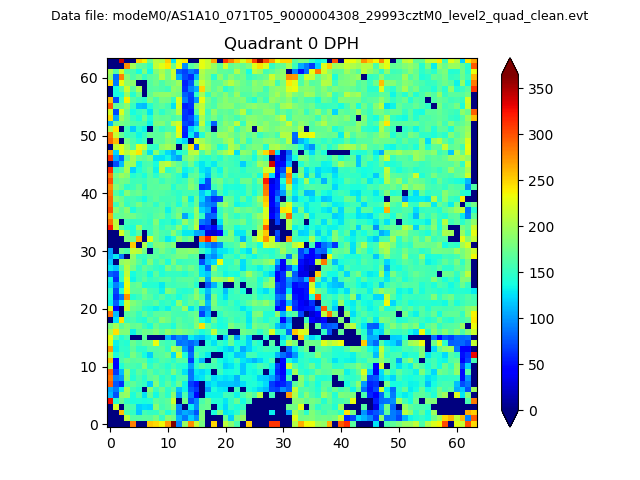 |
 |
Quadrant B |
|---|---|---|---|
| Quadrant D |  |
 |
Quadrant C |
| Plot type | Count rate plots | Images |
|---|---|---|
| Comparison with Poisson distribution Blue bars denote a histogram of data divided into 1 sec bins. Red curve is a Poisson curve with rate = median count rate of data. |
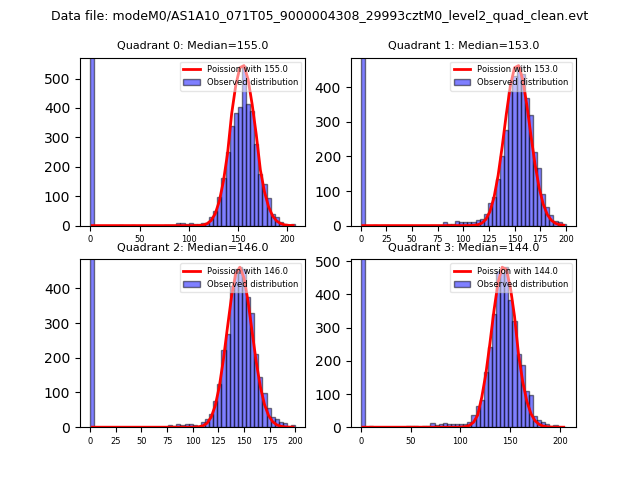 |
 |
| Quadrant-wise count rates Data is divided into 100 sec bins |
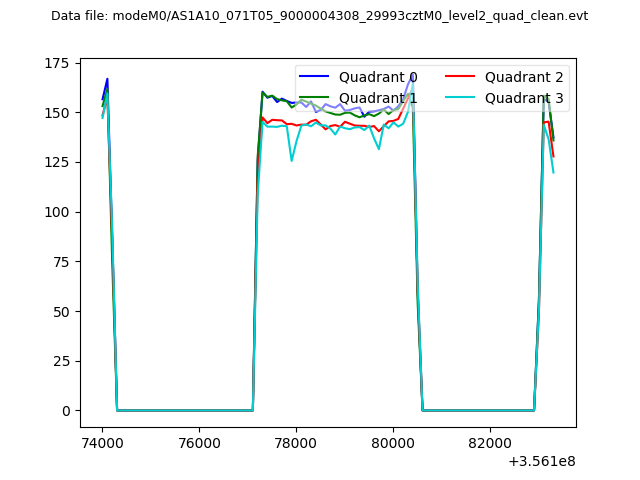 |
|
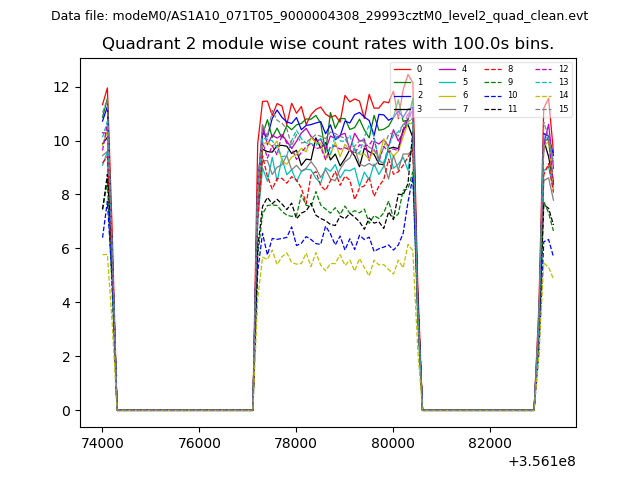
| Module-wise count rates for Quadrant A Data is divided into 100 sec bins |
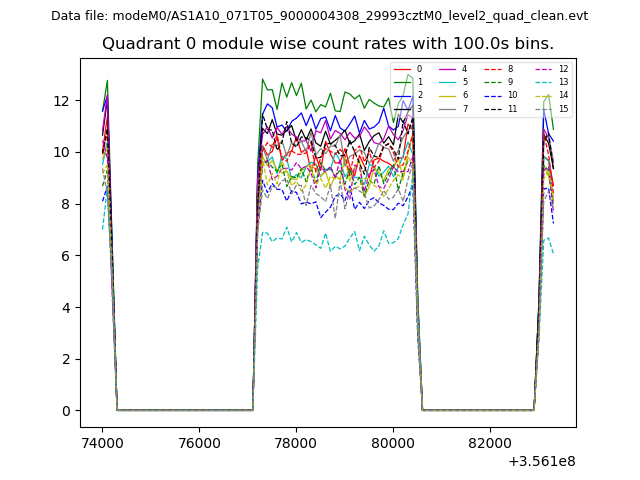 |
 |
| Module-wise count rates for Quadrant B Data is divided into 100 sec bins |
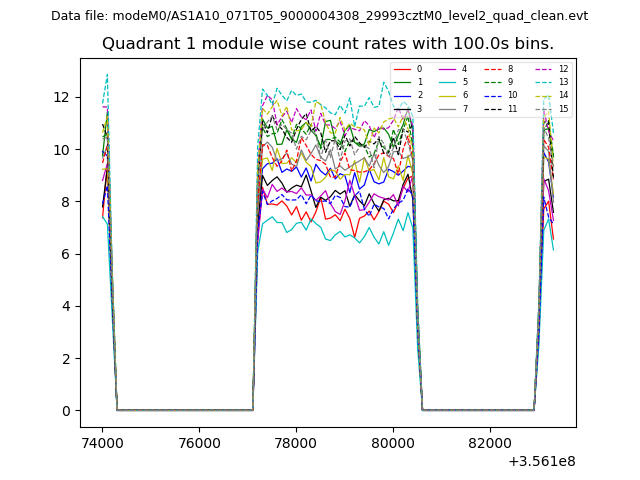 |
 |
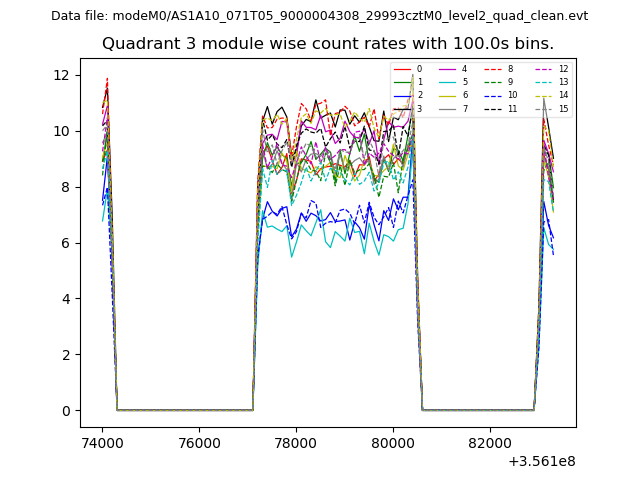
| Module-wise count rates for Quadrant C Data is divided into 100 sec bins |
 |
 |
| Module-wise count rates for Quadrant D Data is divided into 100 sec bins |
 |
 |
| Parameter | Plot |
|---|---|
| CZT HV Monitor | 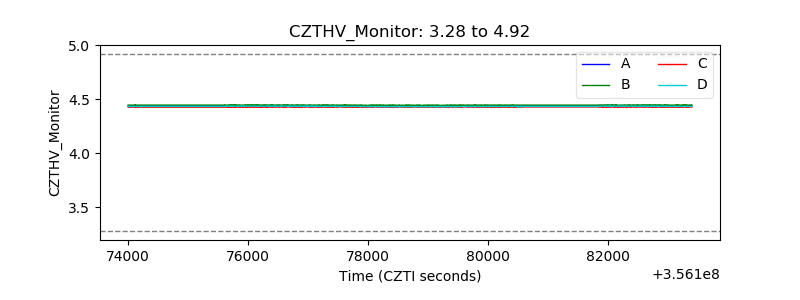 |
| D_VDD | 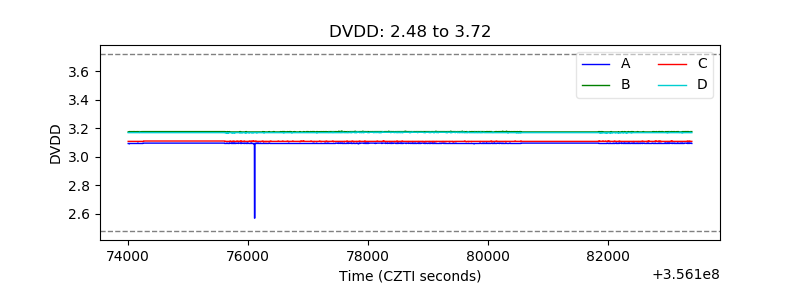 |
| Temperature 1 |  |
| Veto HV Monitor | 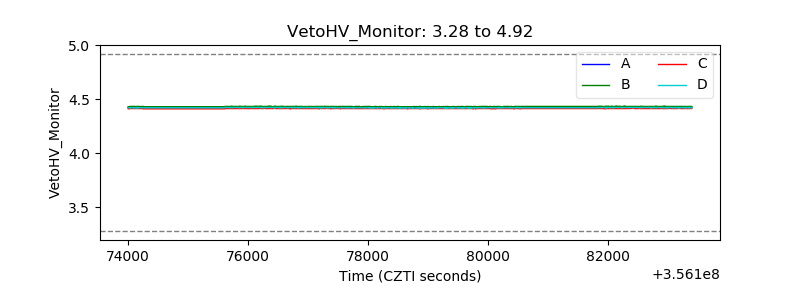 |
| Veto LLD | 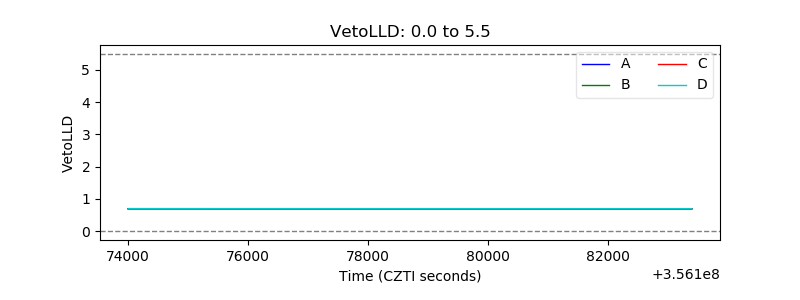 |
| Alpha Counter | 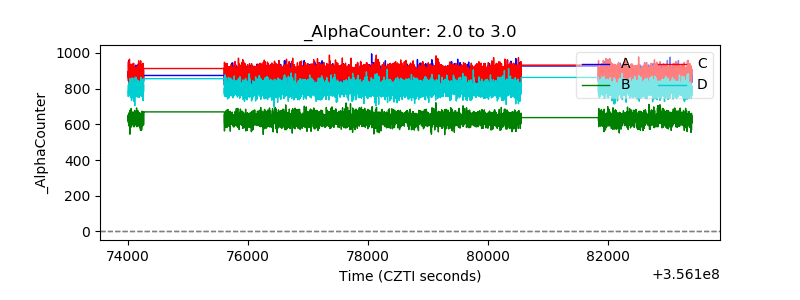 |
| _CPM_Rate | 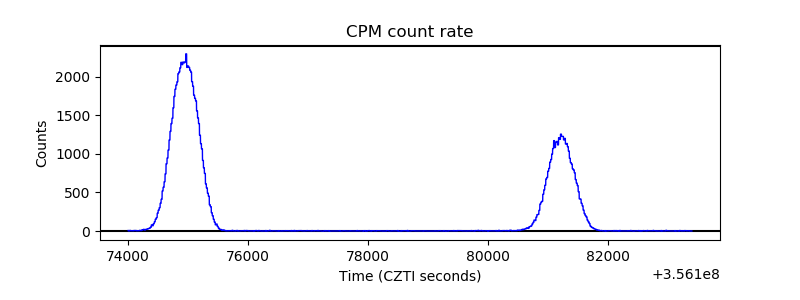 |
| CZT Counter | 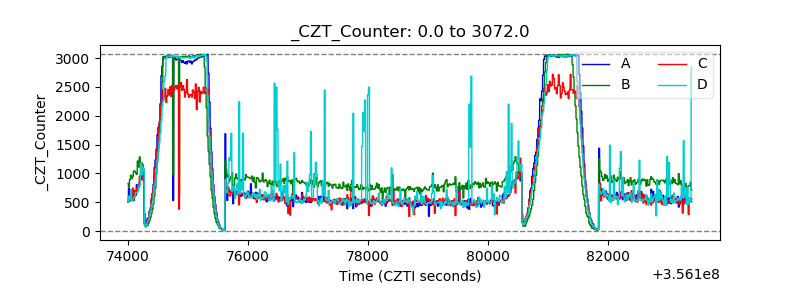 |
| +2.5 Volts monitor |  |
| +5 Volts monitor |  |
| _ROLL_ROT | 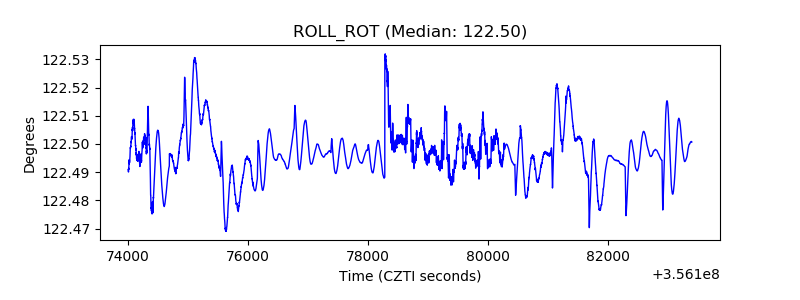 |
| _Roll_DEC | 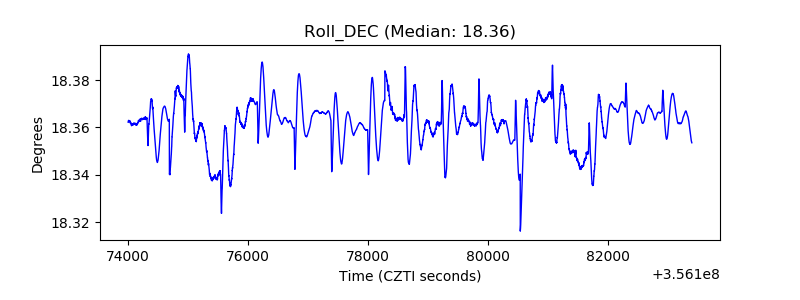 |
| _Roll_RA | 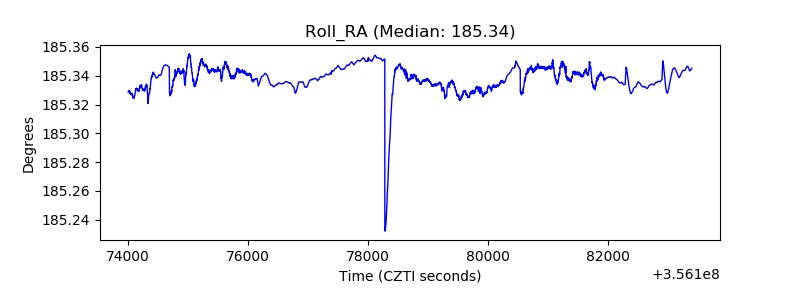 |
| Veto Counter | 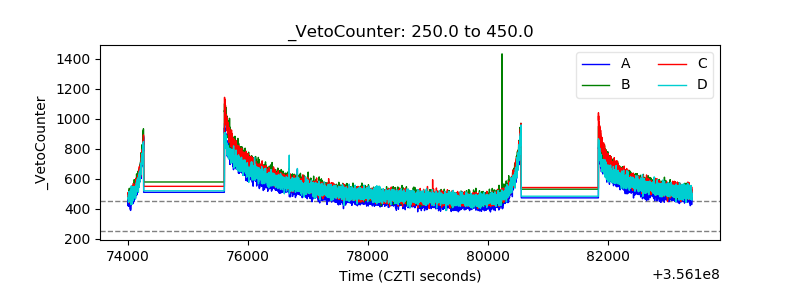 |