| Param | Original file | Final file |
|---|---|---|
| Filename | modeM0/AS1A10_071T05_9000004308_29994cztM0_level2.evt | modeM0/AS1A10_071T05_9000004308_29994cztM0_level2_quad_clean.evt |
| Size (bytes) | 657,936,000 | 95,215,680 |
| Size | 627.5 MB | 90.8 MB |
| Events in quadrant A | 3,734,271 | 633,082 |
| Events in quadrant B | 5,535,189 | 624,916 |
| Events in quadrant C | 3,570,364 | 597,734 |
| Events in quadrant D | 6,637,406 | 564,634 |
| Mode M0 | |||
|---|---|---|---|
| Quadrant | BADHDUFLAG | Total packets | Discarded packets |
| A | 0 | 15052 | 2 |
| B | 0 | 20730 | 2 |
| C | 0 | 14388 | 2 |
| D | 0 | 24166 | 2 |
| Mode SS | |||
|---|---|---|---|
| Quadrant | BADHDUFLAG | Total packets | Discarded packets |
| A | 0 | 136 | 0 |
| B | 0 | 136 | 0 |
| C | 0 | 136 | 0 |
| D | 0 | 136 | 0 |
| Mode M9 | |||
|---|---|---|---|
| Quadrant | BADHDUFLAG | Total packets | Discarded packets |
| A | 0 | 21 | 0 |
| B | 0 | 22 | 0 |
| C | 0 | 22 | 0 |
| D | 0 | 22 | 0 |
| Quadrant | Total seconds | Saturated seconds | Saturation percentage |
|---|---|---|---|
| A | 6636 | 128 | 1.928873% |
| B | 6636 | 214 | 3.224834% |
| C | 6636 | 159 | 2.396022% |
| D | 6636 | 649 | 9.779988% |
Noise dominated data is calculated using 1-second bins in cleaned event files. If a bin has >2000 counts, and if more than 50% of those come from <1% of pixels, then it is considered to be noise-dominated and hence unusable.
| Quadrant | # 1 sec bins | Bins with >0 counts | Bins with >2000 counts | High rate bins dominated by noise | Noise dominated (total time) | Noise dominated (detector-on time) | Marked lightcurve |
|---|---|---|---|---|---|---|---|
| A | 7761 | 6637 | 4 | 4 | 0.05% | 0.06% | 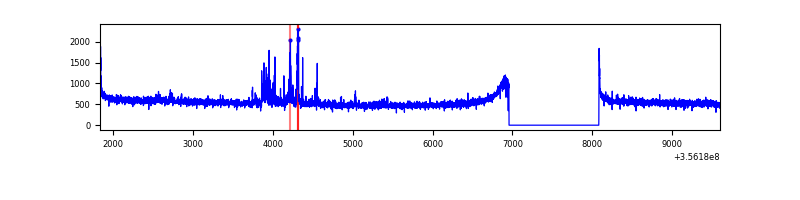 |
| B | 7761 | 6637 | 5 | 5 | 0.06% | 0.08% | 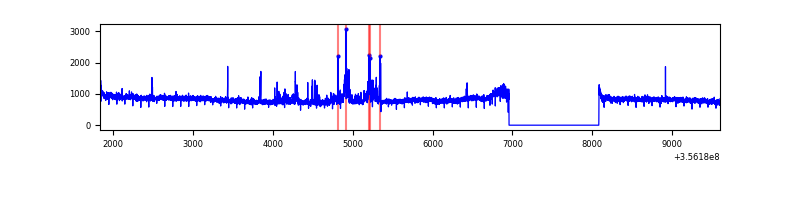 |
| C | 7761 | 6637 | 0 | 0 | 0.00% | 0.00% | 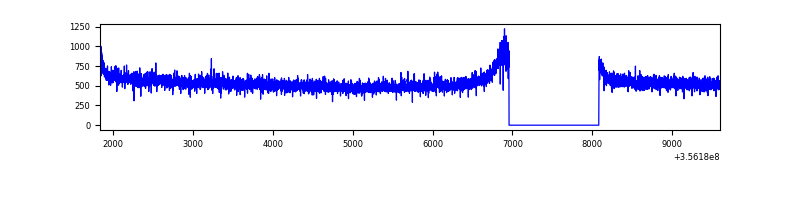 |
| D | 7761 | 6636 | 504 | 504 | 6.49% | 7.59% | 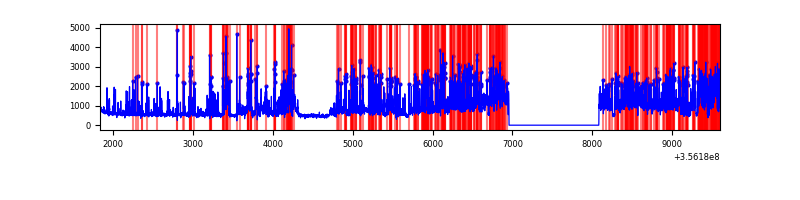 |
Top three noisy pixels from each quadrant. If the there are fewer than three noisy pixels in the level2.evt file, extra rows are filled as -1
| Pixel properties | Quadrant properties | ||||||
|---|---|---|---|---|---|---|---|
| Quadrant | DetID | PixID | Counts | Sigma | Mean | Median | Sigma |
| A | 12 | 96 | 104461 | 568.46 | 920 | 904 | 182.2 |
| A | 3 | 1 | 62299 | 337.02 | 920 | 904 | 182.2 |
| A | 8 | 192 | 22321 | 117.57 | 920 | 904 | 182.2 |
| B | 6 | 159 | 1828162 | 10797.18 | 894 | 874 | 169.2 |
| B | 6 | 36 | 164853 | 968.93 | 894 | 874 | 169.2 |
| B | 12 | 111 | 20899 | 118.32 | 894 | 874 | 169.2 |
| C | 14 | 238 | 142347 | 696.93 | 870 | 879 | 203.0 |
| C | 3 | 233 | 21368 | 100.94 | 870 | 879 | 203.0 |
| C | 2 | 114 | 15586 | 72.45 | 870 | 879 | 203.0 |
| D | 7 | 80 | 3279750 | 16005.05 | 859 | 836 | 204.9 |
| D | 8 | 195 | 44810 | 214.65 | 859 | 836 | 204.9 |
| D | 10 | 199 | 30038 | 142.54 | 859 | 836 | 204.9 |
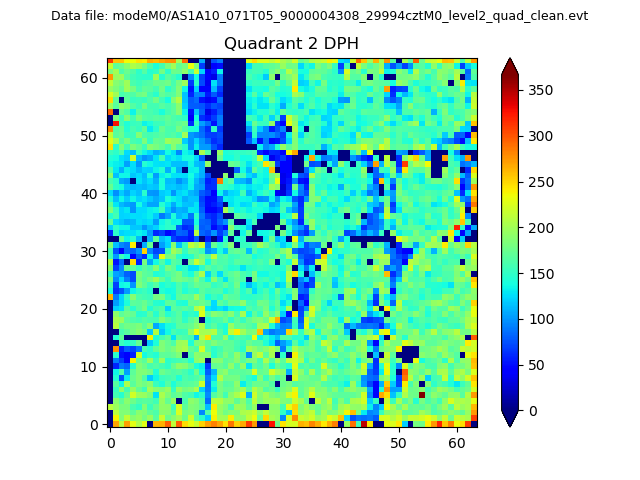
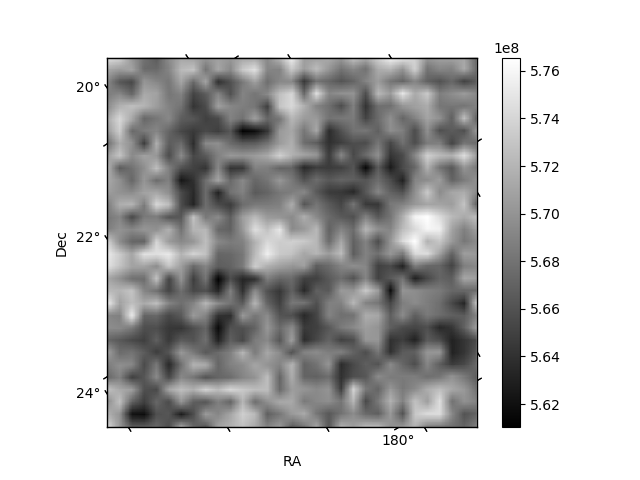
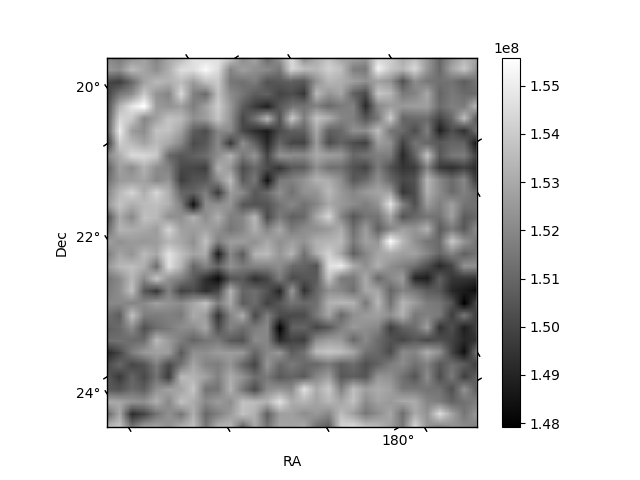
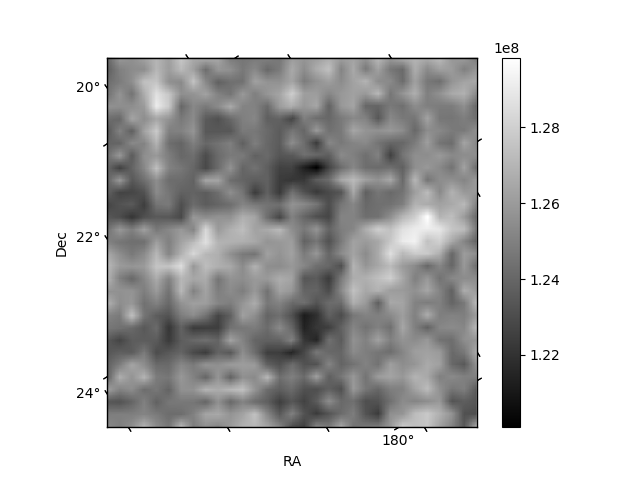
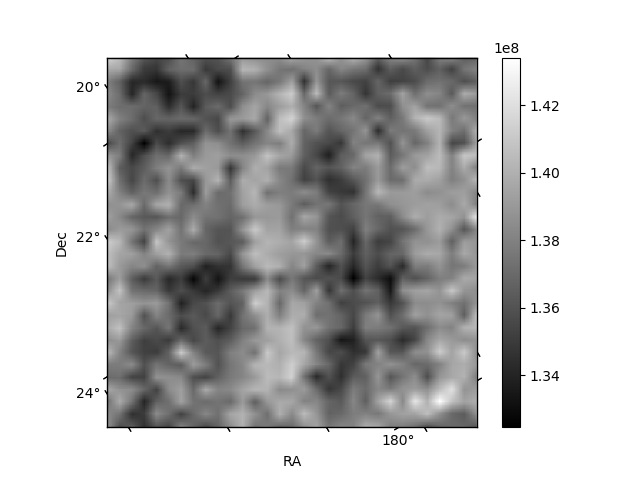
Histogram calculated using DETX and DETY for each event in the final _common_clean file
| Quadrant A | 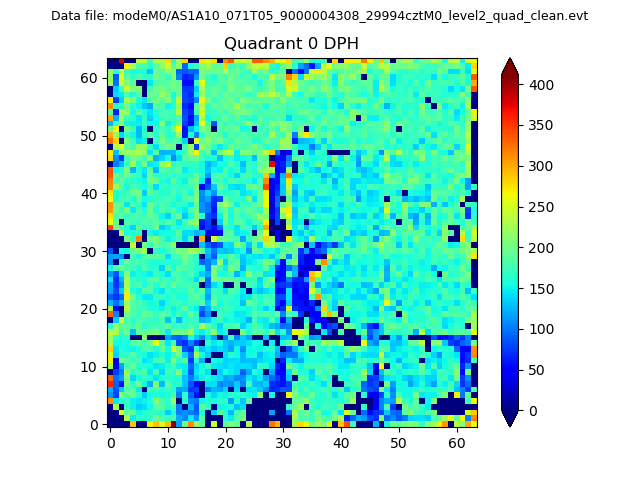 |
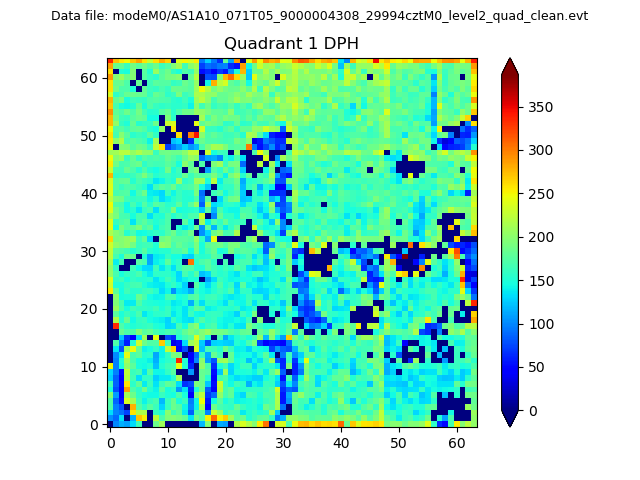 |
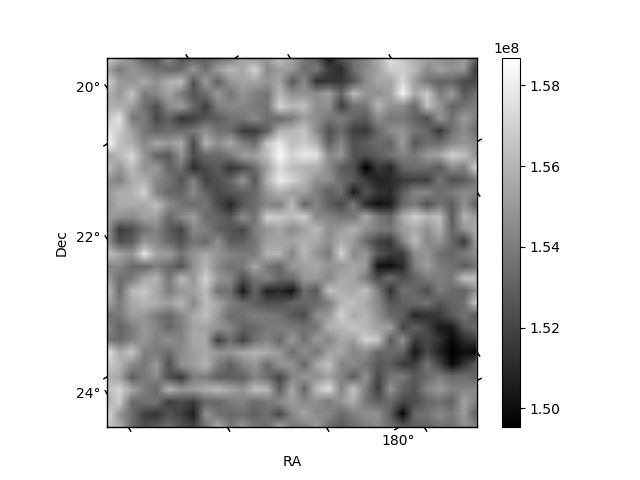
Quadrant B |
|---|---|---|---|
| Quadrant D | 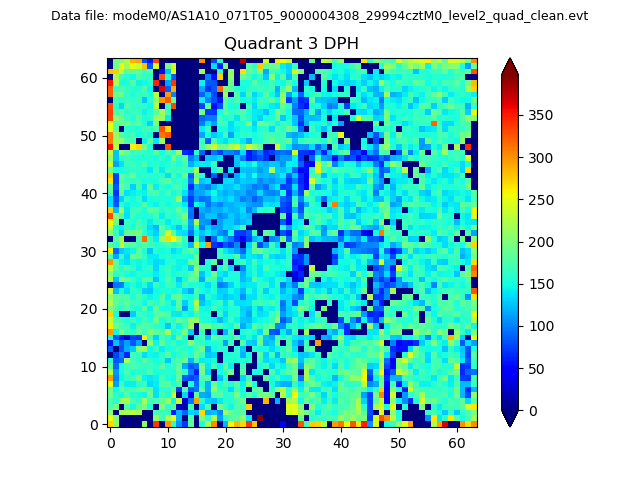 |
 |
Quadrant C |
| Plot type | Count rate plots | Images |
|---|---|---|
| Comparison with Poisson distribution Blue bars denote a histogram of data divided into 1 sec bins. Red curve is a Poisson curve with rate = median count rate of data. |
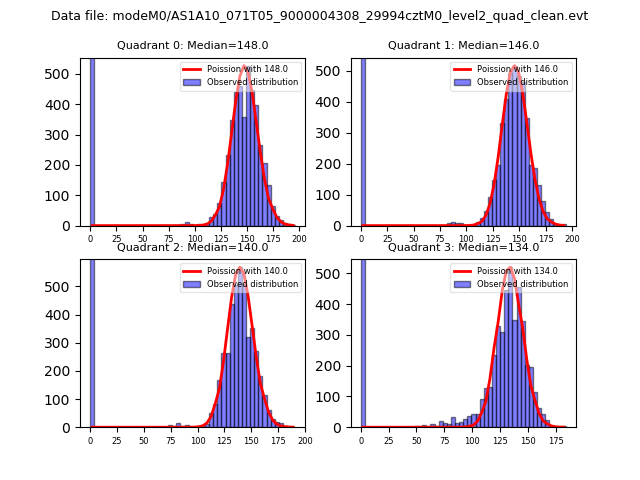 |
 |
| Quadrant-wise count rates Data is divided into 100 sec bins |
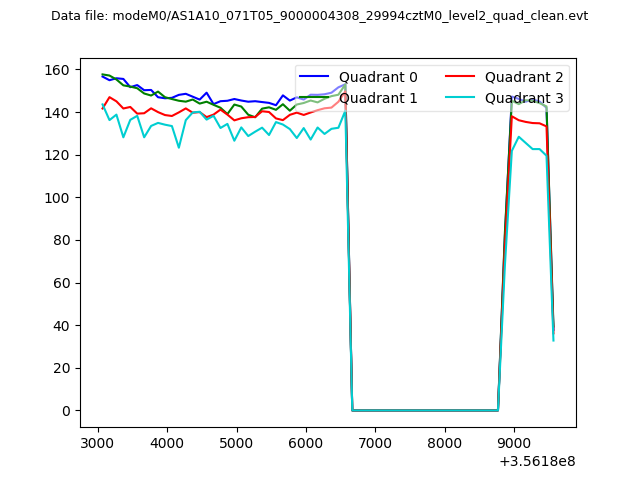 |
|
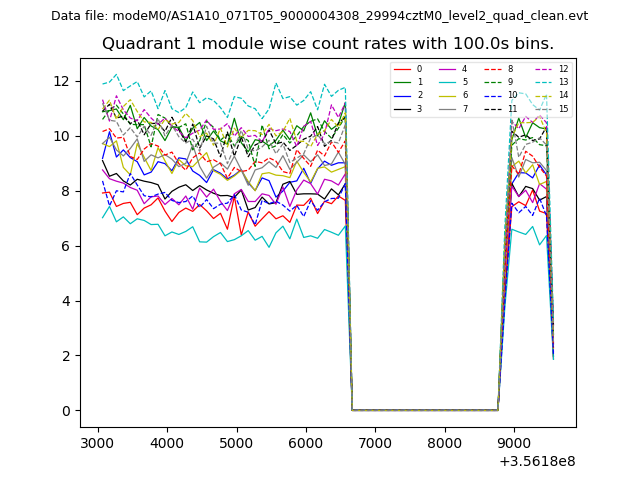
| Module-wise count rates for Quadrant A Data is divided into 100 sec bins |
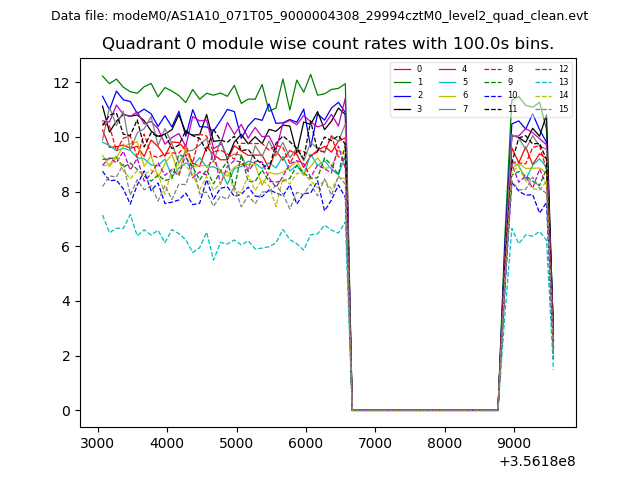 |
 |
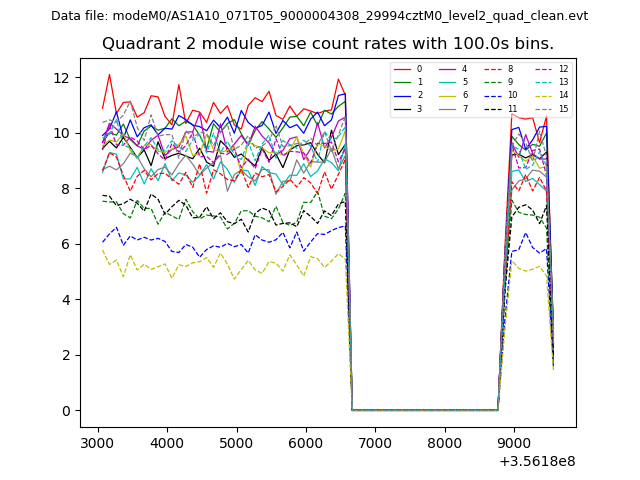
| Module-wise count rates for Quadrant B Data is divided into 100 sec bins |
 |
 |
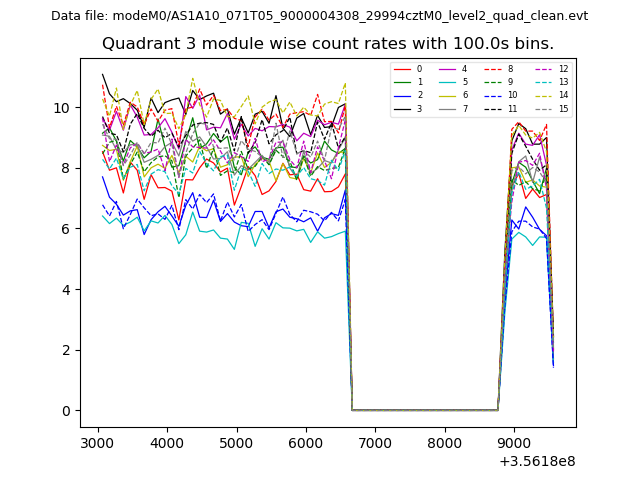
| Module-wise count rates for Quadrant C Data is divided into 100 sec bins |
 |
 |
| Module-wise count rates for Quadrant D Data is divided into 100 sec bins |
 |
 |
| Parameter | Plot |
|---|---|
| CZT HV Monitor | 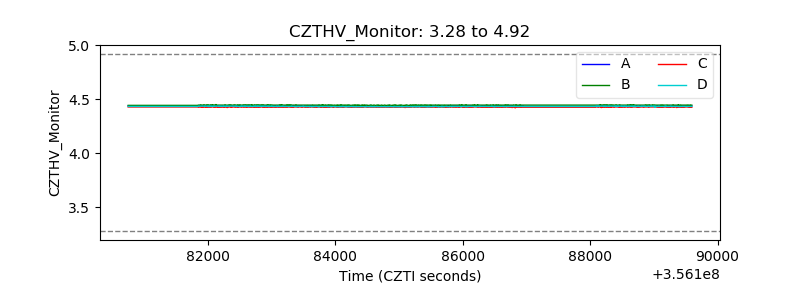 |
| D_VDD | 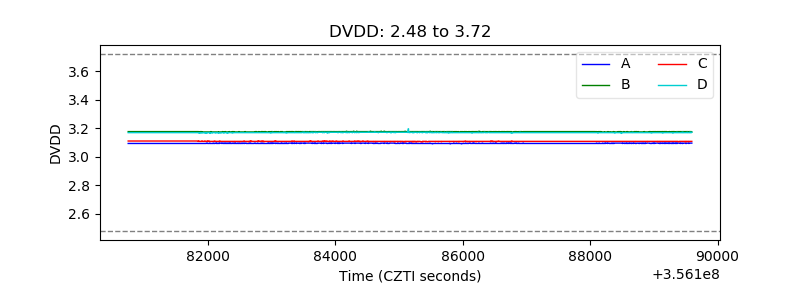 |
| Temperature 1 |  |
| Veto HV Monitor | 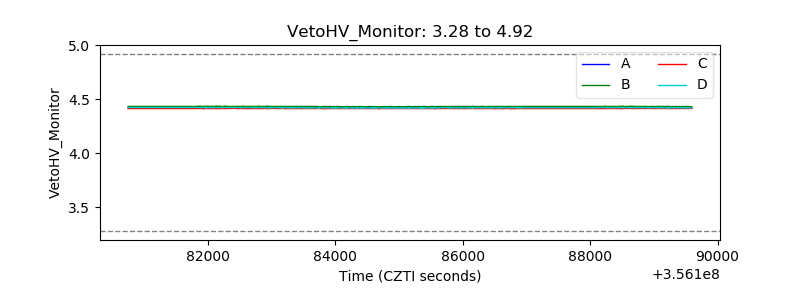 |
| Veto LLD |  |
| Alpha Counter | 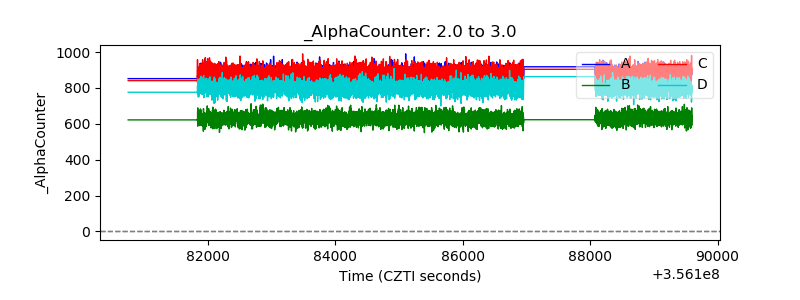 |
| _CPM_Rate | 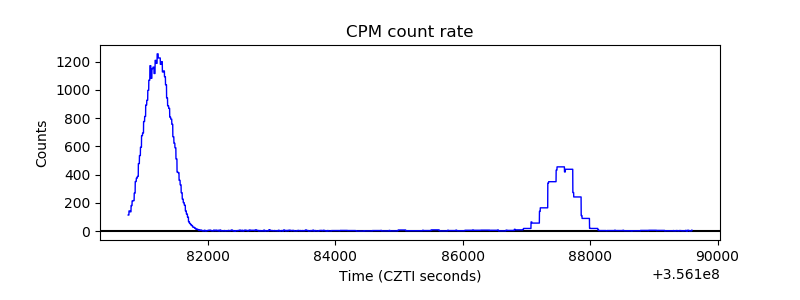 |
| CZT Counter | 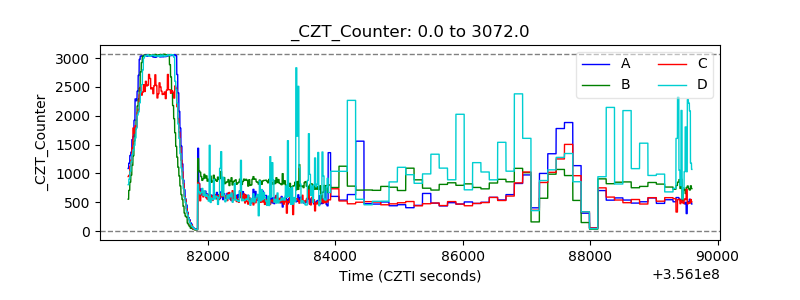 |
| +2.5 Volts monitor |  |
| +5 Volts monitor |  |
| _ROLL_ROT | 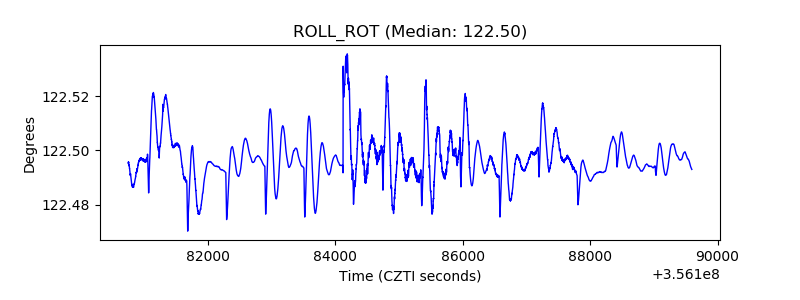 |
| _Roll_DEC | 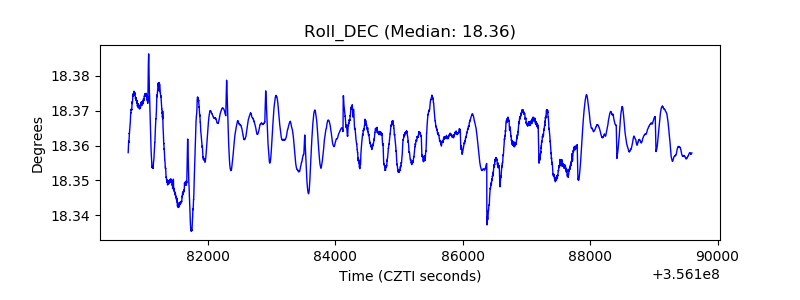 |
| _Roll_RA | 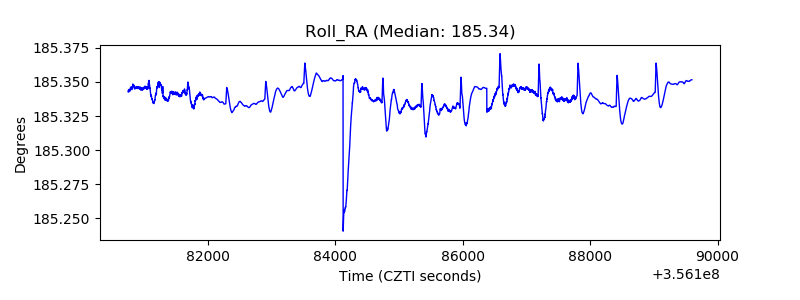 |
| Veto Counter | 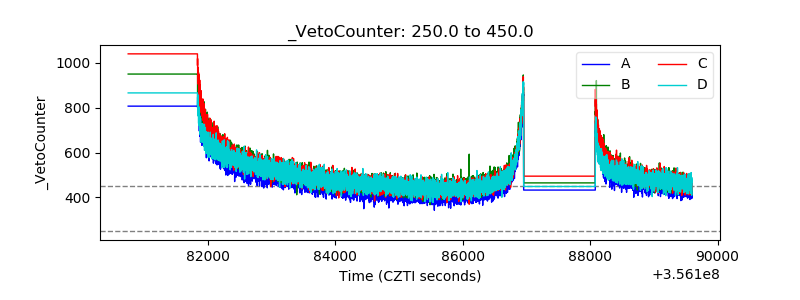 |