| Param | Original file | Final file |
|---|---|---|
| Filename | modeM0/AS1A10_071T05_9000004308_29996cztM0_level2.evt | modeM0/AS1A10_071T05_9000004308_29996cztM0_level2_quad_clean.evt |
| Size (bytes) | 614,361,600 | 122,221,440 |
| Size | 585.9 MB | 116.6 MB |
| Events in quadrant A | 3,632,375 | 822,619 |
| Events in quadrant B | 5,670,956 | 814,069 |
| Events in quadrant C | 3,684,028 | 783,304 |
| Events in quadrant D | 5,109,275 | 758,363 |
| Mode M0 | |||
|---|---|---|---|
| Quadrant | BADHDUFLAG | Total packets | Discarded packets |
| A | 0 | 15490 | 1 |
| B | 0 | 22782 | 1 |
| C | 0 | 15505 | 1 |
| D | 0 | 20121 | 1 |
| Mode SS | |||
|---|---|---|---|
| Quadrant | BADHDUFLAG | Total packets | Discarded packets |
| A | 0 | 150 | 0 |
| B | 0 | 152 | 0 |
| C | 0 | 152 | 0 |
| D | 0 | 152 | 0 |
| Mode M9 | |||
|---|---|---|---|
| Quadrant | BADHDUFLAG | Total packets | Discarded packets |
| A | 0 | 8 | 0 |
| B | 0 | 8 | 0 |
| C | 0 | 8 | 0 |
| D | 0 | 8 | 0 |
| Quadrant | Total seconds | Saturated seconds | Saturation percentage |
|---|---|---|---|
| A | 7527 | 113 | 1.501262% |
| B | 7527 | 192 | 2.550817% |
| C | 7528 | 151 | 2.005845% |
| D | 7528 | 305 | 4.051541% |
Noise dominated data is calculated using 1-second bins in cleaned event files. If a bin has >2000 counts, and if more than 50% of those come from <1% of pixels, then it is considered to be noise-dominated and hence unusable.
| Quadrant | # 1 sec bins | Bins with >0 counts | Bins with >2000 counts | High rate bins dominated by noise | Noise dominated (total time) | Noise dominated (detector-on time) | Marked lightcurve |
|---|---|---|---|---|---|---|---|
| A | 8282 | 7528 | 0 | 0 | 0.00% | 0.00% | 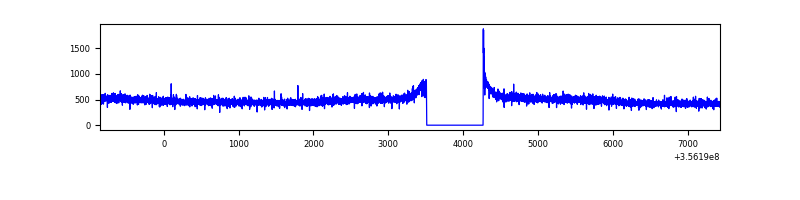 |
| B | 8282 | 7528 | 4 | 4 | 0.05% | 0.05% | 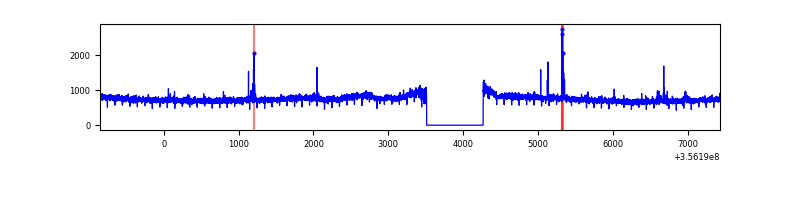 |
| C | 8283 | 7529 | 0 | 0 | 0.00% | 0.00% |  |
| D | 8283 | 7529 | 207 | 207 | 2.50% | 2.75% | 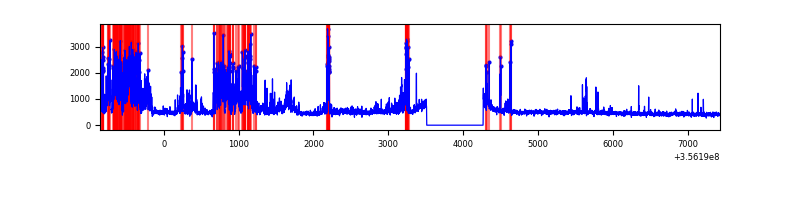 |
Top three noisy pixels from each quadrant. If the there are fewer than three noisy pixels in the level2.evt file, extra rows are filled as -1
| Pixel properties | Quadrant properties | ||||||
|---|---|---|---|---|---|---|---|
| Quadrant | DetID | PixID | Counts | Sigma | Mean | Median | Sigma |
| A | 13 | 254 | 13760 | 67.9 | 937 | 920 | 189.1 |
| A | 8 | 192 | 11618 | 56.57 | 937 | 920 | 189.1 |
| A | 3 | 137 | 9312 | 44.38 | 937 | 920 | 189.1 |
| B | 6 | 159 | 2007780 | 11260.6 | 915 | 890 | 178.2 |
| B | 0 | 229 | 32327 | 176.39 | 915 | 890 | 178.2 |
| B | 0 | 183 | 29960 | 163.11 | 915 | 890 | 178.2 |
| C | 14 | 238 | 146070 | 688.91 | 897 | 906 | 210.7 |
| C | 3 | 233 | 19716 | 89.27 | 897 | 906 | 210.7 |
| C | 2 | 114 | 17642 | 79.42 | 897 | 906 | 210.7 |
| D | 7 | 80 | 1557721 | 6864.59 | 899 | 881 | 226.8 |
| D | 2 | 250 | 67922 | 295.6 | 899 | 881 | 226.8 |
| D | 8 | 195 | 50426 | 218.46 | 899 | 881 | 226.8 |
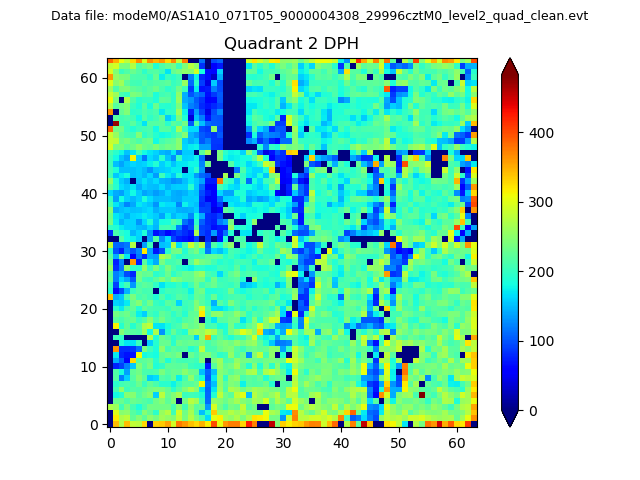
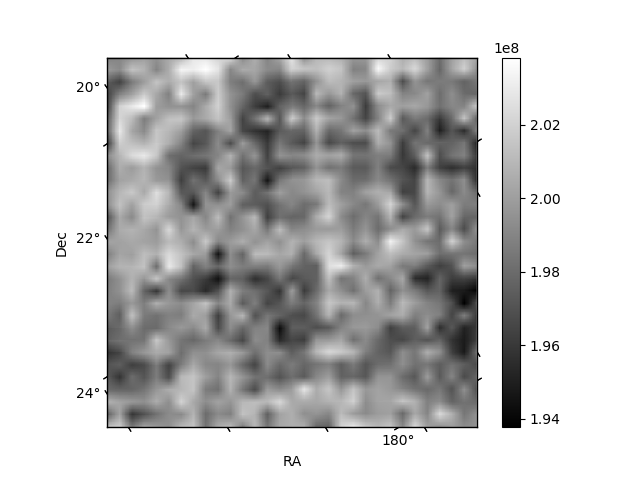
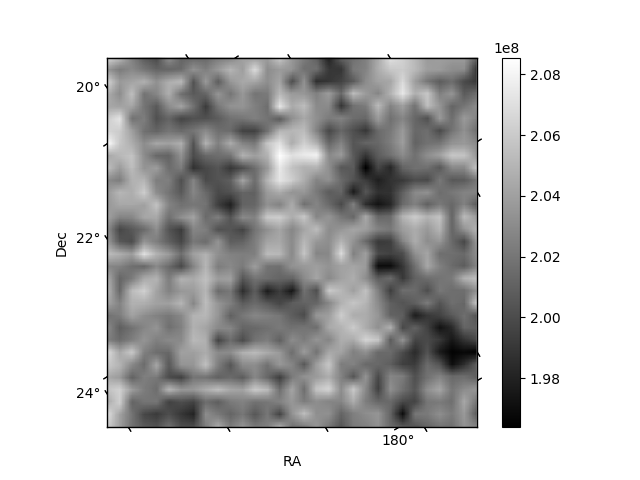
Histogram calculated using DETX and DETY for each event in the final _common_clean file
| Quadrant A | 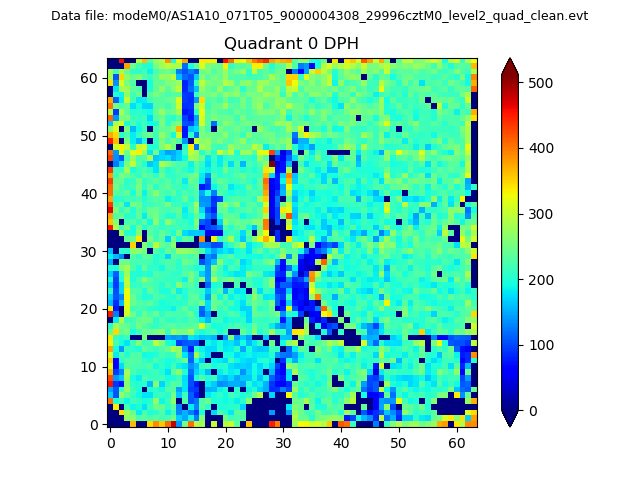 |
 |
Quadrant B |
|---|---|---|---|
| Quadrant D |  |
 |
Quadrant C |
| Plot type | Count rate plots | Images |
|---|---|---|
| Comparison with Poisson distribution Blue bars denote a histogram of data divided into 1 sec bins. Red curve is a Poisson curve with rate = median count rate of data. |
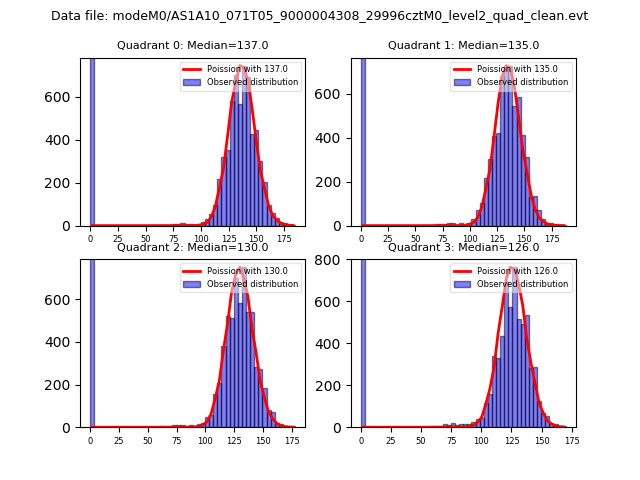 |
 |
| Quadrant-wise count rates Data is divided into 100 sec bins |
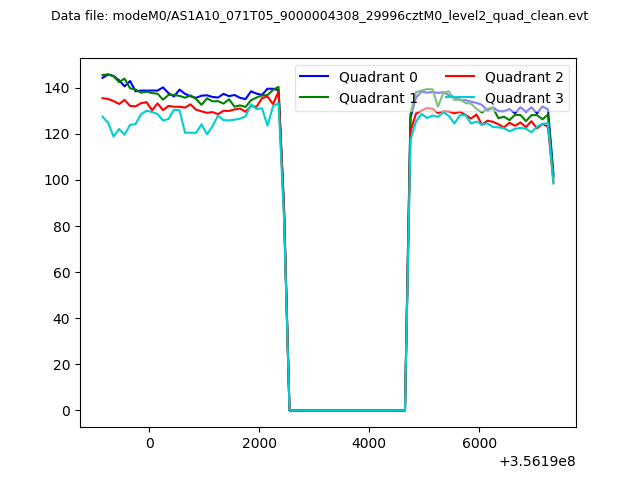 |
|
| Module-wise count rates for Quadrant A Data is divided into 100 sec bins |
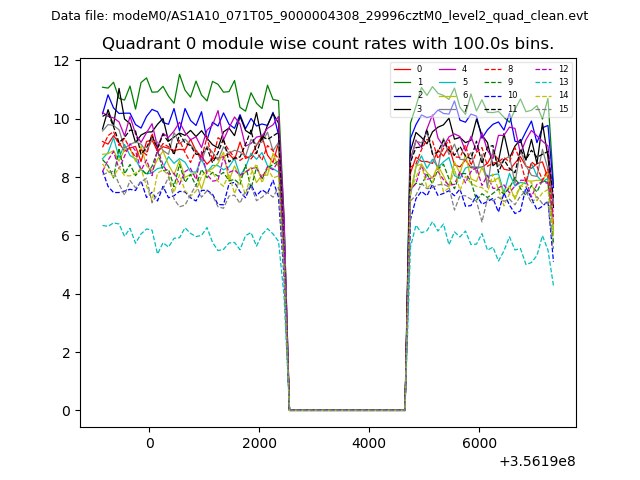 |
 |
| Module-wise count rates for Quadrant B Data is divided into 100 sec bins |
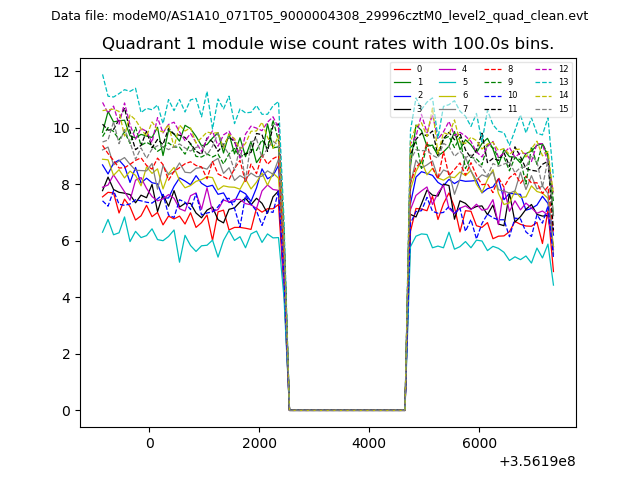 |
 |
| Module-wise count rates for Quadrant C Data is divided into 100 sec bins |
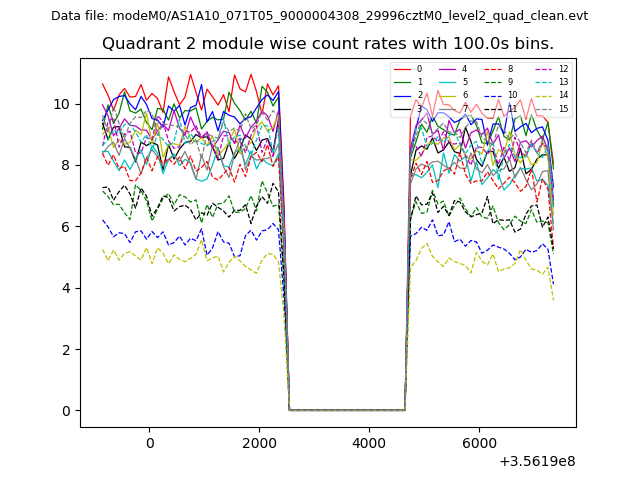 |
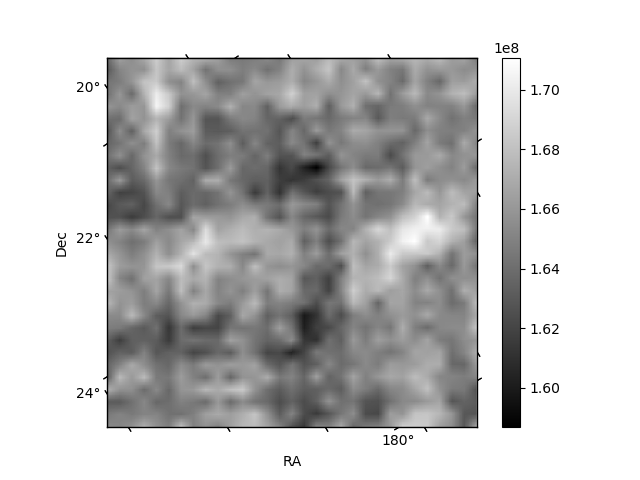 |
| Module-wise count rates for Quadrant D Data is divided into 100 sec bins |
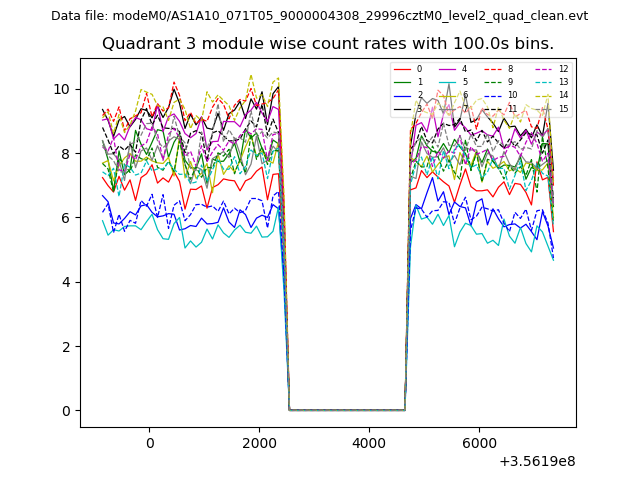 |
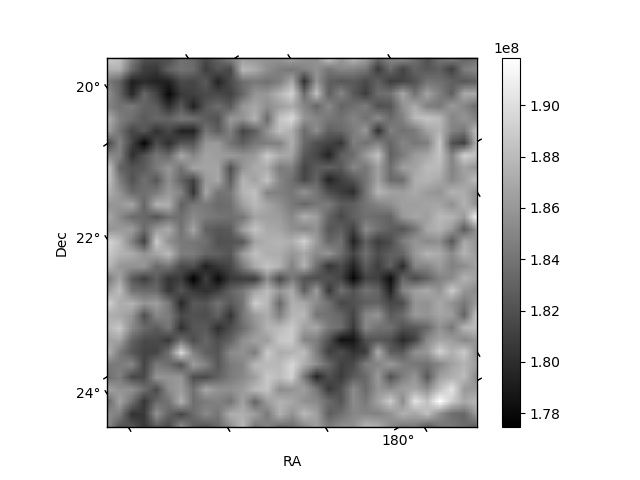 |
| Parameter | Plot |
|---|---|
| CZT HV Monitor | 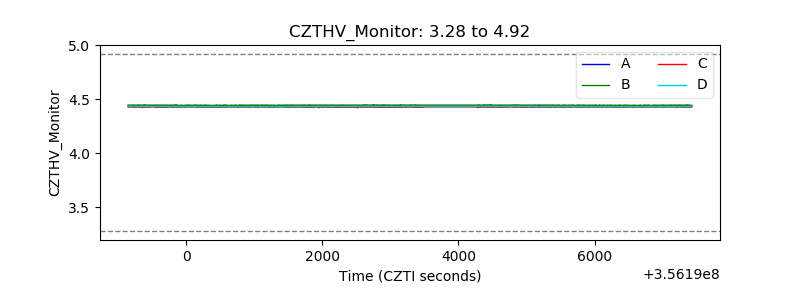 |
| D_VDD | 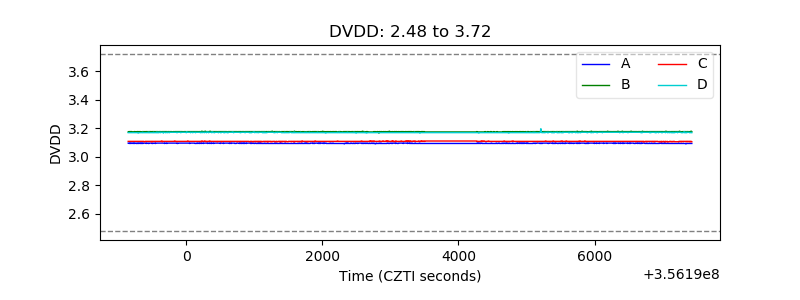 |
| Temperature 1 | 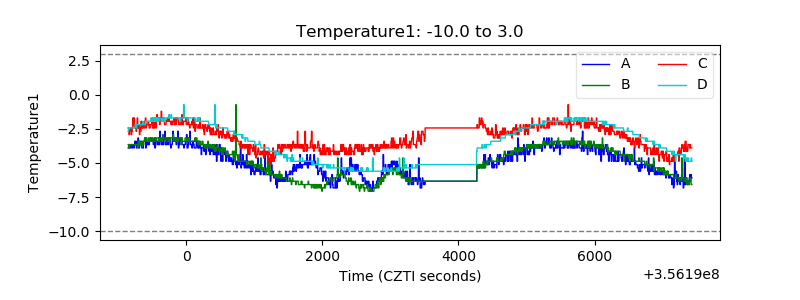 |
| Veto HV Monitor | 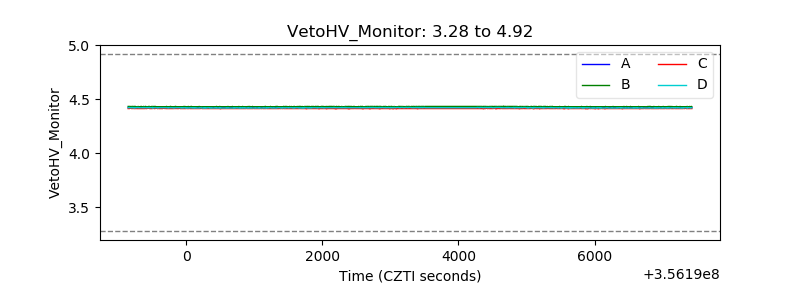 |
| Veto LLD | 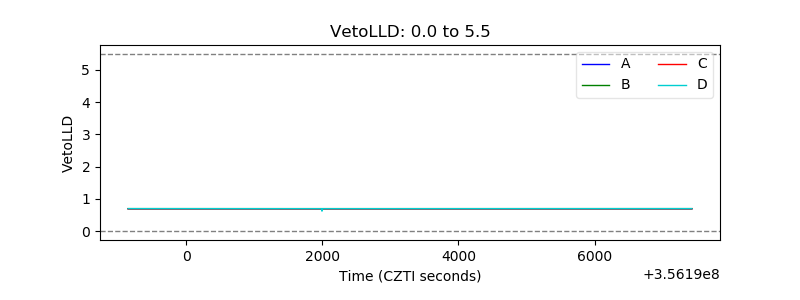 |
| Alpha Counter | 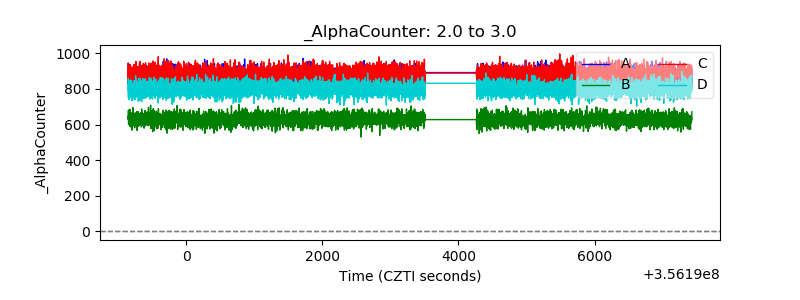 |
| _CPM_Rate | 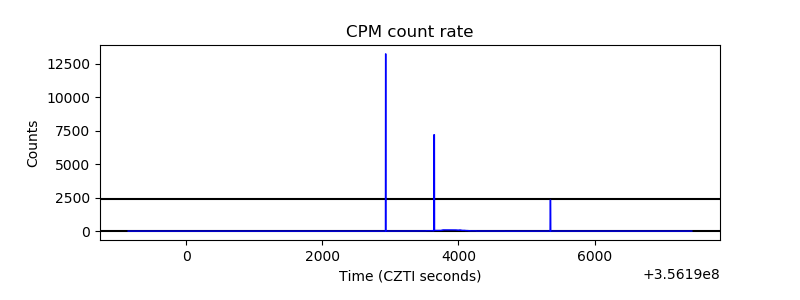 |
| CZT Counter | 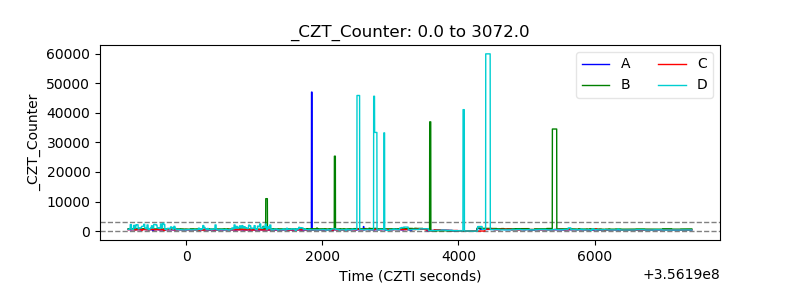 |
| +2.5 Volts monitor |  |
| +5 Volts monitor |  |
| _ROLL_ROT | 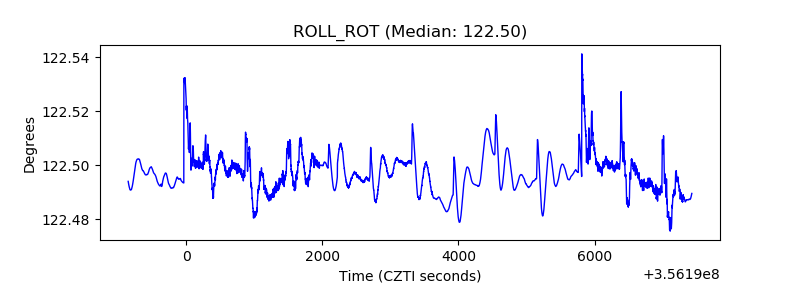 |
| _Roll_DEC | 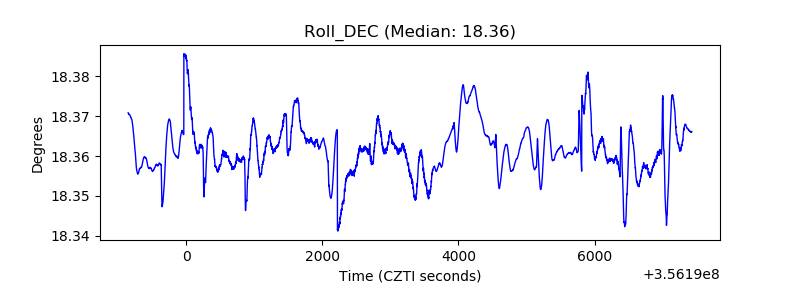 |
| _Roll_RA | 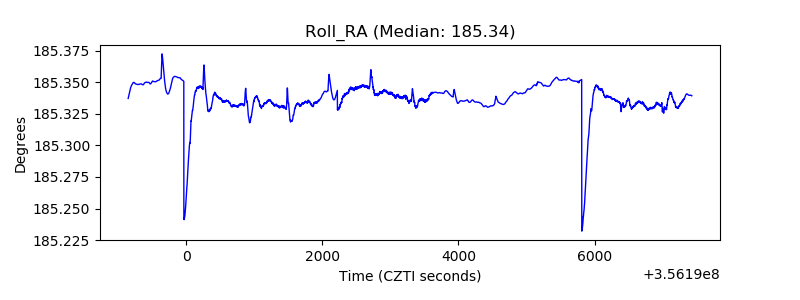 |
| Veto Counter | 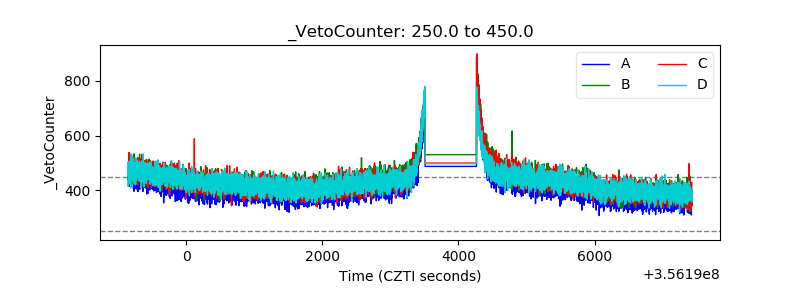 |