| Param | Original file | Final file |
|---|---|---|
| Filename | modeM0/AS1A10_083T01_9000004306_29983cztM0_level2.evt | modeM0/AS1A10_083T01_9000004306_29983cztM0_level2_quad_clean.evt |
| Size (bytes) | 579,484,800 | 97,352,640 |
| Size | 552.6 MB | 92.8 MB |
| Events in quadrant A | 3,637,996 | 622,985 |
| Events in quadrant B | 5,864,519 | 614,528 |
| Events in quadrant C | 3,714,798 | 592,514 |
| Events in quadrant D | 3,817,546 | 589,784 |
| Mode M9 | |||
|---|---|---|---|
| Quadrant | BADHDUFLAG | Total packets | Discarded packets |
| A | 0 | 6 | 0 |
| B | 0 | 6 | 0 |
| C | 0 | 6 | 0 |
| D | 0 | 6 | 0 |
| Mode M0 | |||
|---|---|---|---|
| Quadrant | BADHDUFLAG | Total packets | Discarded packets |
| A | 0 | 15749 | 2 |
| B | 0 | 23001 | 2 |
| C | 0 | 15851 | 2 |
| D | 0 | 16237 | 2 |
| Mode SS | |||
|---|---|---|---|
| Quadrant | BADHDUFLAG | Total packets | Discarded packets |
| A | 0 | 156 | 0 |
| B | 0 | 156 | 0 |
| C | 0 | 156 | 0 |
| D | 0 | 156 | 0 |
| Quadrant | Total seconds | Saturated seconds | Saturation percentage |
|---|---|---|---|
| A | 7596 | 146 | 1.922064% |
| B | 7596 | 262 | 3.449184% |
| C | 7596 | 150 | 1.974724% |
| D | 7596 | 66 | 0.868878% |
Noise dominated data is calculated using 1-second bins in cleaned event files. If a bin has >2000 counts, and if more than 50% of those come from <1% of pixels, then it is considered to be noise-dominated and hence unusable.
| Quadrant | # 1 sec bins | Bins with >0 counts | Bins with >2000 counts | High rate bins dominated by noise | Noise dominated (total time) | Noise dominated (detector-on time) | Marked lightcurve |
|---|---|---|---|---|---|---|---|
| A | 8191 | 7598 | 1 | 1 | 0.01% | 0.01% | 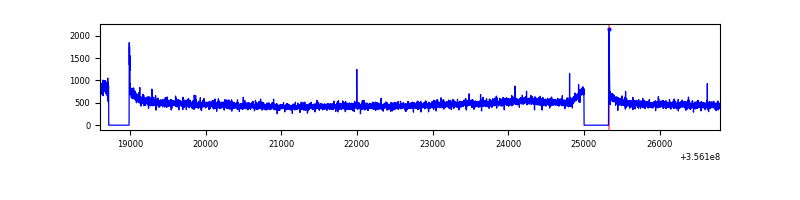 |
| B | 8191 | 7598 | 5 | 5 | 0.06% | 0.07% | 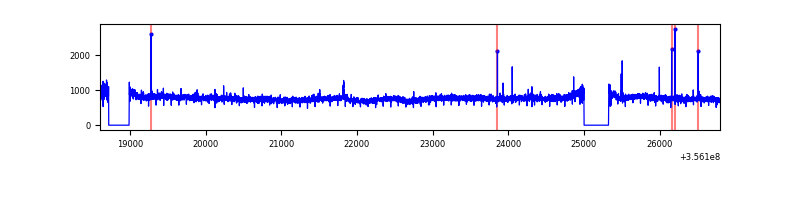 |
| C | 8191 | 7598 | 0 | 0 | 0.00% | 0.00% | 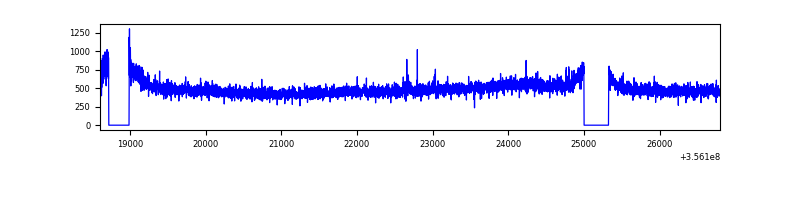 |
| D | 8191 | 7598 | 9 | 9 | 0.11% | 0.12% | 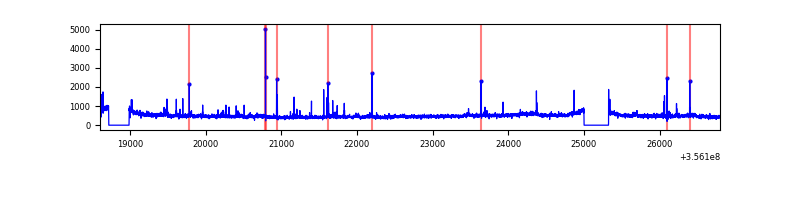 |
Top three noisy pixels from each quadrant. If the there are fewer than three noisy pixels in the level2.evt file, extra rows are filled as -1
| Pixel properties | Quadrant properties | ||||||
|---|---|---|---|---|---|---|---|
| Quadrant | DetID | PixID | Counts | Sigma | Mean | Median | Sigma |
| A | 8 | 192 | 27214 | 139.1 | 936 | 916 | 189.1 |
| A | 13 | 254 | 14059 | 69.52 | 936 | 916 | 189.1 |
| A | 3 | 137 | 9492 | 45.36 | 936 | 916 | 189.1 |
| B | 6 | 159 | 2200387 | 12399.12 | 918 | 894 | 177.4 |
| B | 6 | 36 | 28069 | 153.19 | 918 | 894 | 177.4 |
| B | 12 | 111 | 21958 | 118.74 | 918 | 894 | 177.4 |
| C | 14 | 238 | 144317 | 686.66 | 889 | 893 | 208.9 |
| C | 3 | 233 | 89890 | 426.09 | 889 | 893 | 208.9 |
| C | 2 | 114 | 18194 | 82.83 | 889 | 893 | 208.9 |
| D | 8 | 195 | 244857 | 1123.25 | 905 | 877 | 217.2 |
| D | 2 | 250 | 42056 | 189.58 | 905 | 877 | 217.2 |
| D | 2 | 234 | 35071 | 157.42 | 905 | 877 | 217.2 |
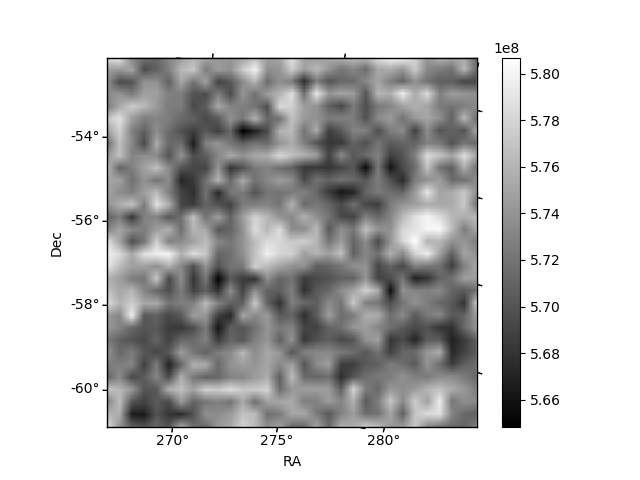
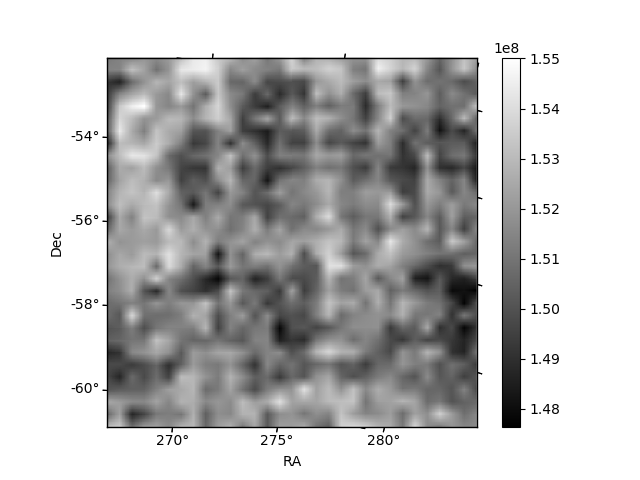
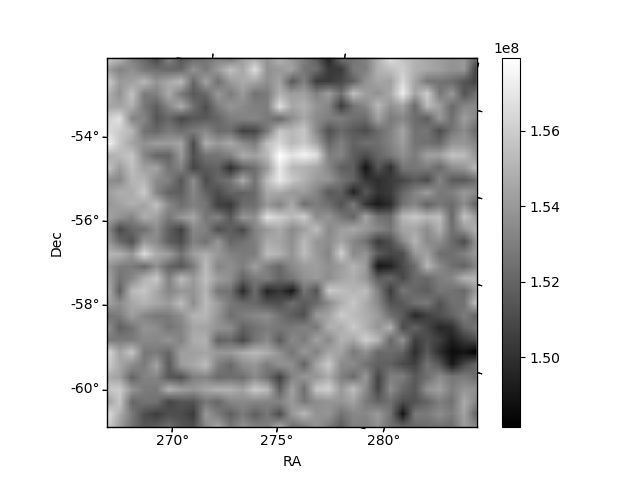
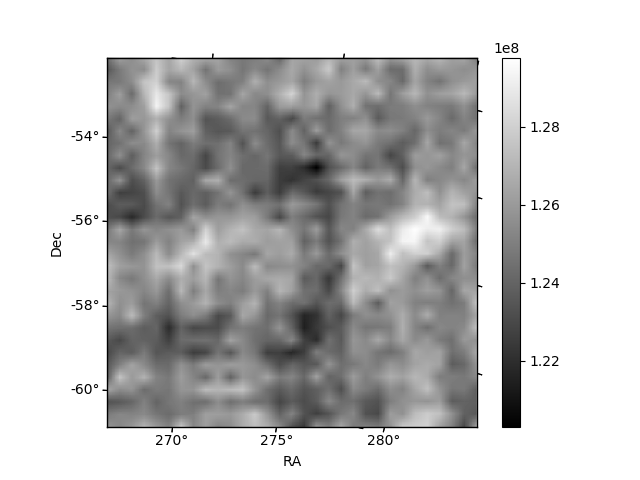
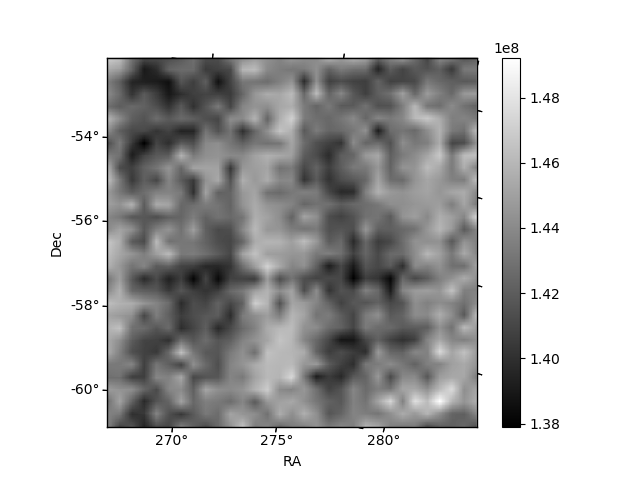
Histogram calculated using DETX and DETY for each event in the final _common_clean file
| Quadrant A | 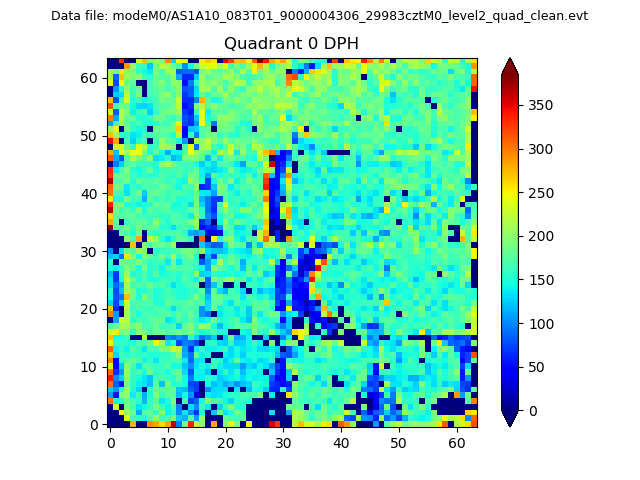 |
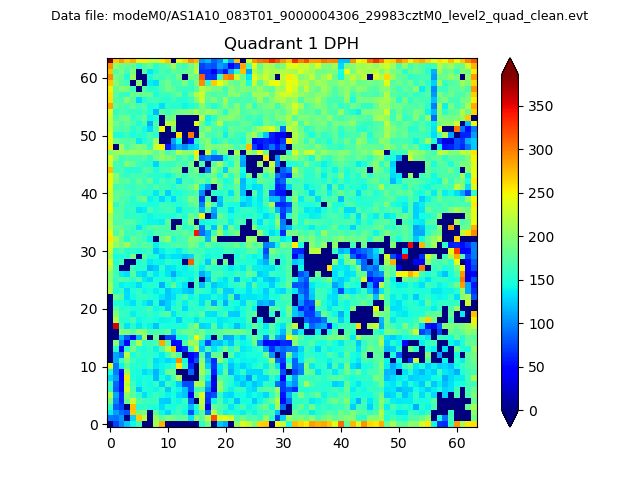 |
Quadrant B |
|---|---|---|---|
| Quadrant D | 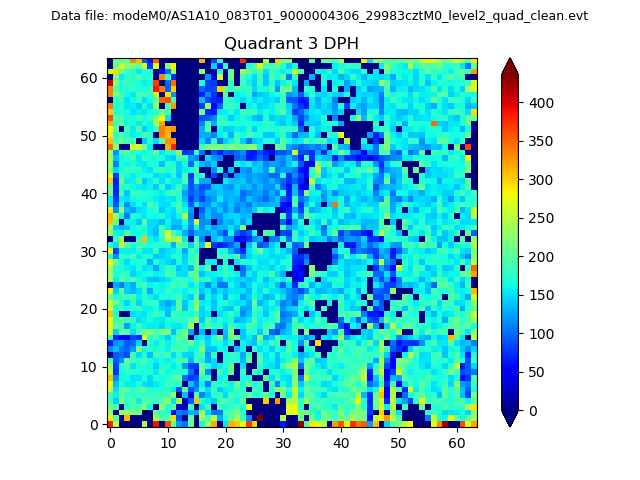 |
 |
Quadrant C |
| Plot type | Count rate plots | Images |
|---|---|---|
| Comparison with Poisson distribution Blue bars denote a histogram of data divided into 1 sec bins. Red curve is a Poisson curve with rate = median count rate of data. |
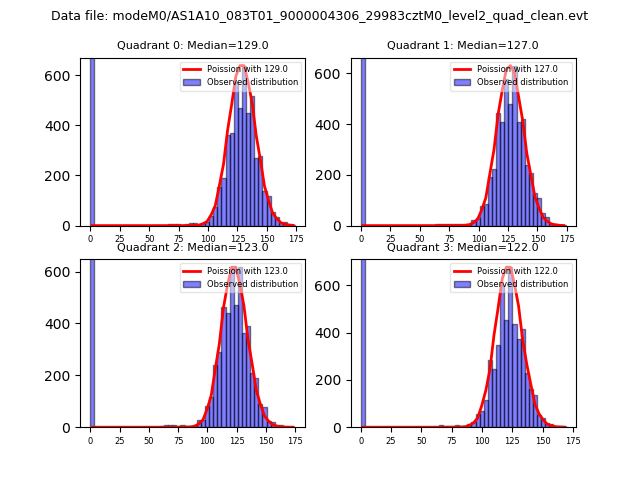 |
 |
| Quadrant-wise count rates Data is divided into 100 sec bins |
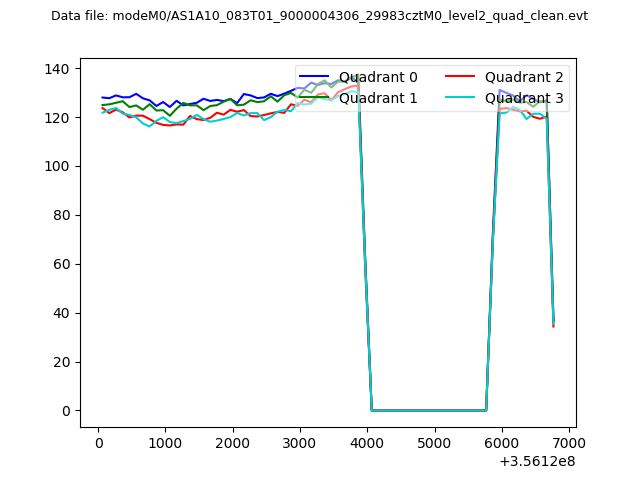 |
|
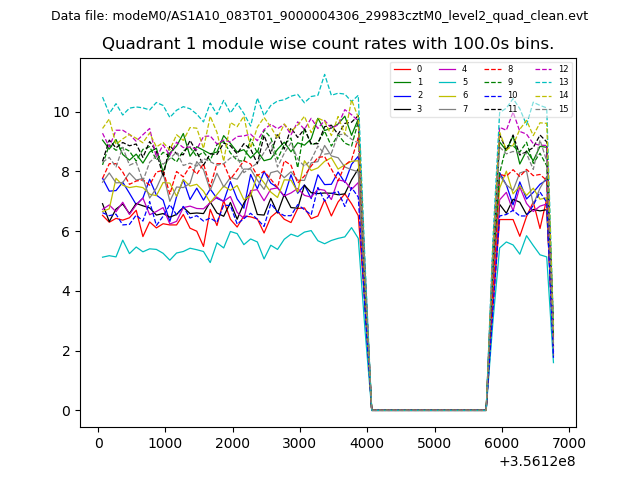
| Module-wise count rates for Quadrant A Data is divided into 100 sec bins |
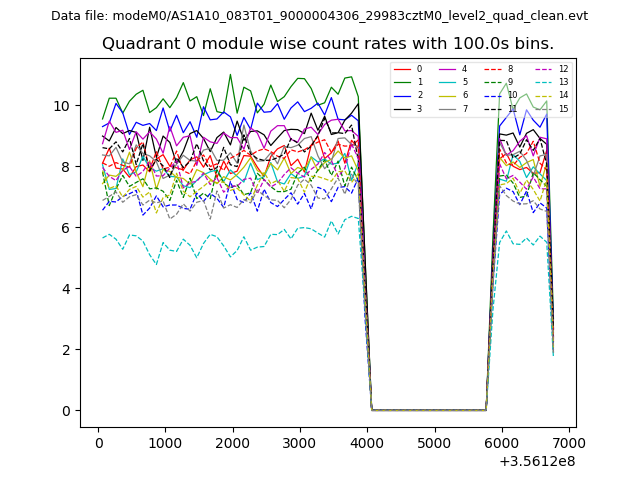 |
 |
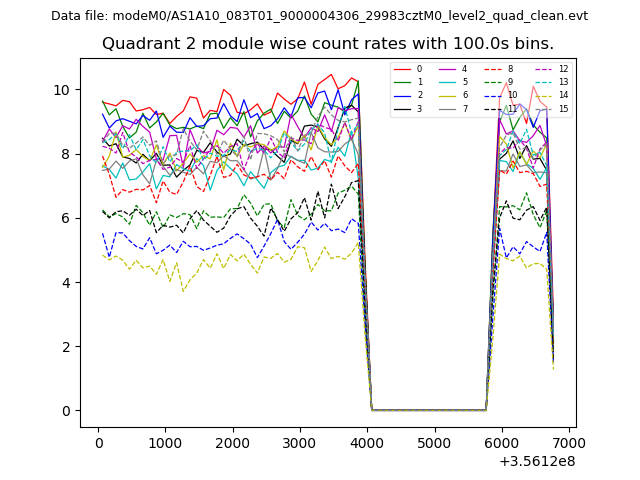
| Module-wise count rates for Quadrant B Data is divided into 100 sec bins |
 |
 |
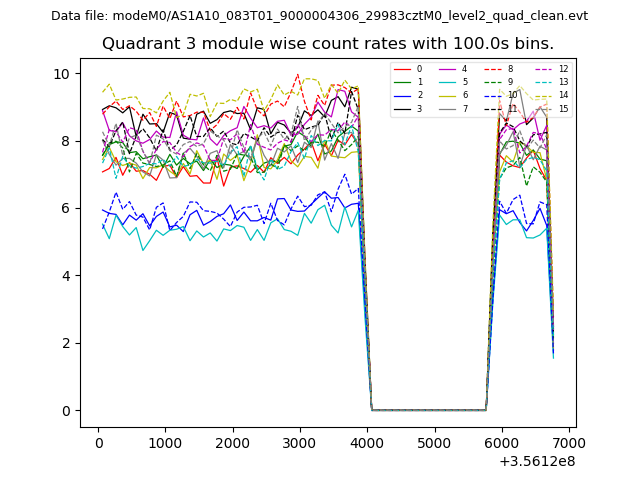
| Module-wise count rates for Quadrant C Data is divided into 100 sec bins |
 |
 |
| Module-wise count rates for Quadrant D Data is divided into 100 sec bins |
 |
 |
| Parameter | Plot |
|---|---|
| CZT HV Monitor | 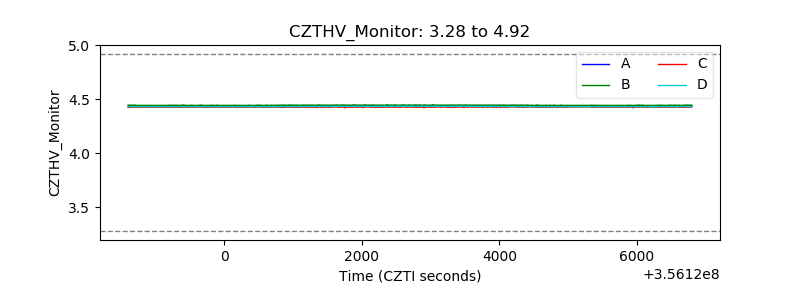 |
| D_VDD | 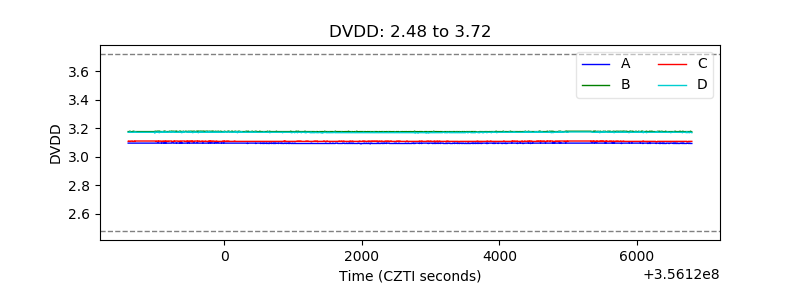 |
| Temperature 1 | 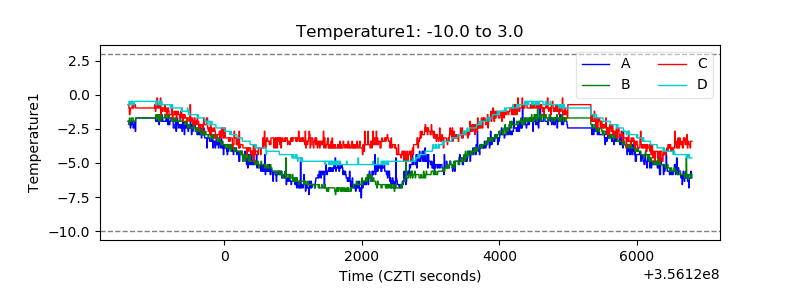 |
| Veto HV Monitor | 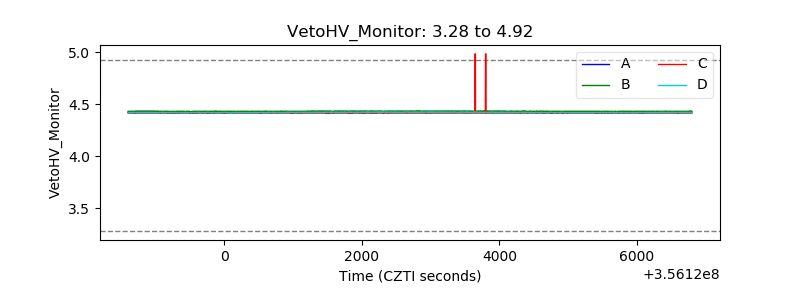 |
| Veto LLD | 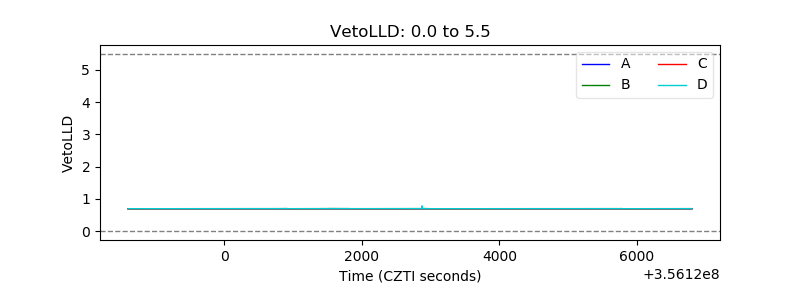 |
| Alpha Counter | 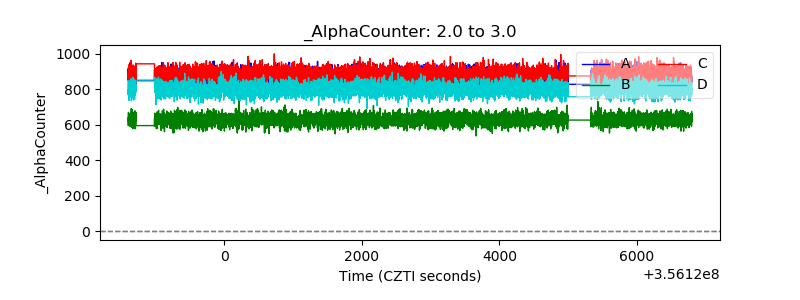 |
| _CPM_Rate | 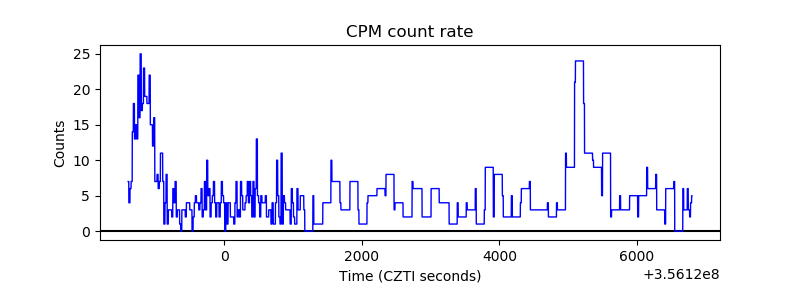 |
| CZT Counter |  |
| +2.5 Volts monitor | 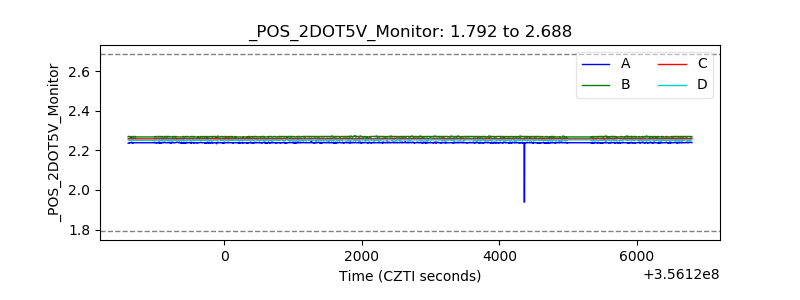 |
| +5 Volts monitor |  |
| _ROLL_ROT | 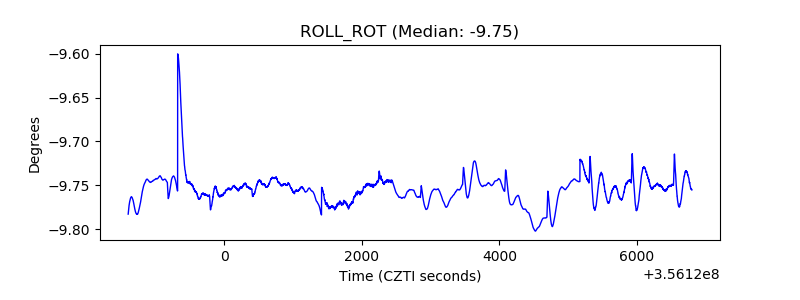 |
| _Roll_DEC | 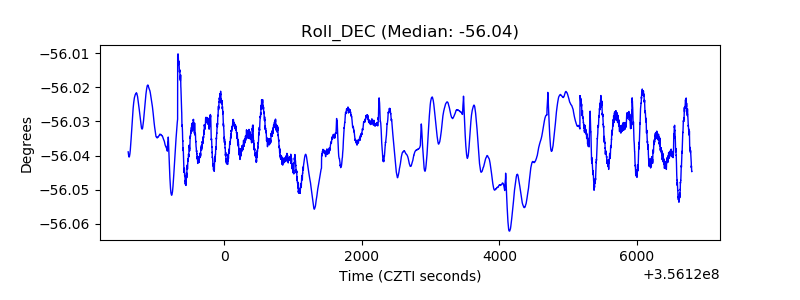 |
| _Roll_RA | 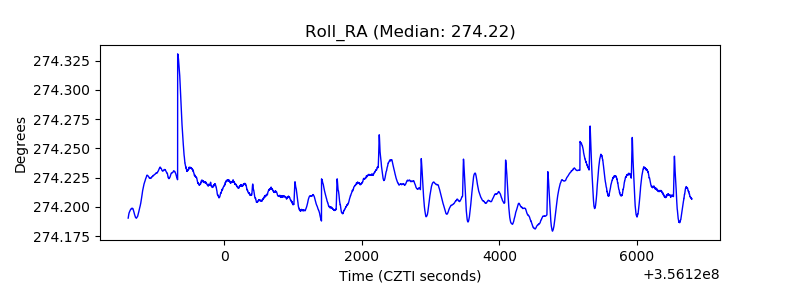 |
| Veto Counter | 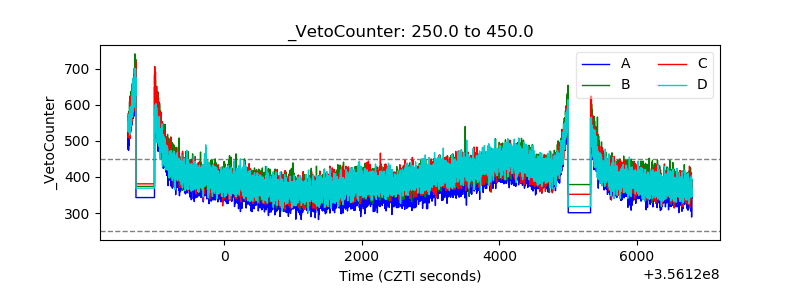 |