| Param | Original file | Final file |
|---|---|---|
| Filename | modeM0/AS1A10_083T01_9000004306_29986cztM0_level2.evt | modeM0/AS1A10_083T01_9000004306_29986cztM0_level2_quad_clean.evt |
| Size (bytes) | 545,483,520 | 86,757,120 |
| Size | 520.2 MB | 82.7 MB |
| Events in quadrant A | 3,439,757 | 548,698 |
| Events in quadrant B | 5,464,582 | 542,590 |
| Events in quadrant C | 3,494,518 | 523,235 |
| Events in quadrant D | 3,639,118 | 517,416 |
| Mode M9 | |||
|---|---|---|---|
| Quadrant | BADHDUFLAG | Total packets | Discarded packets |
| A | 0 | 7 | 0 |
| B | 0 | 7 | 0 |
| C | 0 | 7 | 0 |
| D | 0 | 7 | 0 |
| Mode M0 | |||
|---|---|---|---|
| Quadrant | BADHDUFLAG | Total packets | Discarded packets |
| A | 0 | 14785 | 2 |
| B | 0 | 21457 | 2 |
| C | 0 | 14760 | 2 |
| D | 0 | 15326 | 2 |
| Mode SS | |||
|---|---|---|---|
| Quadrant | BADHDUFLAG | Total packets | Discarded packets |
| A | 0 | 148 | 0 |
| B | 0 | 148 | 0 |
| C | 0 | 148 | 0 |
| D | 0 | 148 | 0 |
| Quadrant | Total seconds | Saturated seconds | Saturation percentage |
|---|---|---|---|
| A | 7104 | 71 | 0.999437% |
| B | 7104 | 166 | 2.336712% |
| C | 7105 | 88 | 1.238564% |
| D | 7105 | 39 | 0.548909% |
Noise dominated data is calculated using 1-second bins in cleaned event files. If a bin has >2000 counts, and if more than 50% of those come from <1% of pixels, then it is considered to be noise-dominated and hence unusable.
| Quadrant | # 1 sec bins | Bins with >0 counts | Bins with >2000 counts | High rate bins dominated by noise | Noise dominated (total time) | Noise dominated (detector-on time) | Marked lightcurve |
|---|---|---|---|---|---|---|---|
| A | 7864 | 7106 | 4 | 4 | 0.05% | 0.06% | 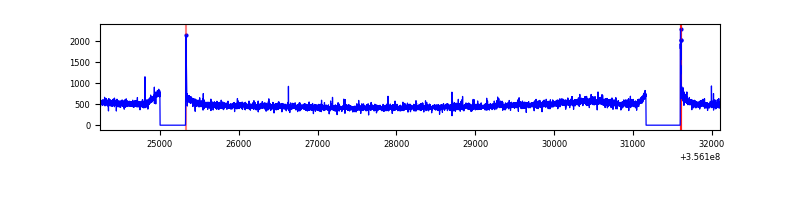 |
| B | 7864 | 7106 | 3 | 3 | 0.04% | 0.04% | 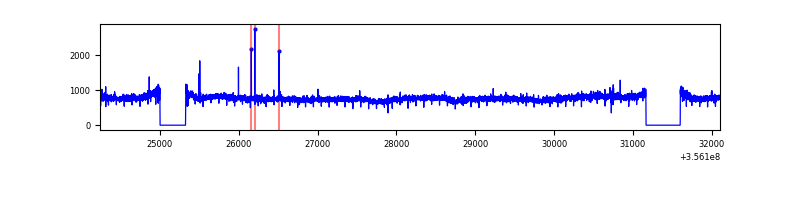 |
| C | 7865 | 7107 | 0 | 0 | 0.00% | 0.00% | 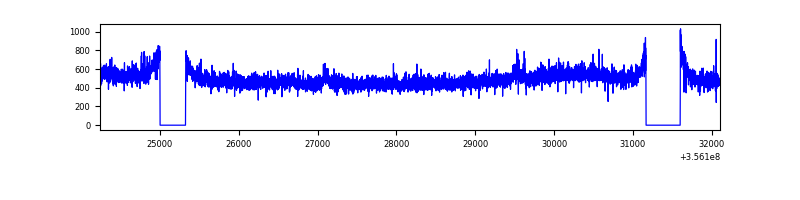 |
| D | 7865 | 7107 | 18 | 18 | 0.23% | 0.25% | 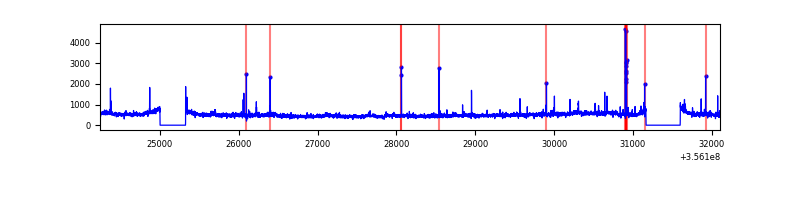 |
Top three noisy pixels from each quadrant. If the there are fewer than three noisy pixels in the level2.evt file, extra rows are filled as -1
| Pixel properties | Quadrant properties | ||||||
|---|---|---|---|---|---|---|---|
| Quadrant | DetID | PixID | Counts | Sigma | Mean | Median | Sigma |
| A | 3 | 1 | 29852 | 164.27 | 876 | 858 | 176.5 |
| A | 8 | 192 | 26503 | 145.3 | 876 | 858 | 176.5 |
| A | 13 | 254 | 13812 | 73.39 | 876 | 858 | 176.5 |
| B | 6 | 159 | 2050263 | 12278.26 | 862 | 838 | 166.9 |
| B | 12 | 111 | 20665 | 118.79 | 862 | 838 | 166.9 |
| B | 11 | 111 | 18794 | 107.58 | 862 | 838 | 166.9 |
| C | 14 | 238 | 134105 | 681.79 | 836 | 837 | 195.5 |
| C | 3 | 233 | 88158 | 446.73 | 836 | 837 | 195.5 |
| C | 2 | 114 | 17052 | 82.95 | 836 | 837 | 195.5 |
| D | 8 | 195 | 283862 | 1410.17 | 847 | 822 | 200.7 |
| D | 7 | 69 | 48537 | 237.73 | 847 | 822 | 200.7 |
| D | 2 | 234 | 31710 | 153.89 | 847 | 822 | 200.7 |
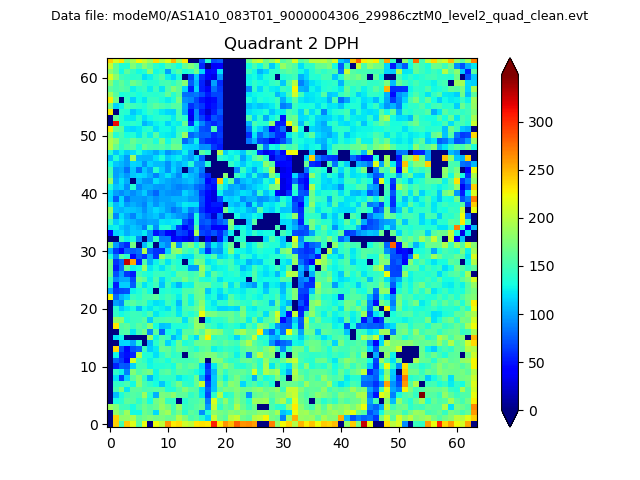
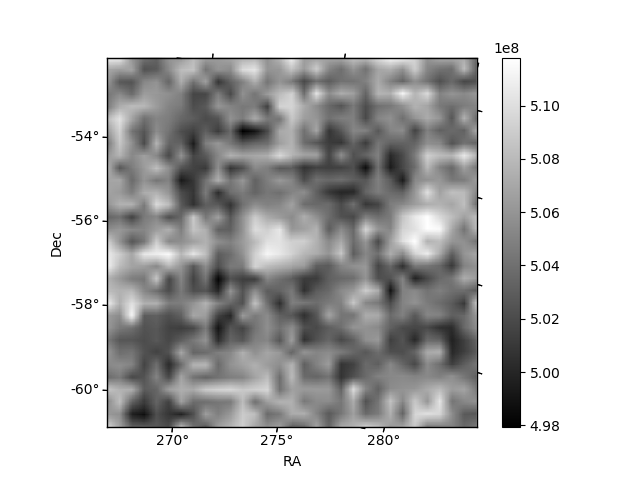
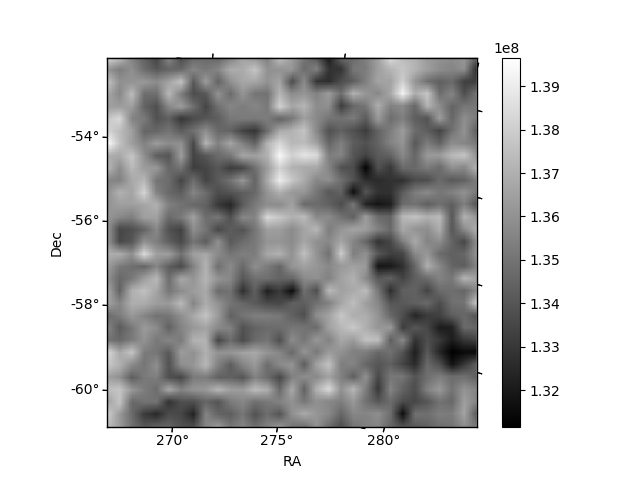
Histogram calculated using DETX and DETY for each event in the final _common_clean file
| Quadrant A | 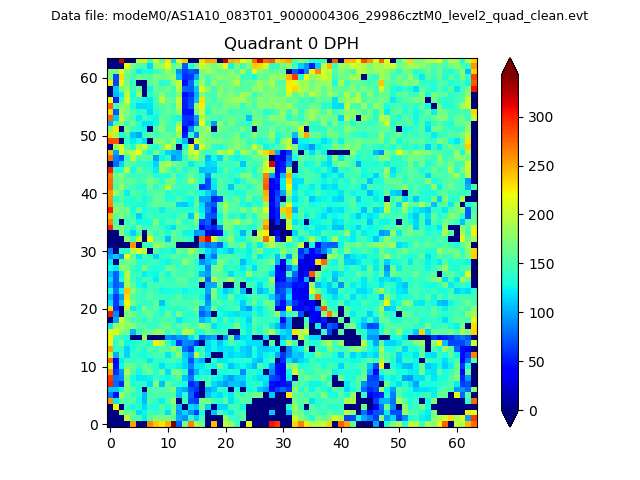 |
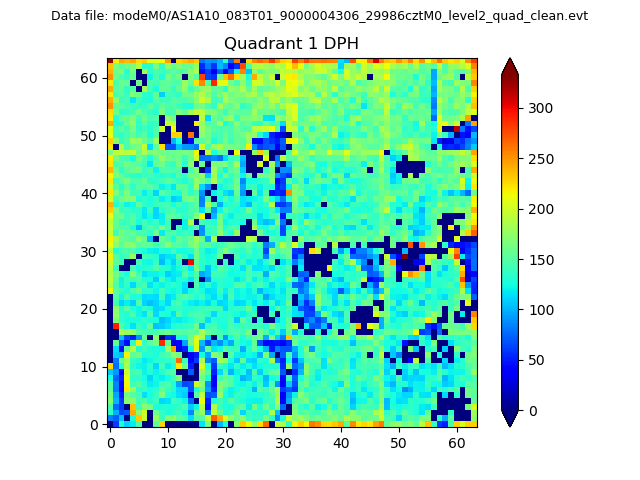 |
Quadrant B |
|---|---|---|---|
| Quadrant D | 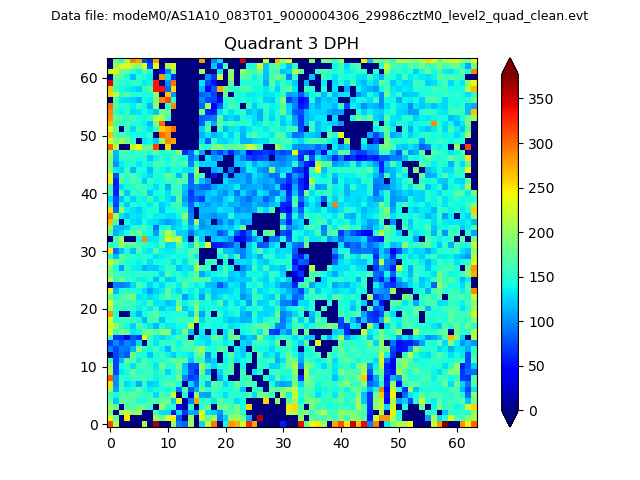 |
 |
Quadrant C |
| Plot type | Count rate plots | Images |
|---|---|---|
| Comparison with Poisson distribution Blue bars denote a histogram of data divided into 1 sec bins. Red curve is a Poisson curve with rate = median count rate of data. |
 |
 |
| Quadrant-wise count rates Data is divided into 100 sec bins |
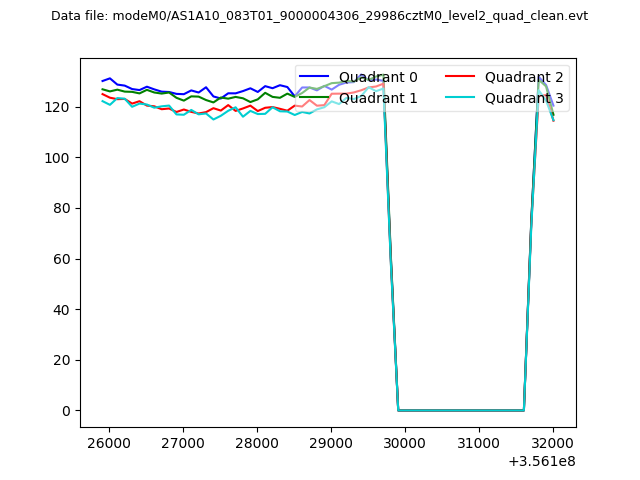 |
|
| Module-wise count rates for Quadrant A Data is divided into 100 sec bins |
 |
 |
| Module-wise count rates for Quadrant B Data is divided into 100 sec bins |
 |
 |
| Module-wise count rates for Quadrant C Data is divided into 100 sec bins |
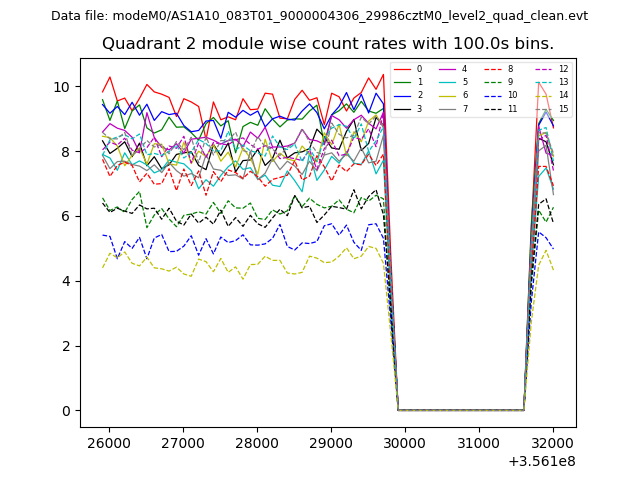 |
 |
| Module-wise count rates for Quadrant D Data is divided into 100 sec bins |
 |
 |
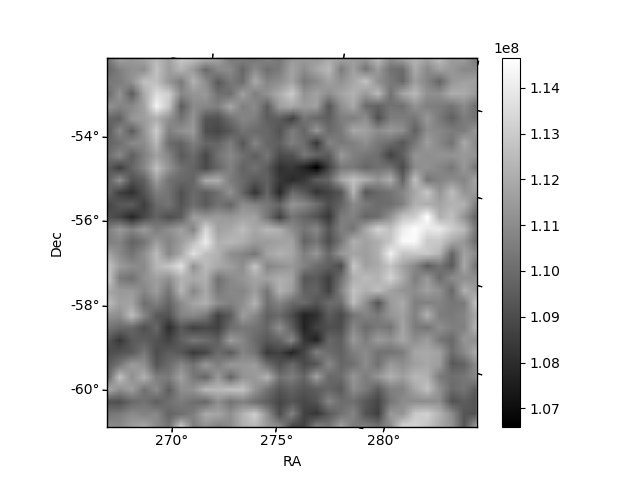
| Parameter | Plot |
|---|---|
| CZT HV Monitor | 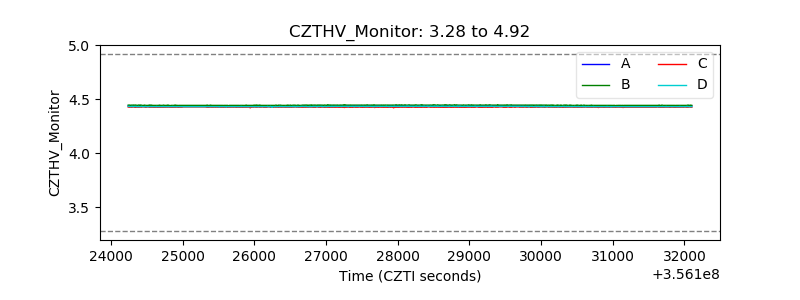 |
| D_VDD | 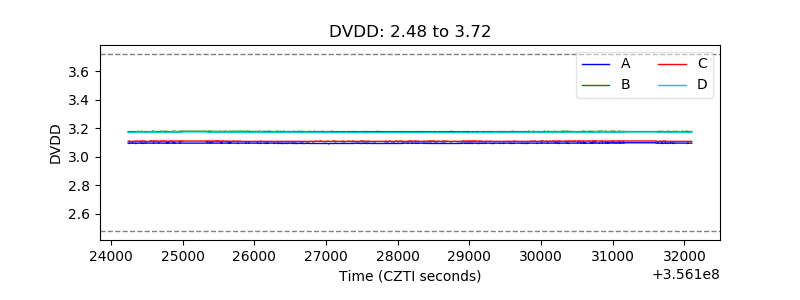 |
| Temperature 1 |  |
| Veto HV Monitor | 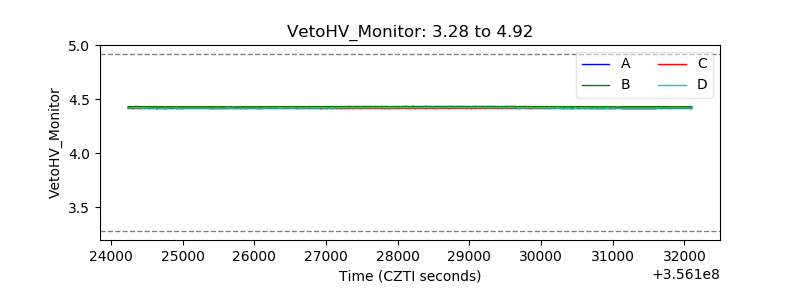 |
| Veto LLD | 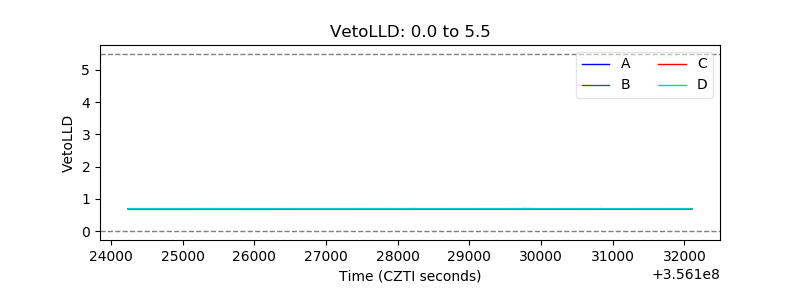 |
| Alpha Counter | 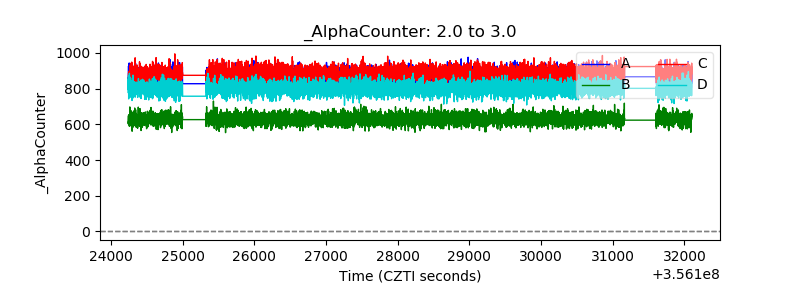 |
| _CPM_Rate | 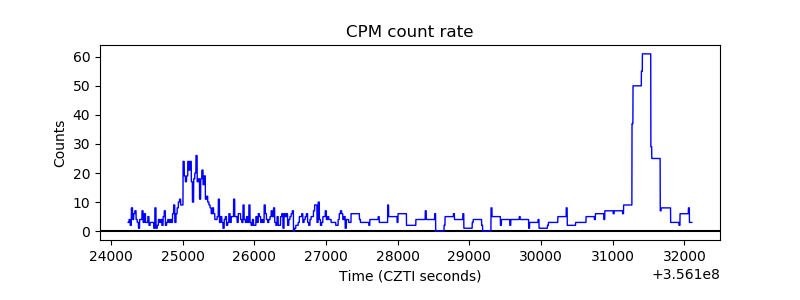 |
| CZT Counter | 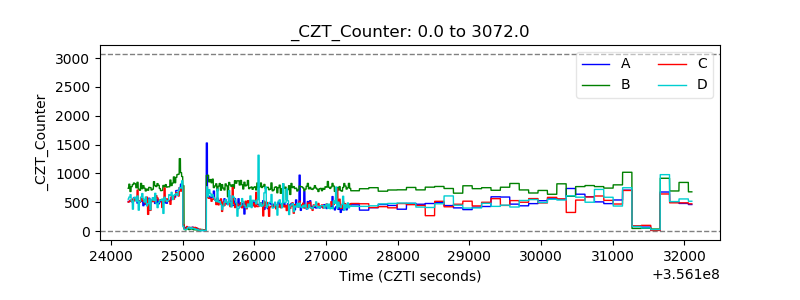 |
| +2.5 Volts monitor |  |
| +5 Volts monitor |  |
| _ROLL_ROT |  |
| _Roll_DEC |  |
| _Roll_RA | 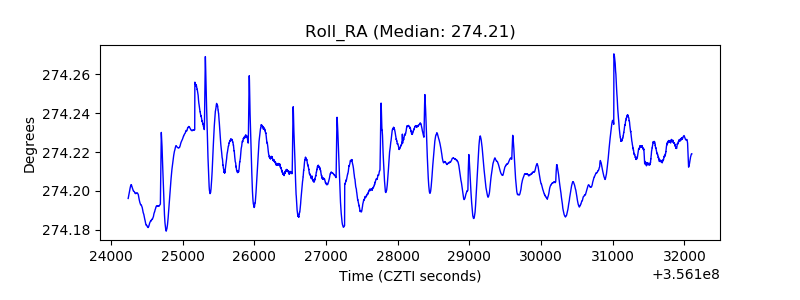 |
| Veto Counter |  |