| Param | Original file | Final file |
|---|---|---|
| Filename | modeM0/AS1A10_094T16_9000004304cztM0_level2.fits | modeM0/AS1A10_094T16_9000004304cztM0_level2_quad_clean.evt |
| Size (bytes) | 82,195,200 | 81,826,560 |
| Size | 78.4 MB | 78.0 MB |
| Events in quadrant A | 513,672 | 508,647 |
| Events in quadrant B | 475,492 | 490,170 |
| Events in quadrant C | 490,446 | 466,410 |
| Events in quadrant D | 438,084 | 439,953 |
| Mode SS | |||
|---|---|---|---|
| Quadrant | BADHDUFLAG | Total packets | Discarded packets |
| A | 0 | 168 | 0 |
| B | 0 | 168 | 0 |
| C | 0 | 168 | 0 |
| D | 0 | 168 | 0 |
| Mode M9 | |||
|---|---|---|---|
| Quadrant | BADHDUFLAG | Total packets | Discarded packets |
| A | 0 | 16 | 0 |
| B | 0 | 16 | 0 |
| C | 0 | 16 | 0 |
| D | 0 | 16 | 0 |
| Mode M0 | |||
|---|---|---|---|
| Quadrant | BADHDUFLAG | Total packets | Discarded packets |
| A | 0 | 17117 | 0 |
| B | 0 | 25925 | 0 |
| C | 0 | 18285 | 0 |
| D | 0 | 18441 | 0 |
| Quadrant | Total seconds | Saturated seconds | Saturation percentage |
|---|---|---|---|
| A | 8232 | 114 | 1.384840% |
| B | 8232 | 228 | 2.769679% |
| C | 8232 | 140 | 1.700680% |
| D | 8232 | 80 | 0.971817% |
Noise dominated data is calculated using 1-second bins in cleaned event files. If a bin has >2000 counts, and if more than 50% of those come from <1% of pixels, then it is considered to be noise-dominated and hence unusable.
| Quadrant | # 1 sec bins | Bins with >0 counts | Bins with >2000 counts | High rate bins dominated by noise | Noise dominated (total time) | Noise dominated (detector-on time) | Marked lightcurve |
|---|---|---|---|---|---|---|---|
| A | 9807 | 8232 | 0 | 0 | 0.00% | 0.00% |  |
| B | 9807 | 8232 | 0 | 0 | 0.00% | 0.00% |  |
| C | 9806 | 8231 | 0 | 0 | 0.00% | 0.00% |  |
| D | 9807 | 8232 | 0 | 0 | 0.00% | 0.00% |  |
Top three noisy pixels from each quadrant. If the there are fewer than three noisy pixels in the level2.evt file, extra rows are filled as -1
| Pixel properties | Quadrant properties | ||||||
|---|---|---|---|---|---|---|---|
| Quadrant | DetID | PixID | Counts | Sigma | Mean | Median | Sigma |
| A | 0 | 29 | 521 | 11.37 | 134 | 126 | 34.7 |
| A | 9 | 19 | 400 | 7.88 | 134 | 126 | 34.7 |
| A | 0 | 30 | 395 | 7.74 | 134 | 126 | 34.7 |
| B | 2 | 9 | 389 | 10.06 | 125 | 121 | 26.7 |
| B | 3 | 80 | 336 | 8.07 | 125 | 121 | 26.7 |
| B | 2 | 8 | 332 | 7.92 | 125 | 121 | 26.7 |
| C | 3 | 202 | 364 | 7.13 | 129 | 121 | 34.1 |
| C | 3 | 187 | 346 | 6.6 | 129 | 121 | 34.1 |
| C | 3 | 203 | 344 | 6.54 | 129 | 121 | 34.1 |
| D | 15 | 46 | 349 | 6.71 | 125 | 114 | 35.0 |
| D | 4 | 246 | 342 | 6.51 | 125 | 114 | 35.0 |
| D | 6 | 67 | 332 | 6.22 | 125 | 114 | 35.0 |
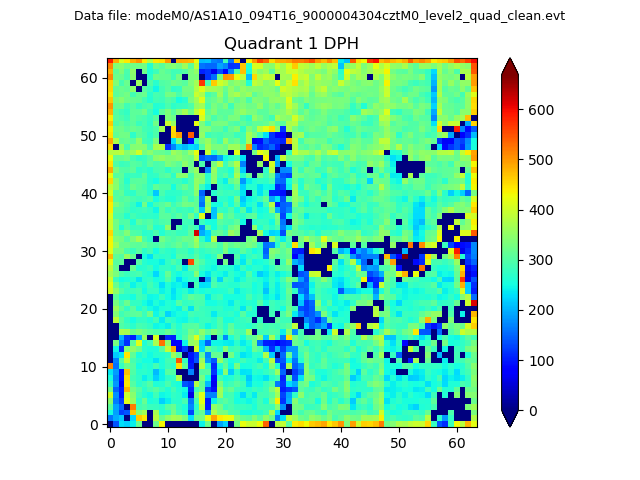
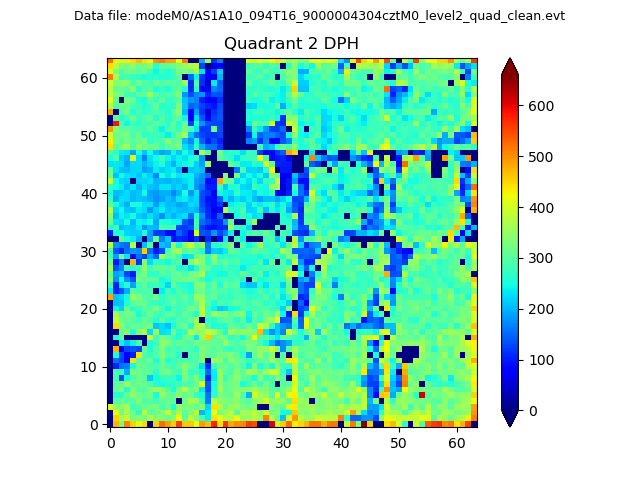
Histogram calculated using DETX and DETY for each event in the final _common_clean file
| Quadrant A |  |
 |
Quadrant B |
|---|---|---|---|
| Quadrant D |  |
 |
Quadrant C |
| Plot type | Count rate plots | Images |
|---|---|---|
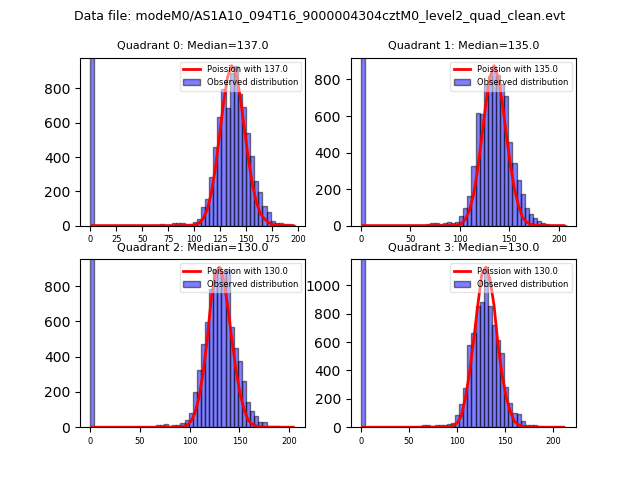
| Comparison with Poisson distribution Blue bars denote a histogram of data divided into 1 sec bins. Red curve is a Poisson curve with rate = median count rate of data. |
 |
 |
| Quadrant-wise count rates Data is divided into 100 sec bins |
 |
|
| Module-wise count rates for Quadrant A Data is divided into 100 sec bins |
 |
 |
| Module-wise count rates for Quadrant B Data is divided into 100 sec bins |
 |
 |
| Module-wise count rates for Quadrant C Data is divided into 100 sec bins |
 |
 |
| Module-wise count rates for Quadrant D Data is divided into 100 sec bins |
 |
 |
| Parameter | Plot |
|---|---|
| CZT HV Monitor |  |
| D_VDD |  |
| Temperature 1 |  |
| Veto HV Monitor |  |
| Veto LLD |  |
| Alpha Counter |  |
| _CPM_Rate |  |
| CZT Counter |  |
| +2.5 Volts monitor |  |
| +5 Volts monitor |  |
| _ROLL_ROT |  |
| _Roll_DEC | 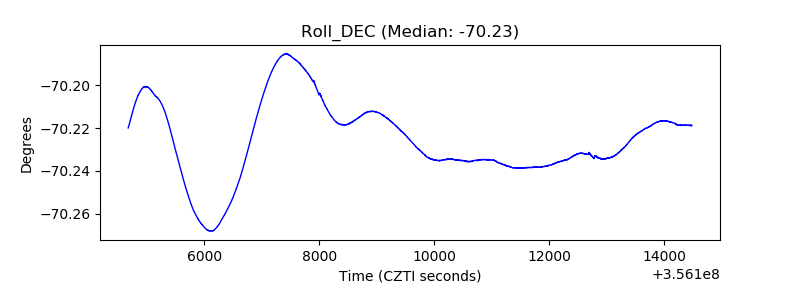 |
| _Roll_RA |  |
| Veto Counter |  |